

Structured Abstract
Objective:
Spoken communication is better when one can see as well as hear the talker. Although age-related deficits in speech perception were observed, Tye-Murray and colleagues (Tye-Murray, Spehar, Myerson, Hale, & Sommers, 2016) found that audiovisual (AV) performance could be accurately predicted from auditory-only (A-only) and visual-only (V-only) performance, and that knowing individuals’ ages did not increase the accuracy of prediction. This finding contradicts conventional wisdom, according to which age-related differences in AV speech perception are due to deficits in the integration of auditory and visual information, and our primary goal was to determine whether Tye-Murray et al.’s finding with a closed-set test generalizes to situations more like those in everyday life. A second goal was to test a new predictive model that has important implications for audiological assessment.
Design:
Participants (N=109; ages 22–93 years), previously studied by Tye-Murray et al. (2016), were administered our new, open-set Lex-List test to assess their auditory, visual, and audiovisual perception of individual words. All testing was conducted in six-talker babble (three males and three females) presented at approximately 62 dB SPL. The level of the audio for the Lex-List items, when presented, was approximately 59 dB SPL because pilot testing suggested that this signal-to-noise ratio would avoid ceiling performance in the AV condition.
Results:
Multiple linear regression analyses revealed that A-only and V-only performance accounted for 87.9% of the variance in AV speech perception, and that the contribution of age failed to reach significance. Our new parabolic model accounted for even more (92.8%) of the variance in AV performance, and again, the contribution of age was not significant. Bayesian analyses revealed that for both linear and parabolic models, the present data were almost 10 times as likely to occur with a reduced model (without Age) than with a full model (with Age as a predictor). Furthermore, comparison of the two reduced models revealed that the data were more than 100 times as likely to occur with the parabolic model than with the linear regression model.
Conclusions:
The present results strongly support Tye-Murray et al.’s (2016) hypothesis that AV performance can be accurately predicted from unimodal performance and that knowing individuals’ ages does not increase the accuracy of that prediction. Our results represent an important initial step in extending Tye-Murray et al.’s findings to situations more like those encountered in everyday communication. The accuracy with which speech perception was predicted in this study foreshadows a form of precision audiology in which determining individual strengths and weaknesses in unimodal and multimodal speech perception facilitates identification of targets for rehabilitative efforts aimed at recovering and maintaining speech perception abilities critical to the quality of an older adult’s life.
A standard audiological examination for adults typically includes administration of a speech discrimination test. Such a test consists of a series of unrelated monosyllabic words, such as the NU-6 (Tillman & Carhart, 1966) or W-22 (Silverman & Hirsh, 1955). The test may be administered in a quiet condition or in a condition with background noise, but a patient’s ability to recognize words using only the visual speech signal (lipread) or to recognize words using both the auditory and visual signals in audiovisual (AV) conditions is rarely if ever assessed. Word recognition scores obtained from auditory tests are presumed to indicate how well a patient can recognize speech in everyday communication settings, and therefore these scores are often used for counseling purposes and for motivating the patient to adopt hearing aids.
Ironically, such word recognition scores have only modest ecological validity not just because such scores are based on recognition of single words, but also because most conversations occur face-to-face, where people can both see and hear their communication partners. Failure to acknowledge that spoken communication is an AV event and assess the abilities that are needed as a result limits what audiologists can infer and say about everyday situations because adults vary widely in their ability to lipread, with some scoring 0% and some scoring over 80% words correct on word lists presented in a V-only condition (e.g., Sommers, Tye-Murray, & Spehar, 2005).
Aging further complicates the assessment of speech perception ability. People typically benefit from being able to see as well as hear the talker, especially in noisy situations (for reviews, see Campbell, 2007; Peelle & Sommers, 2015). However, vision-only (V-only) speech perception declines with age, even in those with corrected-to-normal visual acuity (e.g., Sommers et al., 2015; Tye-Murray et al., 2016). A younger adult and an older adult may have identical auditory word recognition scores, but their ability to participate in everyday conversations may be vastly different because age-related declines in lipreading ability may make the older adult less able to benefit from seeing as well as hearing the talker. However, it is currently unclear whether this is because of the differences in lipreading ability, or whether in addition, older adults are less able to integrate the visual and auditory speech signals.
Both age and individual differences in AV speech perception are often attributed to differences in the ability to integrate visual and auditory speech information. Even researchers who disagree about the underlying mechanisms have tended to agree that AV integration represents a distinct function that plays an important role in individual differences in AV speech perception (Blamey, Cowan, Alcantara, Whitford, & Clark, 1989; Braida, 1991; Grant, Walden, & Seitz, 1998; Massaro, 1996), and many studies of age-related differences in multi-sensory integration have proceeded based on the assumption that there is an age-related integration deficit (for a recent review, see de Dieuleveult, Siemonsma, van Erp, & Brouwer, 2017).
While the results of some recent studies are consistent with this view (Gordon & Allen, 2009; Legault, Gagné, Rhoualem, & Anderson-Gosselin, 2010), other studies raise questions as to its validity (Avivi-Reich, Puka, & Schneider, 2018; Stevenson et al., 2015; Tye-Murray et al., 2016). Neither Avivi-Reich et al. nor Tye-Murray et al., for example, found evidence of an age-related deficit, and while Stevenson et al. reported a deficit in whole word perception at low SNRs, they found that at intermediate SNRs, older adults actually benefited more than younger adults from AV speech than was predicted based on unimodal performance. Moreover, Stevenson et al. also observed equivalent benefits of AV presentation of phonemes, and a number of studies of audiovisual perception of nonspeech stimuli also have failed to find evidence of age-related deficits, with some even finding enhanced integration (e.g., DeLoss, Pierce, & Andersen, 2013; Hernández, Setti, Kenny, & Newell, 2019).
Many factors, including fundamental statistical and measurement issues (Holmes, 2009), contribute to the inconsistency of these results (Stevenson et al., 2015; Tye-Murray, Sommers, Spehar, Myerson, & Hale, 2010) as well as differences in the nature of the stimuli (Stevenson et al., 2015). As a result, they appear to provide little guidance for those involved in audiological assessment. In addition to the lack of consensus, it should be noted that the focus in previous studies has been on differences between age groups whereas the focus in audiological assessment is on differences between individuals. Clearly, both individual and group differences are appropriate targets for research on speech perception, and our understanding of one may have important implications for understanding the other. Nevertheless, we would highlight the fact that the present study takes an individual differences approach in which the goal is to understand how to predict an individual’s speech perception ability as precisely and parsimoniously as possible, while expanding the focus to the everyday problem of AV communication.
In a previous study, we (Tye-Murray et al., 2016) examined speech perception in adults aged 22–93 years and found that if, for each participant, one focused on conditions that combined visual and auditory speech signals which each produced approximately 30% accuracy when presented separately, then the age-related decline in AV performance was completely eliminated. Converging evidence was provided by multiple regression analyses showing that once differences in Auditory-only (A-only) and V-only performance were controlled for statistically, age was no longer a significant predictor of AV speech perception. Moreover, Sommers, Spehar, Tye-Murray, Myerson, and Hale (2020) recently reported that when differences in unimodal performance were statistically controlled, age did not make a significant contribution to individual differences in AV speech perception across speaking rates that were both faster and slower than those usually encountered. Although the results of the Tye-Murray et al. study were unequivocal, as Feld and Sommers (2009) have noted, the speech perception task that they used, the Build-A-Sentence (BAS) test, has certain characteristics that might limit the generality of their findings.
More specifically, Feld and Sommers (2009) pointed out that the closed-set matrix BAS has high reliability but low ecological validity, and therefore they suggested replicating its results using methods that more closely approximate real-world listening situations. For example, within a condition the participants in Tye-Murray et al. (2016) always selected their responses from the same closed set, displayed on the computer screen, in order to minimize floor effects, especially in conditions with blurred visual stimuli which were the focus of their study. Moreover, because the focus was on visual perception and its contribution to AV speech recognition, Tye-Murray et al. individually adjusted the noise level so that A-only performance was approximately the same for all participants, regardless of their age and hearing ability. In everyday life, however, older adults do not get to play on a level playing field but instead must cope with the same noisy listening situations as younger adults. Thus, while individually adjusted noise levels can be useful experimentally, they both decrease the ecological validity of the testing situation and introduce a potential confound because participants not only differ in age, they are tested under different conditions.
Audiological assessment is a complicated process, and without knowing a person’s ability to benefit from the visual speech signal, the audiological exams which are the foundation of such assessment are less informative than they could be. Fortunately, the word recognition abilities of the participants in the Tye-Murray et al. (2016) also were assessed using a more traditional test format in which the words were to be recognized were presented at the end of a neutral carrier sentence as well as with the BAS in part to lay the groundwork for an efficient means to incorporate visual speech assessment into audiological diagnostic practice. As a result, we were able to revisit the results from the traditional tests and analyze and interpret them with the hindsight provided by the analyses of the BAS data from the same participants reported in our previous paper (Tye-Murray et al., 2016). In both cases, we focused on participants’ perception of individual words in part because the benefits provided by semantic context can vary greatly, creating potential difficulties for both researchers and clinicians who, for purposes of assessment, need to equate those benefits across both participants and conditions.
The present study tests Tye-Murray et al.’s (2016) hypothesis that a person’s age has no direct effect on their AV word perception ability, but only indirect effects reflecting age-related differences in unimodal perception. This hypothesis is assessed using traditional null hypothesis tests as well a Bayesian statistical approach that we believe is more appropriate for addressing this fundamental issue. Unlike traditional statistics, which may result in rejection, but never acceptance, of the null-hypothesis, Bayesian statistics allow one to compare the evidence for a null hypothesis model and alternative models on a level playing field (Jarosz & Wiley, 2014). Although multiple regression revealed that age did not account for additional significant variance in AV performance in the Tye-Murray et al. study over and above the approximately 60% accounted for by A-only and V-only performance, that left nearly 40% or more of the variance unexplained.
Moreover, examination of the fits of multiple regression models to the Tye-Murray et al. (2016) data revealed a systematic pattern in the residuals. The models’ predictions of AV performance were reasonably accurate for conditions in which unimodal presentations were of moderate difficulty. Importantly, however, AV performance was systematically over-estimated both when individuals’ unimodal performance was very poor in both A-only and V-only conditions and when individuals’ unimodal performance was very good in both A-only and V-only conditions. In the latter case, predicted AV performance often exceeded 100%. Systematic patterns like these in the residuals of fits using linear models strongly suggested that the unexplained variance was not simply ‘noise’ (e.g., measurement error) and called out for nonlinear models.
These patterns, however, are not unprecedented. Whereas some studies have reported that the benefits to word perception of adding visual speech information to auditory speech information increase as the signal-to-noise ratio (SNR) of the auditory stimuli decreases, consistent with the Principle of Inverse Effectiveness or PoIE (Meridith & Stein, 1986), Ross and colleagues found that the benefit to word perception of seeing the talker was greater at a moderate noise level than when the SNR was more extreme, either very low or very high (Ross, Saint-Amour, Leavitt, Javitt, & Foxe, 2007), suggesting a nonlinear relation. Ma, Zhou, Ross, Foxe, and Parra (2009) subsequently replicated this finding and proposed a Bayesian cue-integration model that predicts that the maximum benefit occurs at moderate noise levels.
This finding by Ross et al. (2007) and Ma et al. (2009) implies that perception benefits the most from the information provided by new, additional cues when perception without these cues is moderately difficult (rather than when it is extremely difficult), and that this is true not only when difficulty varies with attributes of the stimuli (e.g., SNR), but also with attributes of the perceiver. More specifically, the amount of benefit for a specific individual will be affected by their individual speech perception ability, unimodal and/or multimodal (e.g., in a situation where speech perception is, on average, moderately difficult, those of average ability will benefit more from the addition of visual cues than those of low or high ability). If this generalization to individual differences is correct, then the results could have important implications for audiology. For example, a mathematical model of how perceptual accuracy varies with individual ability could be used to predict how much the accuracy of a person’s speech perception will improve if they use a hearing aid or if they learn to be a better lipreader.
The utility of such a model for describing individual differences will depend not only on how accurate its predictions are, but also how parsimonious it is. Adding free parameters may improve accuracy, but it may also lead to ‘over-fitting’ whereby improved accuracy comes at the cost of decreased replicability (Lever, Krzywinski & Altman, 2016). Accordingly, we now propose a nonlinear (parabolic) model that combines an individual’s A-only and V-only performance according to the basic laws of probability, and we hypothesize that such a model will enable unimodal performance to account for even more of the variance in AV speech perception. This would potentially provide even stronger support for the radical hypothesis that unimodal performance entirely accounts for AV performance. If this hypothesis is correct, one should be able to assess performance in only two of three communication modalities (i.e., A-only, V-only, AV) and then algebraically estimate the third. Moreover, as we will show by fitting alternative models to the same data, our parabolic model is both more accurate and more parsimonious than a corresponding multiple (linear) regression model.
Thus, the present study had two major goals. First, unlike Tye-Murray et al. (2016), who used the closed-set BAS test to assess A-only, V-only, and AV speech perception, this study tested the same participants using an open-set word recognition task similar to that commonly used in clinical settings. Our aim here was to assess the generality of Tye-Murray et al.’s finding that regardless of their age, adults’ AV speech perception can be accurately predicted from their unimodal speech perception without taking into account putative age-related differences in AV integration. Second, we tested a new parabolic model of AV speech perception with potential clinical applications that we hypothesized would describe performance both more accurately and more parsimoniously than multiple linear regression, our aim here being to provide a potentially useful clinical tool for assessing individual patients.
Methods
Participants
One-hundred and nine volunteers, ages 22–93 years (M = 58.0 yrs, SD = 22.4), served as participants. Testing was conducted as part of a larger test battery and was administered over three sessions, each lasting approximately 2.5 hours (Tye-Murray et al., 2016). A breakdown of the characteristics of these participants divided into five age group is provided in Table 1 of Tye-Murray et al. (2016). All participants were native English-speaking community-dwelling residents and were recruited through the Volunteers for Health program at Washington University School of Medicine. They received $10/hour for their participation. On average, they had completed 15.2 years of education (SD = 2.4). Participants were screened to exclude those who had adverse neurological events such as stroke and open or closed head injury. Individuals who scored below 24 on the Mini Mental Status Exam (Folstein, Folstein, & McHugh, 1975) also were excluded from the study.
Table 1.
Intercorrelations of age and speech perception measures.
| A Filler | V Filler | AV Filler | A Target | V Target | AV Target | |
|---|---|---|---|---|---|---|
| Age | −.834 | −.494 | −.727 | −.758 | −.503 | −.687 |
| A Filler | .539 | .836 | .897 | .557 | .804 | |
| V Filler | .801 | .475 | .932 | .732 | ||
| AV Filler | .761 | .796 | .915 | |||
| A Target | .510 | .761 | ||||
| V Target | .743 |
Participants were screened to ensure normal contrast sensitivity using the Pelli-Robson Contrast Sensitivity Chart (M = 1.78, SD = 0.13) and near-field visual acuity equal to or better than 20/40 using the Eger Near Point Equivalent Card (M = 20/29.1, SD of the denominator = 5.1). Participants were allowed to wear their glasses during both screening and testing. As is common in clinical practice, hearing acuity was measured as the pure-tone average (PTA) threshold at pure-tones of 500, 1000 and, 2000 Hz in the better ear (M = 14.5, SD = 11.5), and participants were screened to include only those with age-appropriate hearing. However, pure-tone thresholds were also measured at 250, 4000, and 8000 Hz, and audiograms depicting group mean thresholds at all six frequencies in both ears are shown in Figure 1; the age groups (22–30, 30–55, 55–75, 75–92 years) whose thresholds are shown are the same as those depicted in Figures 3 and 4. Participants did not wear hearing aids during the experiment.
Fig. 1.

Audiograms (pure tone thresholds at 0.25, 0.50, 2.00, 4.00, and 8.00K Hz) for groups of participants aged 22–30, 30–55, 55–75, and 75–92 years. Upright and inverted triangles represent group mean thresholds for the right and left ears, respectively.
Fig. 3.
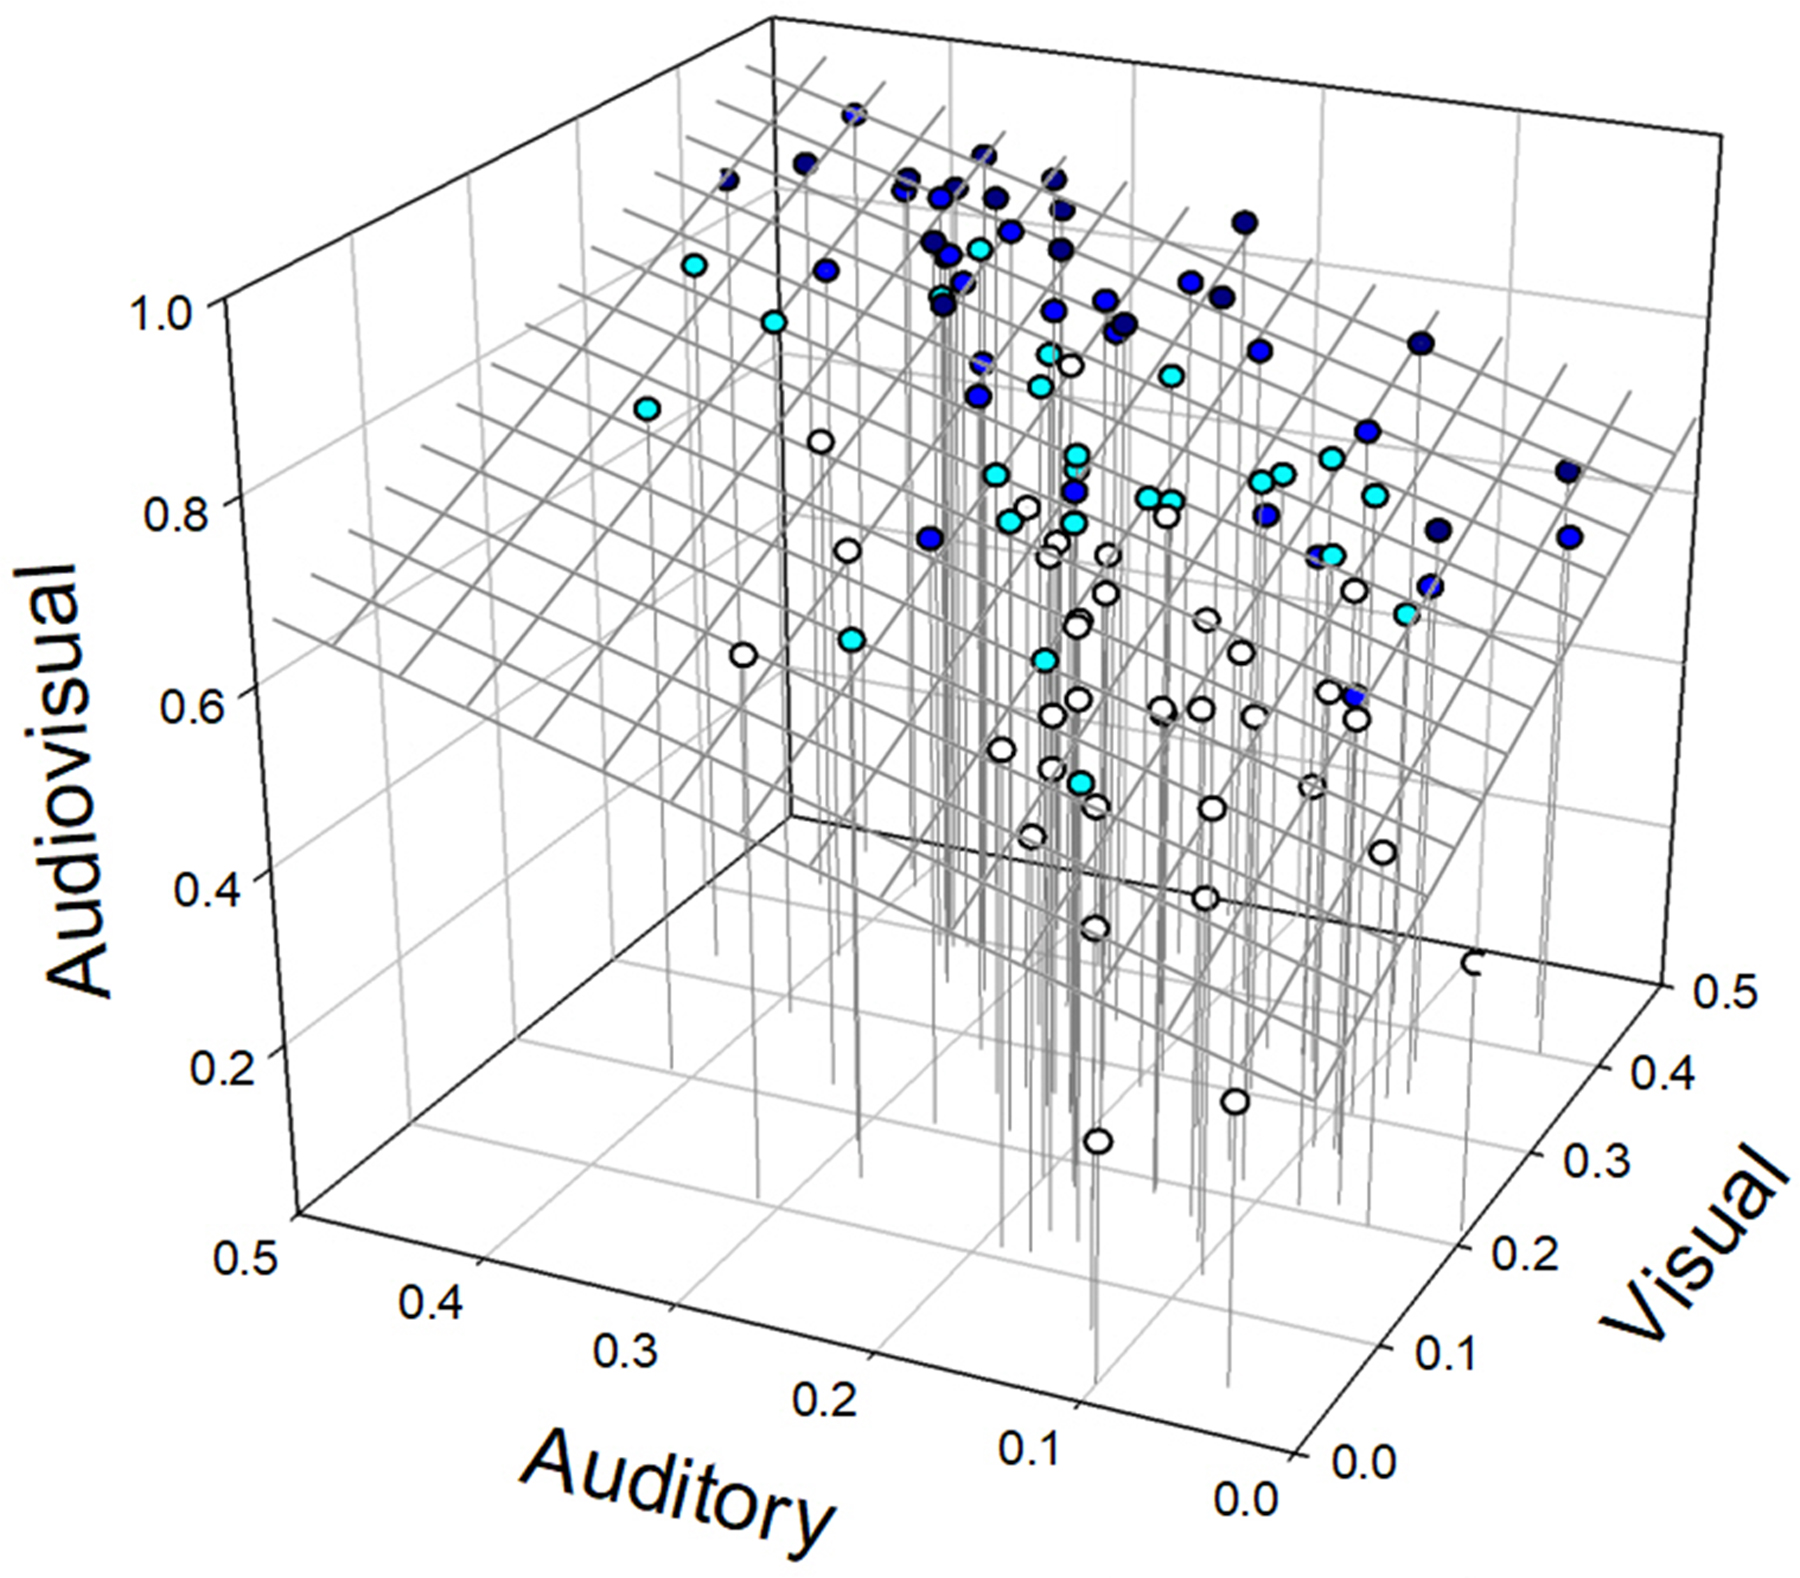
Results of multiple linear regression analysis. The figure depicts each participant’s accuracy in the audiovisual condition as a function of accuracy in the auditory and visual conditions; the color of each participant’s data point indicates their age group (see legend). The plane representing the predictions of the best-fitting reduced (i.e., without an age term) linear regression model, AV = b0 + b1*A + b2*V, is also shown, as well as drop lines from the data points to the surface AV=A=V=0.0 for comparison purposes.
Fig. 4.

Results of nonlinear regression analysis. The figure depicts each participant’s accuracy in the AV condition as a function of the probability of their getting words correct in that condition as estimated based on the participant’s accuracy in the A-only and V-only conditions (see text); the color of each participant’s data point indicates their age group (see legend). The curve represents the predictions of the reduced nonlinear (parabolic) regression model.
Stimuli
Our new Lex-List test was used to test auditory, visual, and audiovisual perception of individual words. It should be noted that unlike the closed-set BAS test used in Tye-Murray et al. (2016), the format of the Lex-List test is open-set. The stimuli are recordings of a trained actor, a white female in her early thirties who spoke General American dialect. In the V-only and AV conditions, participants saw her head and shoulders while she spoke a carrier phrase ending with the word to be recognized (e.g. “Say the word - cake”). In A-only conditions, participants heard the talker while viewing a blank screen. In all three conditions, participants had to repeat a word verbatim for it to be scored as correct.
The talker sat in front of a neutral background and repeated the phrases into the camera as they appeared on a teleprompter. The actor was instructed to leave a short pause and allow her mouth to return to a slightly open neutral position before each target word was spoken. Recordings were done with a Cannon Elura 85 digital video camera connected to a Dell Precision PC, and digital capture and editing was done in Adobe Premiere Elements. The audio portion of the stimuli was leveled to ensure that each word had approximately the same amplitude using Adobe Audition.
The Lex-List corpus consists of 970 words selected from the 40,481 words listed in the English Lexicon Project (Balota et al., 2007). Words were chosen to have a relatively high frequency-of-occurrence with Log-Frequencies between 7 (e.g. tally, weave) and 15 (e.g. this, get). Of the test items, 79 (target) words were specifically chosen to ensure that the Lex-List test included items that cover a wide range of possible intersection density sizes (i.e. the number of words that occur in both a target’s visual neighborhood and auditory neighborhood; Tye-Murray, Sommers, & Spehar, 2007). The complete Lex-List word list can be found at https://osf.io/bfnkr/?view_only=454601197e064504a267ff804a2694e1.
Procedure
After providing informed consent and completing demographic questionnaires, participants were positioned in a sound treated room in front of an ELO Touchsystems CRT monitor. Audio was presented through two loudspeakers positioned at ±45 degrees to the participants’ forward-looking position. All testing was conducted using custom software written in LabView to control the stimuli presentation and the audio levels (via Tucker-Davis Technologies RP2.1). All audio was routed to the loudspeakers through a calibrated Auricle audiometer. Sound levels were checked using a calibration signal before each test and monitored using the audiometer. The experimenter was positioned outside the booth and recorded all responses on a second touch screen using the customized software. Items were not presented to the participant until a response to the previous item was recorded. Breaks were provided any time the participant requested and between each test. Although most participants did not take a break, for those who did, break time was limited to 15 minutes or less so as to stay within the time allotted for each of three daily sessions. The Lex-List test was the first given during each session, followed by other speech perception and cognitive assessments. Further testing later in the session included closed-set audiovisual testing using the BAS test (e.g., Tye-Murray et al., 2016), and tests of working memory, vocabulary, and processing speed. One-third of the Lex-List items were presented in each of the three sessions. Of these items, only the 79 target words (selected to represent a range of intersection densities) were presented in all three modality conditions (A-only, V-only, AV), but no target word was presented twice on the same day of testing. Before each trial, participants saw either the word listen and an image of an ear if the trial was to be A-only, the word see and an image of an eye if the trial was to be V-only, or both words and both images if the trial was to be AV.
All participants received the same randomized word order. The presentation order of the three conditions was also randomly determined. Three orders were created with the constraint that each word was presented in each condition an equal number of times. The three orders were then counter-balanced so that equal numbers of participants saw conditions in each of the three orders. Modality condition and word type (target vs. filler) were interleaved (i.e., conditions were not blocked); targets appeared only once per session and occurred in all three modalities within subjects, whereas fillers occurred in one modality per participant and the modality of the fillers was counterbalanced across subjects. All speech testing was conducted in six-talker babble (three males and three females) presented at approximately 62 dB SPL. The level of the audio for the Lex-List items, when presented, was approximately 59 dB SPL (i.e. a −3.0 Signal-to-Noise Ratio or SNR) because pilot testing with young adults suggested that this SNR would avoid ceiling performance in the AV condition.
Analysis
In addition to multiple linear regression and correlational analyses, nonlinear regression analyses assessing our new parabolic model were conducted to assess the relative contributions of unimodal performance and age to the prediction of AV speech perception. The independent variable in our parabolic model analyses was the probability of being correct in AV by chance, calculated based on the following logic: When people try to recognize words that they can see as well as hear, they have two chances at identification, one based on the auditory speech signal and one based on the visual speech signal, in addition to whatever benefit they derive from processing the two simultaneously (Tye-Murray, Sommers, Spehar, Myerson, & Hale, 2010). If AV perception could be completely explained by the fact that the AV stimulus provides two opportunities to recognize a word, then the probability of identifying a word from the combination of the auditory and visual signals, PAVpred, would be simply 1.0 minus the probability that both signals would lead to errors. Given that the probabilities of an error in the A-only and V-only conditions are 1-PA correct and 1-PV correct, respectively, it follows that
Indeed, this formula may provide the best baseline against which to measure AV speech perception (Stevenson et al., 2019; Tye-Murray et al., 2010), and therefore for the purpose of assessing our parabolic model, individual baselines were calculated using the proportion of words incorrectly identified in A-only and V-only conditions as estimates of the probability of unimodal word identification errors.
Of course, there may be an additional benefit to having both unimodal speech signals presented simultaneously over and above having two opportunities to identify a word. Indeed, Tye-Murray et al. (2016) hypothesized that such benefits can occur because the AV speech signal represents a more robust representation of a word because the auditory and visual speech signals provide both complementary and reinforcing information. Because of this, and contrary to what would be predicted based simply on the two-opportunity assumption, the probability of recognizing a word from an AV stimulus may be greater than 0.0, even when the probability of identifying the word from either signal is 0.0.
We incorporated the hypothesized unique benefits of processing auditory and visual speech signals simultaneously into a model that incorporates the two-opportunity assumption and in which AV word perception approaches asymptotic accuracy (AV=1.0) in a nonlinear, negatively accelerated, fashion. A parsimonious model with this property is the parabolic function, , which begins at the origin, AV = 0.0 when PAVpred = 1.0, when and ends with AV = 1.0 when PAVpred = 1.0 because the probability of being correct based on the signal in at least modality equals 1.0. (Hypothetical functions with values of b1 ranging from 0.50 to 1.25 are depicted in Figure 2; when b1 = 0.0, AV = PAVpred.)
Fig. 2.

Parabolic functions of the form AV = (1+b 1)* PAVpred + b 1* PAVpred 2 with values of b1 ranging from 0.50 to 1.25. When b1 = 0.0, AV = PAVpred.
However, Tye-Murray et al.’s (2016) hypothesis that words can be correctly perceived when presented audiovisually even if they could not be identified unimodally implies a positive intercept, which can be easily added to the parabolic model but which requires rescaling to ensure that AV asymptotes at 1.0. The resulting model still has only two free parameters: an intercept parameter, b 0, that captures the ability to identify AV stimuli whose unimodal components could not identified, and a rate parameter, b 1, that captures both the linear and nonlinear components of the increase in AV performance as unimodal perception ability, and hence PAVpred, increases:
The above nonlinear, parabolic model represents a constrained quadratic function and provides an opportunity to test two fundamental hypotheses regarding AV speech perception. First, a positive intercept (i.e., b0>0) would support Tye-Murray et al.’s (2016) hypothesis that there is a benefit to the simultaneous processing of auditory and visual speech signals that makes it possible to identify a word presented audiovisually that could not be identified when either its auditory or its visual component was presented alone. Second, the hypothesis that both individual and age-related differences in AV performance can be accurately predicted solely from unimodal speech processing abilities (Tye-Murray et al., 2016) can be tested by comparing the (reduced) model above with a full model that adds age as a predictor of AV performance in much the same way that such a comparison can be made using multiple regression models with and without age as a predictor.
A Bayesian analytic approach.
Bayesian analysis is called for in the present study in order to assess the evidence for a number of the hypotheses under consideration. Wagenmakers and colleagues highlighted some of the advantages of a Bayesian approach over the more traditional approach based on NHSTs (Wagenmakers, Lee, Lodewyckx, & Iverson, 2008) and two of the advantages that they described are particularly relevant to the present study. The first of these is the “possibility of collecting evidence in favor of the null hypothesis.” That is, NHSTs focus on the evidence in favor of the alternative hypothesis and whether it is sufficient to reject the null. In contrast, Bayesian analysis quantifies the evidence for specific hypotheses, allowing one to determine whether the evidence actually supports the null, whether it supports the alternative, or whether the evidence is insufficient to determine which hypothesis provides a better account of the data. This distinction is particularly important with respect to age differences where one wants to know whether or not there is an age-related deficit, and a failure to reject the null fails to distinguish between evidence that there is no such deficit and evidence that is simply insufficient to answer the question (Brydges & Bielak, 2020; Lakens, McLatchie, Isager, Scheel, & Dienes, 2020).
A second advantage of Bayesian analysis relevant to the present study is its “extension to non-nested models” (Wagenmakers et al., 2008). That is, model selection compares the fits of alternative models to the data taking into account how many free parameters each model has but does not distinguish between models with different mathematical forms. Not only does this allow one to directly compare linear and nonlinear models (e.g., the ‘two-opportunity’ model presented above), but in each case one can compare full and reduced models (e.g., models that assume there is an age difference and models that do not make this assumption). Because of the hypotheses being tested here, comparing models of different forms and full and reduced models of each kind, we incorporated Bayesian analyses into our analytic plan. The results of these analyses are reported not in terms probabilities, but in terms of Bayes factors (BFs) indicating the relative odds that the data would occur under each of the models being compared (e.g., a Bayes factor of 10 indicates that the data are 10 times as likely to occur under a model representing one hypothesis as under a model reflecting a different hypothesis).
More specifically, we first used NHSTs to compare full and reduced versions of our multiple linear regression and parabolic models (i.e., models with and without age as a predictor in addition to A-only and V-only accuracy). We then used Bayesian analysis to quantify the evidence for the hypothesis that a model in which age does not directly affect word perception is more likely to be correct than one in which age does have a direct effect. The Bayesian analysis itself was based on a generalization of the approach proposed by Wagenmakers (2007) and involved two steps: quantifying the evidence for each model using the Bayes Information Criterion (BIC), as estimated from the proportion of the variance in AV word perception accounted for by the model, and then comparing the two models by estimating the Bayes Factor based on the difference in their BICs, (see Jarosz & Wiley, 2014, for a helpful guide). Importantly for present purposes, this approach can be used to actually quantify the evidence for a model that instantiates a null hypothesis such as Tye-Murray’s (2016) hypothesis that age has no direct effect on AV word perception, rather than just determining whether or not the evidence for the alternative is sufficient to reject the null.
Finally, after finding that although age is strongly correlated with AV word perception, it appears to have only an indirect effect, we used NHSTs and Bayesian analysis to localize the source of that indirect effect. Specifically, we examined whether that indirect effect is the result of age-related differences in hearing and visual acuity, or whether there are also age-related differences in auditory and visual word perception, over and above the purely sensory differences.
Results
Table 1 presents the intercorrelations among age and accuracy measures for the set of 79 target words that were repeated in all three conditions (A-only, V-only, and AV) and the set of filler words that were not repeated but instead presented in only one condition and whose original function was to obscure the fact that some words were repeated. Scores on all word perception measures were negatively correlated with age and positively correlated with each; all of the correlations were significant (all ps <.001). Notably, the correlations among the corresponding word perception measures (e.g., filler and target words in the A-only condition) were all at least .89, attesting to their high reliability, and they remained strong even after controlling for Age (all partial-rs >.60). As may be seen, the patterns of correlations of AV performance with unimodal performance were highly similar regardless of whether the correlations involved words form the same or different sets (i.e., fillers with fillers, targets with targets, or fillers with targets), providing further evidence of the reliability with which the three constructs (A-only, V-only, and AV word perception) were measured. For most subsequent analyses, therefore, targets and fillers were combined using weighted averages because of the much larger number of filler words.
Linear regression NHSTs
Traditional multiple linear regression analyses and NHSTs were conducted to determine if Age was a significant predictor of AV speech perception after controlling statistically for age-related differences in A-only and V-only performance (Table 3). Together, all three potential predictors accounted for 87.9% of the variance in AV performance, but while the contributions of the two unimodal word perception measures were significant (both ps <.001), the contribution of Age was not (p=.749), consistent with the results of multiple regression analyses of these participants’ performance in A-only, V-only, and AV conditions of the BAS reported by Tye-Murray et al. (2016). Moreover, when the data were reanalyzed using only the two unimodal predictors, the percentage of variance accounted for by the resulting reduced (three-parameter) regression model decreased by less than 0.1%. The fit of the reduced model may be seen in Figure 3. (Note that the groups depicted in this figure and in Figure 4 were chosen solely to facilitate graphical analysis, and the age range, the range of accuracy scores, and the number of participants all tend to increase with the mean age of the group.)
Table 3.
Results of Bayesian analyses of linear and nonlinear AV word perception models.
| Model | R2 | params | BIC | BF Reduced vs. Full | BF Parabolic vs. Linear |
|---|---|---|---|---|---|
| full linear | .879 | 4 | −211.8 | ||
| reduced linear | .879 | 3 | −216.4 | 9.979 | |
| >150 | |||||
| full parabolic | .928 | 3 | −269.7 | ||
| reduced parabolic | .928 | 2 | −274.1 | 9.677 |
Note: Params refers to the number of parameters in the model, Full and Reduced refer to models with and without Age as a predictor, and Linear refers to the Multiple Linear Regression model; BIC and BF refer, respectively, to the Bayes Information Criterion for a specific model and the Bayes factor for a comparison of corresponding full and reduced models. The BF for the Parabolic vs. Linear models compares the evidence for the reduced forms of these models.
Nonlinear regression NHSTs
As may be seen in Figure 4, our new parabolic model also accurately predicted AV spoken word perception from unimodal performance, accounting for even more (92.8%) of the variance in AV performance (Table 2) than the linear regression model. Notably, the intercept (b 0) parameters of the full and reduced parabolic models were significant, as was also the case for the full and reduced multiple linear regression models (Table 2). Moreover, regardless of the type of model, linear or nonlinear, the intercepts were not just different from zero, they were all positive, as predicted by the hypothesis that visual and auditory speech stimuli contribute complementary and reinforcing speech information that can make it possible to identify words presented audiovisually even when they could not be identified in either modality presented alone.
Table 2.
Results of multiple regression analyses of linear and nonlinear AV word perception models.
| Regression Model (R2) | Parameter (SE) | t | p |
|---|---|---|---|
|
Full linear model: AV = b 0 + b 1*A + b 2*V + b 3*Age (R2 = .8794) | |||
| b 0 = 0.365 (0.044) | 8.239 | <.001 | |
| b 1 = 0.649 (0.074) | 8.742 | <.001 | |
| b 2 = 0.588 (0.048) | 12.175 | <.001 | |
| b 3 = 0.000 (0.000) | 0.320 | .749 | |
|
Reduced linear model: AV = b 0 + b 1*A + b 2*V (R2 = .8793) | |||
| b 0 = 0.351 (0.014) | 25.58 | <.001 | |
| b 1 = 0.667 (0.074) | 14.16 | <.001 | |
| b 2 = 0.590 (0.048) | 12.33 | <.001 | |
|
Full parabolic model: (R2 = .9283) | |||
| b 0 = 0.162 (0.035) | 4.69 | <.001 | |
| b 1 = 0.803 (0.049) | 16.49 | <.001 | |
| b 2 = 0.000 (0.000) | 0.37 | .709 | |
|
Reduced parabolic model: (R2 = .9282) | |||
| b 0 = 0.151 (0.019) | 7.75 | <.001 | |
| b 1 = 0.792 (0.039) | 20.22 | <.001 | |
Note: A and V represent the proportions correct in the A-only and V-only conditions; PAVpred represents the estimated likelihood that words will be correctly perceived in the AV condition simply because the two unimodal speech signals offer two chances to identify each word.
As was the case with the linear regression model, when Age was added to the parabolic model equation as a predictor of AV performance, its contribution was not significant (p = .710), and the difference in the percentage of variance accounted for with and without Age as a predictor was again less than 0.1%. Of course, these NHSTs show only that, regardless of the hypothesized form of the relation between audiovisual and unimodal (i.e., auditory and visual) word perception, there is insufficient evidence to reject the null hypothesis (i.e., the accuracy of prediction is not improved by including participants’ Age as an additional predictor to unimodal perception). Simply put, we have not proved the null hypothesis is correct, just failed to reject it.
Bayesian analyses
Because Bayesian analysis does not suffer from the same constraints as NHSTs and may be used to assess evidence for the null hypothesis, we used such analyses to address two fundamental questions, one about how best to model individual differences in AV speech perception and the other about whether an individual’s age is a useful predictor of their AV speech perception. The first question specifically concerns the best model of the relation between the accuracy of individuals’ AV speech perception and the accuracy that would be expected based on their unimodal speech perception. The second question concerns whether the nonsignificant contribution of Age to predicting AV speech perception reflects the fact that the evidence is simply insufficient to decide whether Age has a direct effect, or whether the evidence actually supports a model in which Age has only indirect effects, presumably mediated by the age-related changes in unimodal speech perception.
The answer as to whether our parabolic model provides a better account of AV speech perception than a linear regression model is clear. Not only does the parabolic model account for more variance, but quantifying that comparison using Bayes factors revealed that the data are more than 100 times as likely to reflect processes like those instantiated in the parabolic model than those instantiated in a multiple linear regression model (Bayes Factor > 150; Table 3).
As to whether the nonsignificant direct effect of Age on AV speech perception simply reflects insufficient evidence of a direct effect, or whether it indicates that, once age-related differences in unimodal speech perception are statistically controlled, the evidence actually supports the null hypothesis, Bayesian analyses reveal that the latter is correct. Our Bayesian assessments of Age as a predictor of AV word perception are based on comparison of the same full and reduced models, with and without Age as a predictor, respectively, that were the bases for NHSTs. Following Jarosz and Wiley (2014), we calculated the BICs for the full and reduced linear and parabolic models and used the difference between the two BICs to estimate the Bayes Factor for each pair of models (Table 3). Results revealed substantial positive evidence that regardless of the form of the models being compared, adding Age as a predictor did not improve the accuracy of a model’s predictions (both Bayes Factors > 9.6). Thus, the effects of Age on AV speech perception, although substantial (as may be seen in Table 1), are entirely indirect and reflect age-related declines in unimodal speech perception.
Discussion
What does one need to know to predict an individual’s AV speech perception in noisy situations? More specifically, is knowing their unimodal speech perception abilities sufficient, as Tye-Murray et al. (2016) proposed, or does one also need to know their age, as one might expect from the numerous studies that assumed there are age-related differences in multi-sensory integration (for a recent review, see de Dieuleveult et al., 2017)? Converging evidence from our analyses of the present data based on linear and nonlinear regression models argues strongly that knowing our participants’ unimodal speech perception abilities of the Lex-List word recognition task was sufficient, and that knowing their age was unnecessary, at least for current purposes.
Both linear and nonlinear models of the current data predicted individual AV performance with extremely high accuracy over a broad age range (22–93 years). A multiple linear regression model accounted for over 85% of the variance, a parabolic model accounted for more than 90%, and in both cases, adding Age as a predictor accounted for only 0.01% more. Moreover, Bayesian analyses provided substantial evidence for the null hypothesis that there is no age difference in the ability to integrate auditory and visual speech information. These findings are consistent with those of some previous studies that failed to find age-related deficits, and in particular with research on group differences in AV perception of nonspeech stimuli, where some studies have even found enhanced AV integration in older adults (e.g., Hernandez et al., 2019; Stevenson et al. 2018). However, while results obtained with nonspeech stimuli may have important theoretical implications, highlighting the mechanisms underlying AV integration, their clinical significance remains to be established.
It should be noted that although age-related differences in unimodal speech perception accounted for age-related differences in AV speech perception, leaving no role for putative differences in AV integration in either the present study or that of Tye-Murray et al. (2016), both studies involved the same participants. Although the experimental procedures and the analytic approaches used in the two studies both differed substantially, strengthening the evidentiary basis for the present conclusions, future studies that test the replicability of this finding in different samples are clearly called for, as is determining whether the fact that the Lex-List test was always followed by the BAS procedure in daily sessions played a role in the current findings. In the current study, presenting auditory stimuli at the same level to all participants and not constraining responses to a closed set of alternatives, not to mention allowing participants to see as well as hear the talker, were all intended to increase the ecological validity of our measures over those used in Tye-Murray et al., but they clearly represent only initial steps, albeit critical ones, in bridging the gap between current clinical practice and everyday communication.
Probability and Prediction: Previous Studies
A few previous studies (Blamey et al., 1989; Grant et al., 1998; Stevenson et al., 2015, Tye-Murray et al., 2010) have used the laws of probability in ways somewhat similar to the way they are used here. For example, Blamey et al. used the formula 1-PAV = (1-PA)(1-P V) to predict the proportion of speech information transmitted in an AV condition from the proportions of information transmitted in A-only and V-only conditions. This formula is algebraically equivalent to that used here for what we termed the two-opportunity model, as may be seen by multiplying by subtracting 1 from both sides of the Blamey formula and then multiplying them both by −1.
The goals of these previous studies were quite different from the goals of the present one. Although Blamey et al. (1989) included words as stimuli, the focus of their study with four younger adult participants was on recognition of vowels and consonants, for which information transmission analyses were conducted, as well as on the possibility of using tactile information to supplement auditory and visual information. Grant et al. compared Blamey et al.’s formula to models by Braida (1991) and Massaro (1987), but although both consonant and sentence stimuli were used and participants ranged in age from 41 to 88, not only was the formula only applied to consonant recognition but age differences were not examined.
Tye-Murray et al. (2010) were the first to use the same probability model to study age differences in AV speech perception. They defined integration enhancement as the difference between AV observed and AV predicted using the same probability multiplication rule as in Blamey et al. (1989) Grant et al. (1998), and found that although there were no age differences in group mean enhancement scores with high contrast visual stimuli regardless of the level of background noise, age differences in enhancement emerged when the visual speech stimulus were low contrast. Stevenson et al. (2015) used a similar measurement approach to compare younger and older groups, and they found that the older group showed less enhancement than the younger group only when the SNR was −18db but not at three better SNRs where the older group tended to show more enhancement than the younger one.
Notably, the present study is the first to use the basic probability (two-opportunity) prediction formula not just as a baseline against which to measure observed AV performance but as a basis for modeling individual and age-related differences in AV performance. This approach reveals the nonlinearity of the relation between probabilistic predictions and actual performance that poses problems for studies of both individual and group differences and of the principle of inverse effectiveness (PoIE) in particular. The maximum benefit from combining auditory and visual speech information occurs for moderate levels of the probability predictions (Ma et al., 2009; Ross et al., 2007) so that whether two groups or individuals differ or which group or individual benefits most depends on the level of AV performance predicted by the probability formula based on unimodal performances, leading to results like those of Stevenson et al. (2015) and Tye-Murray et al. (2016). Clinically, of course, the goal is to treat individuals, not groups. Accordingly, the present effort focused on predicting individuals’ AV speech perception from their unimodal abilities, promoting the probability prediction based on unimodal abilities from baseline to fundamental independent variable. The question here is not whether people integrate auditory and visual speech information, but whether integration is a unique ability, distinct from the abilities underlying the processing of unimodal speech information. Thus, the test here is the extent to which those unimodal abilities, both of which decline with age, can account for individual differences in AV speech perception, and whether the unexplained variance can be accounted for by the differences in participants’ ages, which could, in principle serve as proxy for age-related differences in integration ability.
Theoretical Implications
The present findings are consistent with the results of Tye-Murray et al.’s (2016) study of the effects of blur on visual and audiovisual speech perception across the adult portion of the lifespan. Tye-Murray and colleagues, who studied the same 109 participants using different stimuli and procedures, unexpectedly discovered that one could accurately predict individuals’ perception of AV speech signals based on their unimodal speech perception abilities without knowing their age and that, in fact, when age was included as a potential predictor, it did not account for any unique variance. Because of the significance of this finding, it is important to know not just how replicable it is, but also how robust it is (i.e., how generalizable the results are). Based on the present results and the multiple differences between this study and that of Tye-Murray et al. in terms of both procedure and analytic approach, we hypothesize that the finding is highly robust, and indeed, other researchers, often using auditory and visual nonspeech stimuli have also reported, equivalent or even enhanced integration of unimodal information in older adults (e.g., Hernandez et al., 2019; Parker & Robinson, 2018).
The present study also supplemented traditional statistical analyses with Bayesian analyses that specifically assess the evidence for the (null) hypothesis that, although aging may have indirect effects on AV speech perception, it does not affect the ability to integrate auditory and visual speech information (Tye-Murray et al., 2016). Regardless of whether the models being compared were linear or nonlinear, Bayesian analysis revealed that the evidence always clearly supported the null hypothesis. Thus, although there were clear age-related differences in AV speech perception, and all participants showed ‘integration enhancement’ in the sense that they did better than predicted by the two-opportunity probability formula (Stevenson et al., 2015; Tye-Murray et al., 2010), there was no evidence of a systematic age-related decline in a putative integration ability underlying these differences.
Finally, the intercept of the parabolic model provided a test of the hypothesis that people can perceive words presented audiovisually at levels that would not permit accurate perception when presented in one modality alone (Tye-Murray et al., 2016). As predicted, the intercept (i.e., the predicted level of AV performance when the levels of unimodal performance are zero) was significant, a finding that Tye-Murray and colleagues would attribute to the complementary and reinforcing nature of the speech information provided by the two modalities separately. Notably, the 2-parameter parabolic model also accounted for more of the variance in AV speech perception than a 3-parameter linear model, and a comparison of these models using Bayesian analysis decisively supported the parabolic model.
Although the present results argue against the idea that the integration of auditory and visual speech information is a unique, age-sensitive ability, there is nevertheless something special about AV speech perception. This may be seen in Figure 4, which plots observed AV accuracy as a function of the accuracy predicted based on the fact that with AV speech stimuli, individuals have two chances to correctly identify each word, one based on auditory speech information and one based on visual speech information. As Figure 4 shows, participants always did better than predicted based on their having two chances. The complementary and reinforcing nature of the information in the two modalities is certainly a large part of the reason why, but Tye-Murray et al. also suggested two other reasons: the overlap of visual and auditory lexical neighborhoods, and the simultaneous processing of auditory and visual signals along with the temporal synchronization of key events (e.g., amplitude fluctuations and mouth openings) effectively timestamps each channel, thereby allowing for construction of a continuous, robust representation of utterances despite the asynchronous occurrence of noise in each channel.
The almost unprecedented accuracy of the parabolic model’s predictions (R2 > .90) considerably strengthens the argument that differences in unimodal speech perception abilities provide a complete account of differences in AV performance because the model leaves little in the way of unexplained variance. Nevertheless, further research on the robustness of the parabolic model clearly is needed. Moreover, the model is purely descriptive at this point rather than being mathematically derived from theoretical assumptions, having been formulated so as to efficiently incorporate known constraints (e.g., accuracy can neither exceed 100% or be negative, both of which are possible with linear models) because our immediate goal was to facilitate measurement and hypothesis testing. And indeed, we believe the model was a success in those regards. As currently formulated, however, the inherent nonlinearity of our parabolic model invites a more principled derivation (i.e., one based on underlying theoretical mechanisms) that could shed light on the specific processes involved in combining speech information from different modalities.
One approach might be to build on the Bayesian framework proposed by Ma et al. (2009) and their optimal integration model. Although they modeled integration as a function of changes in SNR resulting from experimental manipulation of background noise levels, testing a participant at an easier and a harder SNR may be analogous to testing different participants who have better and poorer hearing. Indeed, their model predicted that while the benefit of visual speech information initially increases as sound quality decreases, further decreases in sound quality result in decreased benefit. Thus, maximum benefit occurred with speech stimuli of moderate quality, as originally reported by Ross et al. (2007), a result analogous to the present finding that participants with moderate levels of unimodal performance received the maximum benefit from simultaneous presentation of A-only and V-only (see Fig. 3). Although numerous previous studies have failed to observe this pattern, reviewing this literature Ross et al. (2007) pointed out that such failures often occurred when the poorest unimodal speech stimuli in an experiment were still of moderate quality.
As noted above, the present finding that the ability to integrate auditory and visual speech stimuli is not affected by aging is similar to findings with respect to integration of nonspeech stimuli (e.g., Hernandez et al., 2019; Parker & Robinson, 2018). This is important in the present context because Bayesian approaches have also been successfully used to model integration of auditory and visual nonspeech signals (for a review, see Allain & Burr, 2019), and it is possible that such models may contribute to theoretical integration of the very diverse literature on multimodal perception while exposing the potential for confounds when standard procedures involving decisions differing in dimensionality are used (Ma et el., 2009). Despite the scientific importance of such theoretical integration, it should be recalled that the present effort is more narrowly focused on individual differences in speech perception and concerns aging as a principal source of individual differences, with the aim here being to provide a potentially useful clinical tool for assessing individual patients. While it is possible that Bayesian models of the brain’s analysis of cue combinations may eventually contribute to clinical assessment of individual patients, for the present we would highlight the potential utility of the parabolic model for decision making by both clinicians and their patients in the near term.
Clinical Implications
Declines in speech information processing significantly affect people’s lives and can lead to social isolation (e.g., Ciorba et al., 2012), but the underlying problems can often be ameliorated by currently available devices and procedures, although these can be expensive. The straightforward mathematical approach used here provides a way to estimate these benefits in individual cases with a level of accuracy rarely seen with behavioral measures, which could be a boon to those faced with these difficult decisions. That is, given that an individual’s AV speech perception can be predicted from their A-only and V-only perception using the parabolic model, then by substituting new values for their unimodal abilities, one can estimate the effects that improvements in either unimodal ability, such as the effects of hearing aids on A-only word recognition, would have on AV speech perception. This information would be valuable to the audiologist in predicting and understanding the benefits of treatment (i.e., how much improvement will there be in a patient’s conversational experience?) and, if this information is shared with the patient, it would be valuable to them in terms of motivating them to use the new hearing aids.
Patients do not come to the audiologist to have their hearing loss corrected. They come to have their speech perception improved. Audiometry is a means to that end. However, speech perception in everyday life usually results from combining visual speech information with auditory information, a process captured by the parabolic model. Thus, people with the same level of auditory speech perception ability may differ in speech perception in everyday life depending on their visual speech perception ability, and a complete understanding of what a patient may describe as their “hearing problem” likely requires assessing their speech perception under conditions more like those which they experience every day, where for the most part they encounter audiovisual speech. This is especially true because visual speech perception varies widely even among individuals who, like the participants in the current study, have normal or correct-to-normal vision.
Rigorous evaluation of this approach will be needed, of course, as well as development of a suite of instruments (A-only, V-only, AV) for brief clinical assessment. Notably, the general approach called for here is analogous to the approach characterized as personalized or precision medicine, in which a patient’s personal characteristics (e.g., genes, behavior, and environment) are taken into account in determining an optimal therapeutic intervention (https://www.cdc.gov/features/precision-medicine/index.html). Within the field of personalized medicine, the use of statistical models like those we propose are often termed computerized clinical decision support systems, perhaps to highlight the fact that such models are intended to supplement, rather than replace, human decision making. Although the emphasis to date has been on supporting physicians’ decision making (Garg et al., 2005), we are not the first to notice that the output of these statistical models may be useful for patients’ decision making as well (Bilimoria et al., 2013). If the approach suggested here, which following current usage might be termed precision audiology, improves older adults’ communication or decreases the likelihood of disappointment and financial loss, such outcomes would make a substantial contribution to patients’ quality of life (Ciorba et al., 2012).
Conclusions
Taken together, the present findings strongly support the theoretical framework proposed by Tye-Murray et al. (2016) according to which the auditory and visual channels provide both complementary and reinforcing information, and individual and age differences in AV speech perception are the results of differences in the efficiency of unimodal speech perception processes, not the result of differences in the efficiency with which individuals can integrate information from the two signals.
While this conclusion represents a fundamental insight into how older and younger adults process speech, it also represents a clear challenge for future research. Equivalent physical events do not provide older and younger adults with equivalent unimodal perceptual information, putting older adults at a disadvantage. The issue is now clearly why, and what can be done about it, and one major contribution of the present findings is that they tell researchers and practitioners where not to look for the answers to these questions. Older adults may have deficits in the processes underlying speech perception, but audiovisual integration is not one of them. Finally, we would suggest that including AV and V-only assessment as part of an audiological examination would provide a powerful means for an audiological practice to distinguish itself from the competition, including sites that sell over-the-counter hearing aids.
Acknowledgments
This research was supported by grants AG018029 and DC016594 from the National Institutes of Health. We thank Elizabeth Mauze′ and Shannon Sides for their help with participant recruitment and data collection.
References
- Akeroyd MA (2008). Are individual differences in speech reception related to individual differences in cognitive ability? A survey of twenty experimental studies with normal and hearing-impaired adults. International Journal of Audiology, 47, S53–S71. [DOI] [PubMed] [Google Scholar]
- Alais D, & Burr D (2019). Cue combination within a Bayesian framework. In Multisensory Processes: The Auditory Perspective (pp. 9–31). Editors: Lee Adrian K. C., Wallace Mark T., Coffin Allison B., Popper Arthur N., & Fay Richard R. Springer, Cham, Switzerland. [Google Scholar]
- Avivi-Reich M, Puka K, & Schneider BA (2018) Do age and linguistic background alter the audiovisual advantage when listening to speech in the presence of energetic and informational masking? Attention, Perception, & Psychophysics, 80, 242–261. [DOI] [PubMed] [Google Scholar]
- Balota DA, Yap MJ, Hutchison KA, Cortese MJ, Kessler B, Loftis B, … & Treiman R. (2007). The English lexicon project. Behavior Research Methods, 39, 445–459. [DOI] [PubMed] [Google Scholar]
- Bilimoria KY, Liu Y, Paruch JL, Zhou L, Kmiecik TE, Ko CY, & Cohen ME (2013). Development and evaluation of the universal ACS NSQIP surgical risk calculator: a decision aid and informed consent tool for patients and surgeons. Journal of the American College of Surgeons, 217, 833–842. [DOI] [PMC free article] [PubMed] [Google Scholar]
- Blamey PJ, Cowan RS, Alcantara JI, Whitford LA, & Clark GM (1989). Speech perception using combinations of auditory, visual, and tactile information. Journal of Rehabilitation Research and Development, 26, 15–24. [PubMed] [Google Scholar]
- Braida LD (1991). Crossmodal integration in the identification of consonant segments. The Quarterly Journal of Experimental Psychology, 43, 647–677. [DOI] [PubMed] [Google Scholar]
- Brydges CR, & Bielak AAM (2020). A Bayesian analysis of evidence in support of the null hypothesis in gerontological psychology (or lack thereof). The Journals of Gerontology: Series B, 75, 58–66. [DOI] [PubMed] [Google Scholar]
- Campbell R (2007). The processing of audio-visual speech: empirical and neural bases. Philosophical Transactions of the Royal Society B: Biological Sciences, 363, 1001–1010. [DOI] [PMC free article] [PubMed] [Google Scholar]
- Ciorba A, Bianchini C, Pelucchi S, & Pastore A (2012). The impact of hearing loss on the quality of life of elderly adults. Clinical Interventions in Aging, 7, 159–163. [DOI] [PMC free article] [PubMed] [Google Scholar]
- Dalton DS, Cruickshanks KJ, Klein BE, Klein R, Wiley TL, & Nondahl DM (2003). The impact of hearing loss on quality of life in older adults. The Gerontologist, 43, 661–668. [DOI] [PubMed] [Google Scholar]
- de Dieuleveult AL, Siemonsma PC, van Erp JB, & Brouwer AM (2017). Effects of aging in multisensory integration: a systematic review. Frontiers in Aging Neuroscience, 9, 80. [DOI] [PMC free article] [PubMed] [Google Scholar]
- Folstein MF, Folstein SE, & McHugh PR (1975). “Mini-mental state”: a practical method for grading the cognitive state of patients for the clinician. Journal of Psychiatric Research, 12, 189–198. [DOI] [PubMed] [Google Scholar]
- Garg AX, Adhikari NK, McDonald H, Rosas-Arellano MP, Devereaux PJ, Beyene J, … & Haynes RB. (2005). Effects of computerized clinical decision support systems on practitioner performance and patient outcomes: a systematic review. Journal of the American Medical Association, 293, 1223–1238. [DOI] [PubMed] [Google Scholar]
- Grant KW, Walden BE, & Seitz PF (1998). Auditory-visual speech recognition by hearing-impaired subjects: Consonant recognition, sentence recognition, and auditory-visual integration. The Journal of the Acoustical Society of America, 103, 2677–2690. [DOI] [PubMed] [Google Scholar]
- Holmes NP (2009). The principle of inverse effectiveness in multisensory integration: some statistical considerations. Brain topography, 21, 168–176. [DOI] [PubMed] [Google Scholar]
- Jarosz AF, & Wiley J (2014). What are the odds? A practical guide to computing and reporting Bayes factors. The Journal of Problem Solving, 7, Article 2. Retrieved from http://docs.lib.purdue.edu/jps/vol7/iss1/2 [Google Scholar]
- Lakens D, McLatchie N, Isager PM, Scheel AM, & Dienes Z (2020). Improving inferences about null effects with Bayes factors and equivalence tests. The Journals of Gerontology: Series B, 75, 45–57. [DOI] [PubMed] [Google Scholar]
- Lever J, Krzywinski M, & Altman N (2016). Points of significance: model selection and overfitting. Nature Methods, 13 (9), 703. [Google Scholar]
- Lima SD, Hale S, & Myerson J (1991). How general is general slowing? Evidence from the lexical domain. Psychology and Aging, 6, 416–425. [DOI] [PubMed] [Google Scholar]
- Ma WJ, Zhou X, Ross LA, Foxe JJ, & Parra LC (2009). Lip-reading aids word recognition most in moderate noise: A Bayesian explanation using high-dimensional feature space. PloS one, 4, e4638. [DOI] [PMC free article] [PubMed] [Google Scholar]
- Massaro DW (1996). Bimodal speech perception: a progress report. In Stork DG, and Hennecke ME, (Eds), Speechreading by humans and machines (pp. 79–101). Berlin: Springer-Verlag. [Google Scholar]
- Mendel LL, & Owen SR (2011). A study of recorded versus live voice word recognition. International Journal of Audiology, 50, 688–693. [DOI] [PubMed] [Google Scholar]
- Meredith MA, & Stein BE (1986). Visual, auditory, and somatosensory convergence on cells in superior colliculus results in multisensory integration. Journal of neurophysiology, 56(3), 640–662. [DOI] [PubMed] [Google Scholar]
- Morrell CH, Gordon-Salant S, Pearson JD, Brant LJ, & Fozard JL (1996). Age-and gender-specific reference ranges for hearing level and longitudinal changes in hearing level. The Journal of the Acoustical Society of America, 100, 1949–1967. [DOI] [PubMed] [Google Scholar]
- Myerson J, Spehar B, Tye-Murray N, Van Engen K, Hale S, & Sommers MS (2016). Cross-modal informational masking of lipreading by babble. Attention, Perception, & Psychophysics, 78, 346–354. [DOI] [PMC free article] [PubMed] [Google Scholar]
- Parker JL, & Robinson CW (2018). Changes in multisensory integration across the life span. Psychology and Aging, 33, 545–558. [DOI] [PubMed] [Google Scholar]
- Peelle JE, & Sommers MS (2015). Prediction and constraint in audiovisual speech perception. Cortex, 68, 169–181. [DOI] [PMC free article] [PubMed] [Google Scholar]
- Ross LA, Saint-Amour D, Leavitt VM, Javitt DC, & Foxe JJ (2007). Do you see what I am saying? Exploring visual enhancement of speech comprehension in noisy environments. Cerebral Cortex, 17, 1147–1153. [DOI] [PubMed] [Google Scholar]
- Silverman SR, & Hirsh IJ (1955). Problems Related to the Use of Speech in Clinical Audiometry. Annals of Otology, Rhinology & Laryngology, 64, 1234–1244. [DOI] [PubMed] [Google Scholar]
- Sommers MS, Kirk KI, & Pisoni DB (1997). Some considerations in evaluating spoken word recognition by normal-hearing, noise-masked normal-hearing, and cochlear implant listeners. I: The effects of response format. Ear and Hearing, 18, 89. [DOI] [PMC free article] [PubMed] [Google Scholar]
- Sommers MS, Spehar B, Tye-Murray N, Myerson J, & Hale S (2020). Age differences in the effects of speaking rate on auditory, visual, and auditory-visual speech perception. Ear and Hearing, 41, 549–560. [DOI] [PubMed] [Google Scholar]
- Sommers MS, Tye-Murray N, & Spehar B (2005). Auditory-visual speech perception and auditory-visual enhancement in normal-hearing younger and older adults. Ear and Hearing, 26, 263–275. [DOI] [PubMed] [Google Scholar]
- Stevenson RA, Nelms CE, Baum SH, Zurkovsky L, Barense MD, Newhouse PA, & Wallace MT (2015). Deficits in audiovisual speech perception in normal aging emerge at the level of whole-word recognition. Neurobiology of Aging, 36, 283–291. [DOI] [PMC free article] [PubMed] [Google Scholar]
- Tillman TW, & Carhart R (1966). An expanded test for speech discrimination utilizing CNC monosyllabic words: Northwestern University Auditory Test No. 6. Northwestern Univ Evanston Il Auditory Research Lab. [DOI] [PubMed] [Google Scholar]
- Tye-Murray N, Sommers MS, & Spehar B (2007). Auditory and visual lexical neighborhoods in audiovisual speech perception. Trends in Amplification, 11, 233–241. [DOI] [PMC free article] [PubMed] [Google Scholar]
- Tye-Murray N, Sommers M, Spehar B, Myerson J, & Hale S (2010). Aging, audiovisual integration, and the principle of inverse effectiveness. Ear and hearing, 31, 636–644. [DOI] [PMC free article] [PubMed] [Google Scholar]
- Tye-Murray N, Spehar B, Myerson J, Hale S, & Sommers M (2016). Lipreading and audiovisual speech recognition across the adult lifespan: Implications for audiovisual integration. Psychology and Aging, 31, 380–389. [DOI] [PMC free article] [PubMed] [Google Scholar]
- Wagenmakers EJ (2007). A practical solution to the pervasive problems of p values. Psychonomic Bulletin and Review, 14, 779–804. [DOI] [PubMed] [Google Scholar]
- Wagenmakers E-J, Lee M, Lodewyckx T, & Iverson G (2008). Bayesian versus Frequentist inference (pp. 181–208). In Hoijtink H, Klugkist I, & Boelen P (Eds.), Bayesian Evaluation of Informative Hypotheses. New York: Springer [Google Scholar]