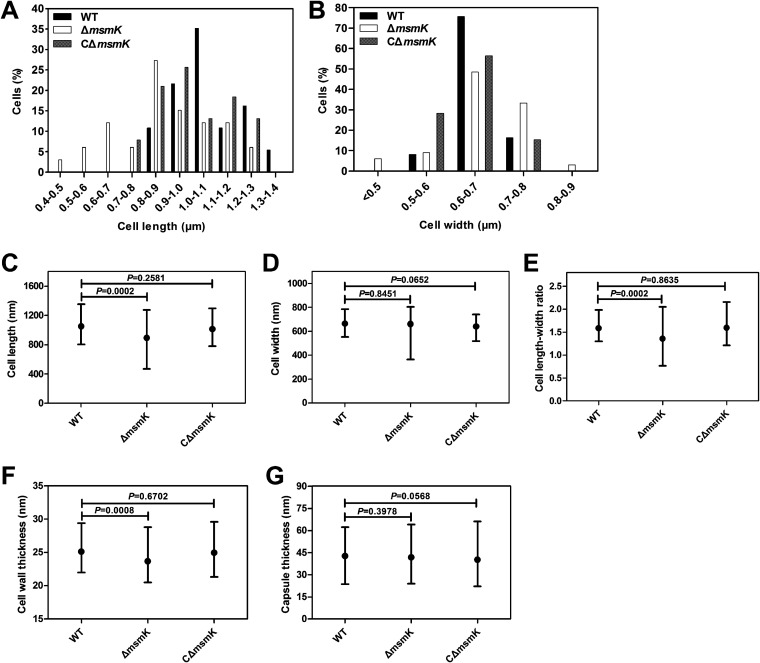
FIG 7.
Comparative analysis of cell sizes. (A and B) Histogram statistics of cell length (A) and width (B) of the WT (black), ΔmsmK (white), and CΔmsmK (gray) cells. (C to G) Cell size parameters of WT, ΔmsmK, and CΔmsmK cells. Cell length (C), cell width (D), cell length-to-width ratio (E), cell wall thickness (F), and capsule thickness (G) are shown as means with ranges. Statistical analyses were performed via unpaired Student’s t tests in GraphPad Prism 6. Differences were considered significant on the basis of the calculated P values.

