

Abstract
Background & Aims:
SIRT5 plays pleiotropic roles via post-translational modifications, serving as a tumor suppressor, or an oncogene, in different tumors. However, the role SIRT5 plays in the initiation and progression of pancreatic ductal adenocarcinoma (PDAC) remains unknown.
Methods:
Published datasets and tissue arrays with SIRT5 staining were used to investigate the clinical relevance of SIRT5 in PDAC. Furthermore, to define the role of SIRT5 in the carcinogenesis of PDAC, we generated autochthonous mouse models with conditional Sirt5 knockout. Moreover, to examine the mechanistic role of SIRT5 in PDAC carcinogenesis, SIRT5 was knocked down in PDAC cell lines and organoids, followed by metabolomics and proteomics studies. A novel SIRT5 activator was utilized for therapeutic studies in organoids and patient-derived xenografts.
Results:
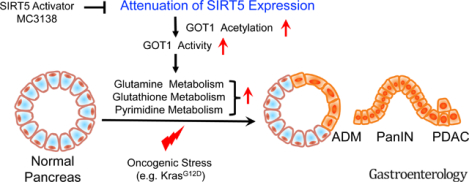
SIRT5 expression negatively regulated tumor cell proliferation and correlated with a favorable prognosis in PDAC patients. Genetic ablation of Sirt5 in PDAC mouse models promoted acinar-to-ductal metaplasia, precursor lesions, and pancreatic tumorigenesis, resulting in poor survival. Mechanistically, SIRT5 loss enhanced glutamine and glutathione metabolism via acetylation-mediated activation of GOT1. A selective SIRT5 activator, MC3138, phenocopied the effects of SIRT5 overexpression and exhibited anti-tumor effects on human PDAC cells. MC3138 also diminished nucleotide pools, sensitizing human PDAC cell lines, organoids, and patient-derived xenografts to gemcitabine.
Conclusions:
Collectively, we identify SIRT5 as a key tumor suppressor in PDAC, whose loss promotes tumorigenesis through increased non-canonical utilization of glutamine via GOT1, and that SIRT5 activation is a novel therapeutic strategy to target PDAC.
Keywords: SIRT5, GOT1, Pancreatic Cancer, Glutamine Metabolism, Glutathione Metabolism
Graphical Abstract
INTRODUCTION
A remarkable feature of Pancreatic ductal adenocarcinoma (PDAC) is the hypoxic, harsh, and nutrient-deficient tumor microenvironment1. Accordingly, PDAC cells tend to reprogram their metabolic pathways to survive and grow under these harsh conditions1–3. Therefore, a deeper understanding of the biological features and molecular regulation of metabolic dependencies of PDAC is strongly expected to provide novel targets for therapeutic interventions.
Unlike many other cells using glutamine to feed the tricarboxylic acid (TCA) cycle via glutamate dehydrogenase 1 (GLUD1), PDAC cells metabolize glutamine in a non-canonical way4, 5. Mitochondrial aspartate aminotransferase (glutamate-oxaloacetate transaminase 2; GOT2) converts glutamine to aspartate (Asp). Glutamine-derived Asp is transported to the cytoplasm. Next, cytosolic Asp aminotransferase (GOT1) converts glutamine-derived Asp to oxaloacetate (OAA), which is converted to malate by cytosolic malate dehydrogenase (MDH1). Then, the cytoplasmic malic enzyme 1 (ME1) catalyzes the oxidative decarboxylation of malate to pyruvate, with a concomitant production of NADPH, sustaining the redox homeostasis in PDAC cells. This non-canonical glutamine metabolic pathway is dispensable in normal cells, but it has the potential to serve as a promising therapeutic target in PDAC.
Sirtuins (SIRT1-SIRT7) are a class of evolutionarily conserved nicotinamide adenine dinucleotide (NAD+)-dependent enzymes that possess deacetylase, desuccinylase, deglutarylase, and demalonylase activity6, 7. Sirtuins have been implicated in cancer progression due to their roles in regulating cancer cell metabolism, the tumor microenvironment, and genome stability8. Among the seven mammalian sirtuins, SIRT5 has been shown to be located in both the mitochondria and the cytosol9–11. Given the pleiotropic role of SIRT5 in regulating cancer cell metabolism, it potentially can act as a tumor suppressor, or in contrast as an oncogene, in different cancer types and microenvironments by mediating the post-translational modification of its target substrates12–19. Yet, the function of SIRT5 in the initiation and progression of PDAC remains obscure.
The present study revealed SIRT5 to be downregulated in both human PDAC tissues and murine pancreatic tumors. Furthermore, we found SIRT5 deletion to accelerate tumor growth and to correlate with poor survival in both PDAC patients and genetically engineered mouse models. By integrating mass spectrometry-based metabolomics and proteomics with biochemical assays, GOT1 was identified as the critical target substrate in SIRT5-regulated PDAC progression. Mechanistically, SIRT5 deletion enhanced the enzyme activity of GOT1 by facilitating GOT1 acetylation. Importantly, SIRT5 activation with a novel small-molecule activator MC3138 inhibited proliferation in SIRT5-low PDAC cell lines and organoids. Furthermore, SIRT5 activation decreased nucleotide levels and facilitated synergy with gemcitabine in human PDAC organoids and patient-derived xenografts (PDX). Thus, the present study demonstrates SIRT5 activation, in combination with gemcitabine, as a potential therapeutic strategy in PDAC.
Materials and Methods
Cell Culture
Human PDAC cell lines Capan1, Capan2, AsPC1, PANC1, CFPAC-1, SW1990, and MIAPaCa-2, and HEK 293T were obtained from the American type culture collection (ATCC, Rockville, MD). The T3M4, S2-007, HPAF-II, Patu8902, Colo 357 (FG), and S2-013 cell lines were kindly provided by Dr. Michael A. Hollingsworth (Eppley Institute, UNMC, Omaha, NE). The murine PDAC cell lines KPC1245 derived from KrasG12D/+; p53R172H/+; Pdx1-Cretg/+ (KPC) mice were generously provided by Dr. David Tuveson (CSHL). Mouse PDAC cell lines KPC7460, KPC7472, and KPCS8508, KPCS8009 were derived from KPC and KPCS mice, respectively. Cells were cultured in DMEM supplemented with 10% fetal bovine serum, 1% penicillin-streptomycin and incubated at 37°C in a 5% CO2-humidified incubator. The cells were authenticated by STR profiling and tested for mycoplasma contamination using a PCR-based Mycoplasma Detection Kit.
Human Studies
The UNMC Tissue Bank provided the pancreatic cancer tissues used for PanIN and tumor progression studies, and PDX models. The UNMC Institutional Review Board (IRB) Committee approved the studies related to the use of human samples for IHC in PanIN lesions. The UNMC IRB Committee also approved the informed consent waiver. The pancreatic cancer tissue microarray used for survival analysis was obtained from Shanghai Outdo Biotech.
Mouse Strain Generation
The conditional LSL-KrasG12D, Pdx1-Cre20 and LSL-Tp53R172H21 stains were purchased from the National Cancer Institute. Floxed Sirt5 (Sirt5fl/fl) mice were provided by Dr. Johan Auwerx22. The above mice strains were interbred to produce the following experimental cohorts: Pdx1-Cre, Sirt5fl/fl (CS); Pdx1-Cre, LSL-KrasG12D (KC); Pdx1-Cre, LSL-KrasG12D, Sirt5fl/fl (KCS); Pdx1-Cre, LSL-KrasG12D, LSL-Tp53R172H (KPC); and Pdx1-Cre, LSL-KrasG12D, LSL-Tp53R172H, Sirt5fl/fl (KPCS). For Sirt5 loss-of-function studies, wild-type, Sirt5fl/fl, or Pdx1-Cre littermates were used as controls. These experiment cohort strains were genotyped by PCR amplification methods. PCR primers used in genotyping are listed in the Supplementary Table S4. For caerulein-induced pancreatitis, seven-week old mice of indicated genotypes were intraperitoneally injected with caerulein (50 μg/kg) for two consecutive days every hour for six hours each day.
Additional methods are provided in the Supplementary Material.
RESULTS
SIRT5 downregulation correlates with disease progression, adverse patient outcomes, and increased tumor cell growth.
The sirtuin family of proteins represents an important node in the regulation of cellular transcriptional response when presented with systemic metabolic cues or metabolic/nutritional changes23. To investigate whether sirtuins are dysregulated in PDAC, the present study evaluated the mRNA expression of all the seven sirtuins in matched human normal and PDAC tissues from the GEO database (GDS4103). Results showed that expression levels of SIRT3, SIRT5, and SIRT6 were significantly decreased in PDAC tissues, while expression levels of SIRT1 and SIRT7 were remarkably increased in PDAC (Figure 1A and Figure S1A–F). Among the dysregulated sirtuins, SIRT5 remains the only sirtuin that has not been investigated for its role in PDAC. To corroborate the expression data from GEO, the public database Oncomine was queried that further showed SIRT5 expression to be downregulated in PDAC tissues (Figure S1G–H).
Figure 1.
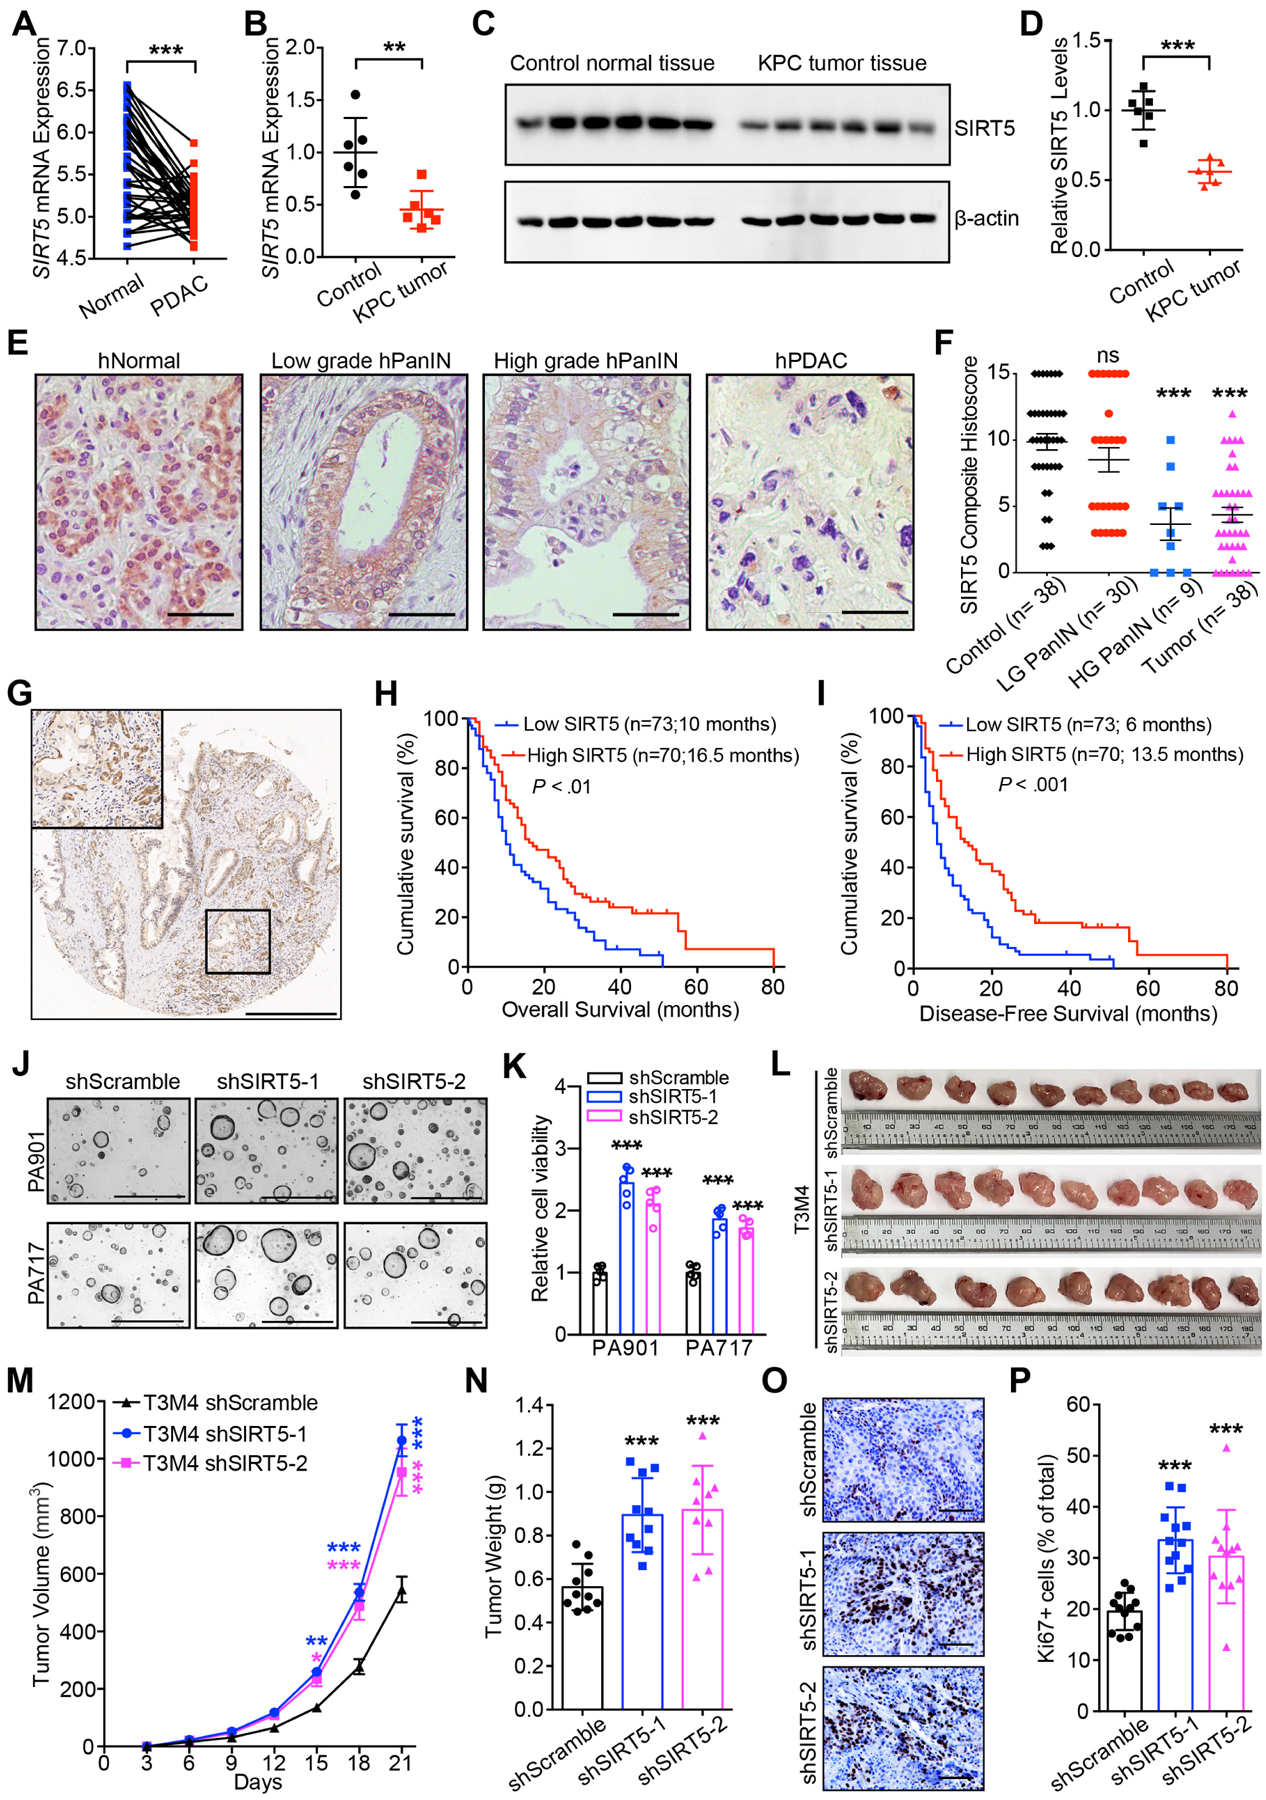
SIRT5 downregulation in PDAC correlates with disease progression, poor survival outcomes, and enhanced tumor cell growth.
(A). SIRT5 mRNA levels in pancreatic cancer tissues and the paired adjacent normal tissues from GEO database.
(B–D). Sirt5 mRNA (B) and protein (C–D) levels in 25-week old Cre control and KPC pancreatic cancer tissues.
(E–F). IHC staining and quantification for SIRT5 expression in normal acinar cells, low-grade and high-grade PanINs, and pancreatic tumors. Scale bar 100 μm.
(G). Representative IHC staining for SIRT5 expression in pancreatic cancer tissue microarrays. Scale bar 500 μm.
(H–I). Survival analysis of pancreatic cancer patients categorized by low and high SIRT5 expression.
(J–K). Representative images and cell viability for control and SIRT5-knockdown organoids cultured for 7 days. Scale bar 1000 μm.
(L–N). Representative image, tumor volume (mean ± SE) and tumor weight of control and SIRT5-knockdown tumors.
(O–P). Ki67 staining and quantitation in control and SIRT5-knockdown tumors. Scale bar 100 μm.
For all in vitro studies n ≥ 3. The data are represented as mean ± SD. Paired Student’s t-test (A, B, D), one-way ANOVA with Bonferroni’s test (K, N, P) or Tukey’s test (F), two-way ANOVA with Bonferroni’s test (M), Log-rank test (H-I), *P<.05, **P<.01, and ***P<.001.
To establish whether SIRT5 plays a causative role in the pathogenesis of PDAC, we utilized the autochthonous LSL-KrasG12D; LSL-Trp53R172H; Pdx1-Cre (KPC) mouse model and observed that Sirt5 mRNA and protein levels were significantly decreased in KPC pancreatic cancer tissues compared to the age-matched normal pancreas tissues (Figure 1B–D). A decrease in SIRT5 expression was noted during the progression from normal acinar cells to PanIN and PDAC in KPC mouse models (Figure S1I–J) and human samples (Figure 1E–F). Furthermore, low SIRT5 expression correlated with tumor recurrence in human patients (Table S1). Low expression of SIRT5 was associated with decreased survival of PDAC patients (Figure 1 G–I). Moreover, low SIRT5 expression independently correlated with high mortality risk in PDAC patients (Figure S1E and Table S1–S3).
To examine the effect of SIRT5 on PDAC aggressiveness, SIRT5 expression was evaluated in thirteen PDAC cell lines (Figure S1L). Cells with relatively high expression of SIRT5 (i.e. T3M4, Capan2, PANC1, and S2-007) were used to generate stable SIRT5 knockdowns, while those with low SIRT5 (i.e. S2-013 and Capan1) were chosen to generate SIRT5-overexpressing cell lines. The efficiency of SIRT5 knockdown and overexpression was verified by qPCR and immunoblotting (Figure S1M–Q). SIRT5 knockdown enhanced PDAC cell proliferation, colony formation, and sphere formation (Figure S2A–L). Conversely, SIRT5 overexpression inhibited PDAC cell growth, while the catalytically inactive mutant SIRT5-H158Y11 did not exhibit significant inhibitory effects on PDAC cell growth (Figure S2M–P). The expression levels of SIRT5 were also investigated in a panel of six human PDAC tumor-derived organoid lines, and SIRT5 expression was knocked down in the PA901 and PA717 organoids with high endogenous SIRT5 levels (Figure S1R–S). Knockdown of SIRT5 also increased human PDAC organoid growth (Figure 1J–K). Moreover, SIRT5 knockdown accelerated T3M4 tumor growth upon orthotopic implantation (Figure 1L–P).
Genetic ablation of Sirt5 promotes pancreatic tumorigenesis in cooperation with oncogenic mutations.
To determine the role of SIRT5 in PDAC pathogenesis, genetically-engineered mice were generated that carried pancreas-specific ablation of Sirt5, along with oncogenic mutations in Kras alone or Kras and Trp53. Pdx1-Cre; Sirt5fl/fl (CS), were generated by crossing Pdx1-Cre mice with Sirt5fl/fl mice (Figure S3A–B). As controls, histological analysis of pancreata isolated from CS and Pdx1-Cre mice did not show any apparent abnormalities (Figure S3C–D). Furthermore, there was no significant difference in the body weight changes between the above two groups (Figure S3E). KrasG12D; Sirt5fl/fl mice were crossed with Pdx1-Cre; Sirt5fl/+ mice to generate mice with mutant Kras and heterozygous/homozygous Sirt5 loss, i.e. Pdx1-Cre; KrasG12D; Sirt5fl/+; (KCShet) and Pdx1-Cre; KrasG12D; Sirt5fl/fl (KCS), respectively (Figure S3A–B and Figure 2A). The cholecystokinin analog caerulein is a widely-used drug to induce pancreatitis24. Wild type, Pdx1-Cre, and CS mice exhibited expected overall non-transformed pancreatic histology 21 days post-caerulein injection (Figure S4A–B). Conversely, KCS mice had a larger neoplastic area, increased acinar cell loss (decreased amylase positivity and increased CK19 positivity), and more high-grade PanIN lesions than the Pdx1-Cre; KrasG12D (KC) and KCShet mice (Figure 2B–E). SIRT5 IHC staining of pancreatic tissue from KCS mice confirmed the efficient deletion of Sirt5 (Figure S4C). Lesions from the KCS mice displayed a significantly enhanced cell proliferation index, as indicated by increased Ki67-staining (Figure S4C–D). Thus, Sirt5 deletion accelerates KrasG12D-triggered pancreatic tumorigenesis in the context of caerulein-induced pancreatitis model.
Figure 2.
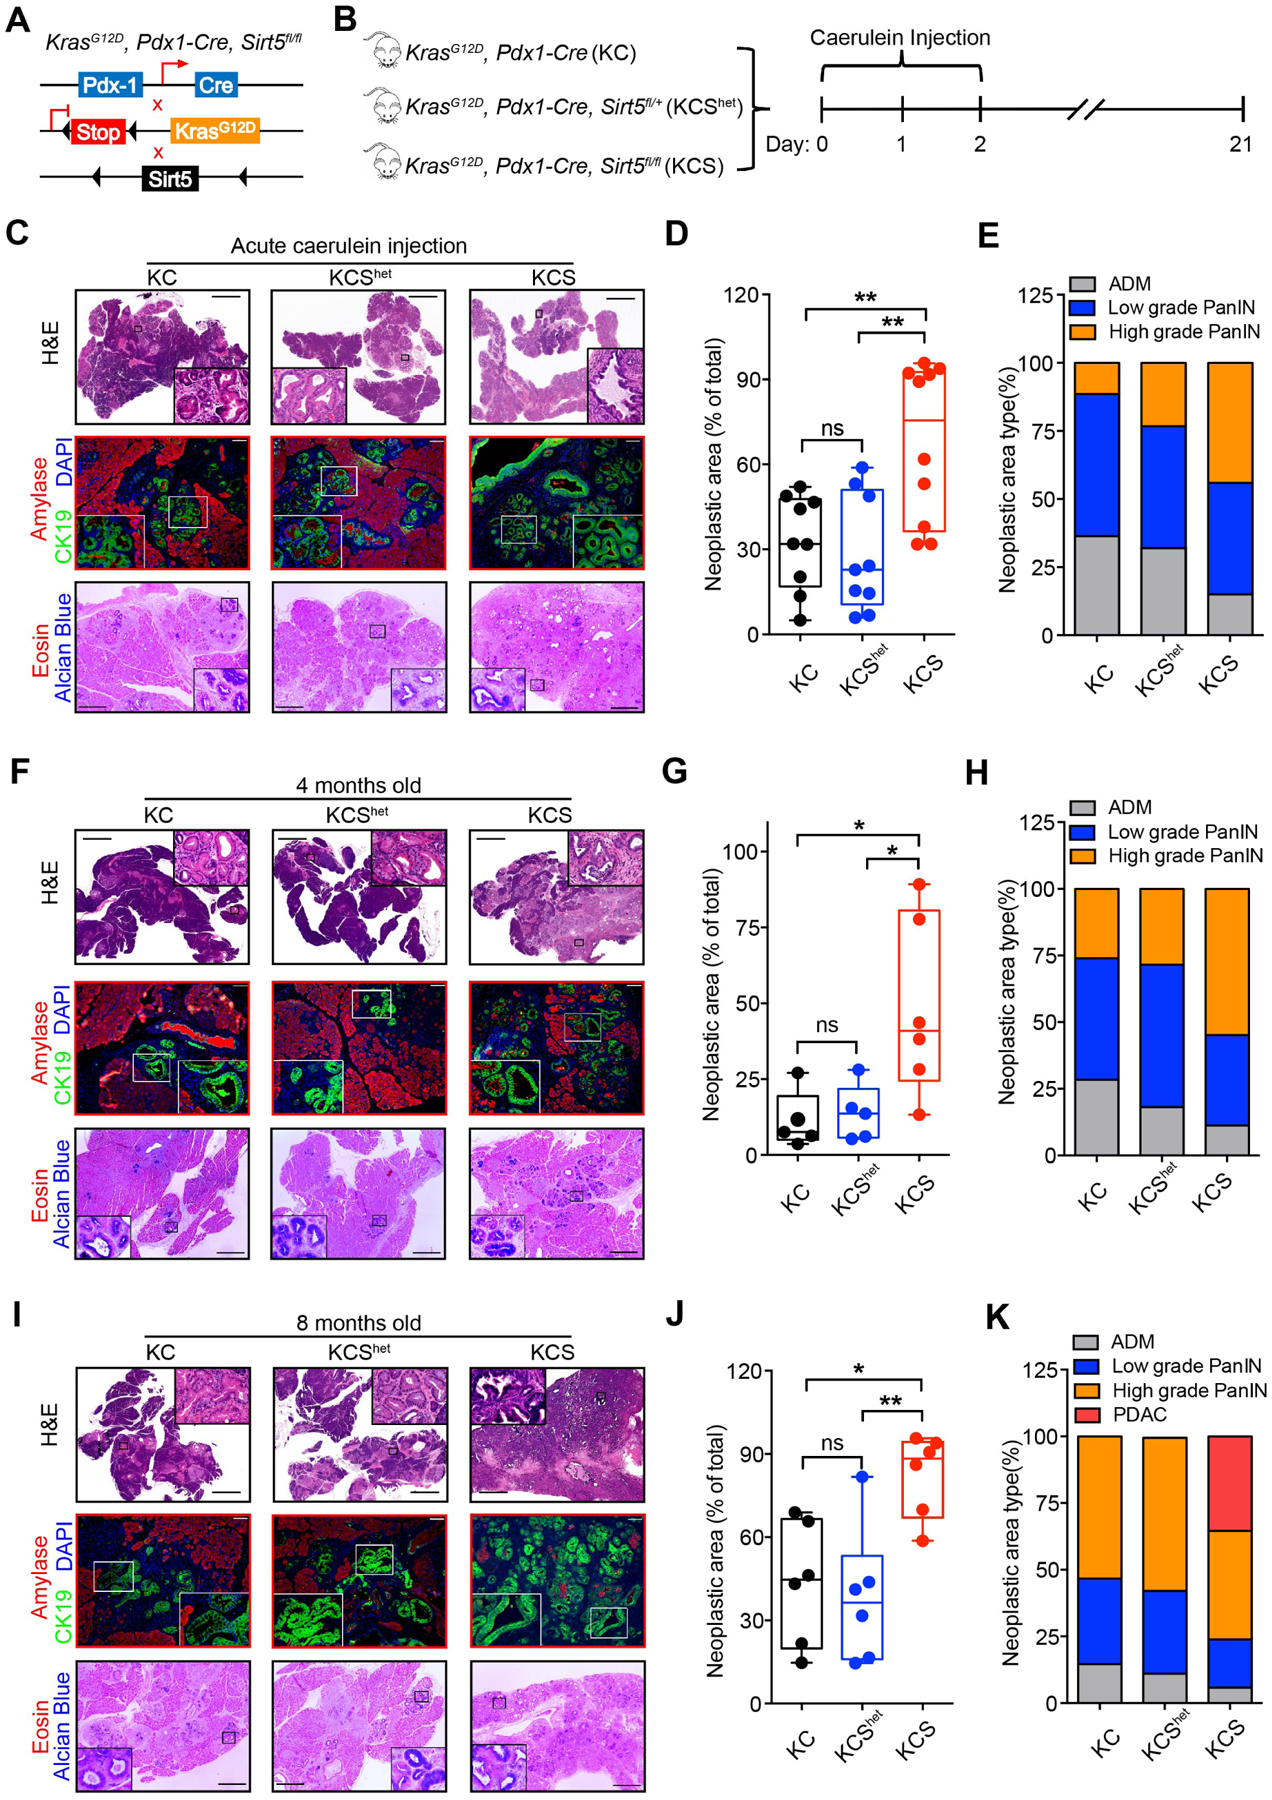
Sirt5 deficiency accelerates acinar-to-ductal metaplasia, PanIN formation, and pancreatic tumorigenesis.
Cre: Pdx1-Cre; KC: KrasG12D, Pdx1-Cre; KCShet: KrasG12D, Pdx1-Cre, Sirt5fl/+; KCS: KrasG12D, Pdx1-Cre, Sirt5fl/fl.
(A). Genetic strategy for investigating the function of Sirt5 in KrasG12D-driven pancreatic tumorigenesis.
(B). Intraperitoneally caerulein-injected KC (n = 9), KCShet (n = 9), and KCS (n = 10) mice were sacrificed at day 21.
(C). H&E, CK19/Amylase, and Alcian blue/eosin staining of pancreatic tissue from caerulein-injected KC, KCShet, and KCS mice. Scale bars 2000 μm (H&E), 100 μm (immunofluorescence), or 500 μm (Alcian blue/eosin staining).
(D). The percentage of total PanIN area over the whole pancreatic tissue section from caerulein-treated mice.
(E). Histopathologic analysis of pancreatic tissue sections from caerulein-treated mice.
(F and I). H&E, CK19/Amylase, and Alcian blue/eosin staining of pancreatic tissue sections from 4-month-old (F) and 8-month-old (I) KC, KCShet, and KCS mice.
(G). Percentage of PanIN lesions over the whole pancreatic tissue section from 4-month-old KC (n = 5), KCShet (n = 5), and KCS mice (n = 6).
(H and K). Histopathologic analysis of 4-month-old (H) and 8-month-old (K) KC, KCShet, and KCS mice tissue slides.
(J). Percentage of PanIN lesion area over the whole pancreatic tissue section from 8-month-old KC (n = 6), KCShet (n = 6), and KCS mice (n = 6).
The data are represented as mean ± SD. One-way ANOVA with Tukey’s test was used for all panels, *P<.05, **P<.01, and ***P<.001.
Next, the role of Sirt5 in KrasG12D-triggered pancreatic tumorigenesis was examined in the absence of caerulein. The pancreata from four-month old KCS mice exhibited significantly larger neoplastic areas as well as higher-grade PanIN lesions compared with age-matched KC and KCShet mice (Figure 2F–H). Ki67 staining results showed that the PanIN ductal cells from KCS mice exhibited enhanced proliferative index (Figure S4E–F). To identify the role of Sirt5 at a later stage of KrasG12D-triggered pancreatic tumorigenesis, pancreatic tissues were collected from eight-month old KC, KCShet, and KCS mice. All KCS mice obtained numerous PanIN lesions at the age of eight months, and two out of six KCS mice developed PDAC (Figure 2I–K). The area, grade, and proliferative potential of PanIN lesions in KC, as well as KCShet mice, were significantly lower than the age-matched KCS mice (Figure 2I–K, S4G–H). These data indicate Sirt5 loss facilitates the oncogenic KrasG12D-driven initiation of pancreatic tumorigenesis in the absence of caerulein.
To further examine the effect of Sirt5 deficiency on pancreatic cancer progression and survival, KPC (Pdx1-Cre; KrasG12D; Trp53R172H) mice with heterozygous/homozygous Sirt5 loss (Pdx1-Cre; KrasG12D; Trp53R172H; Sirt5fl/+, KPCShet and Pdx1-Cre; KrasG12D; Trp53R172H; Sirt5fl/fl, KPCS) were generated (Figure S3A–B and Figure 3A). KPCS mice at 15 weeks of age developed large intraperitoneal pancreatic tumor masses, while the corresponding age-matched KPC mice had only small pancreatic tumor nodules (Figure 3B). Age-matched KPC and KPCS mice were assessed at different time points to monitor the pancreatic tumorigenesis (Figure 3C). At six weeks, KPCS mice had significantly increased percentage of neoplastic area, and over half of the KPCS mice exhibited high-grade PanIN, which was significantly faster than the age-matched KPC and KPCShet mice (Figure 3C–E). Complete scans of pancreatic tissue sections indicated that pancreatic tumors arose in KPCS mice as early as 10 weeks (40%). Moreover, five out of six 15-week old KPCS mice developed pancreatic cancer (Figure 3F). Furthermore, Ki67 staining results demonstrated Sirt5 deletion significantly promoted pancreatic cancer cell proliferation (Figure 3G–H). As Sirt5 deletion in mice with the KPC background accelerated pancreatic cancer progression, KPC, KPCShet, and KPCS mice were then utilized to investigate the impact of Sirt5 loss on survival. The KPCS mice had a dramatically shortened median survival time at 116 days, whereas the median survival times of KPC and KPCShet mice were 173 days and 148.5 days, respectively (Figure 3I). Therefore, Sirt5 deletion, in cooperation with Kras and Tp53 mutations, accelerates pancreatic cancer progression and shortens the survival time of the spontaneous PDAC progression mouse model.
Figure 3.
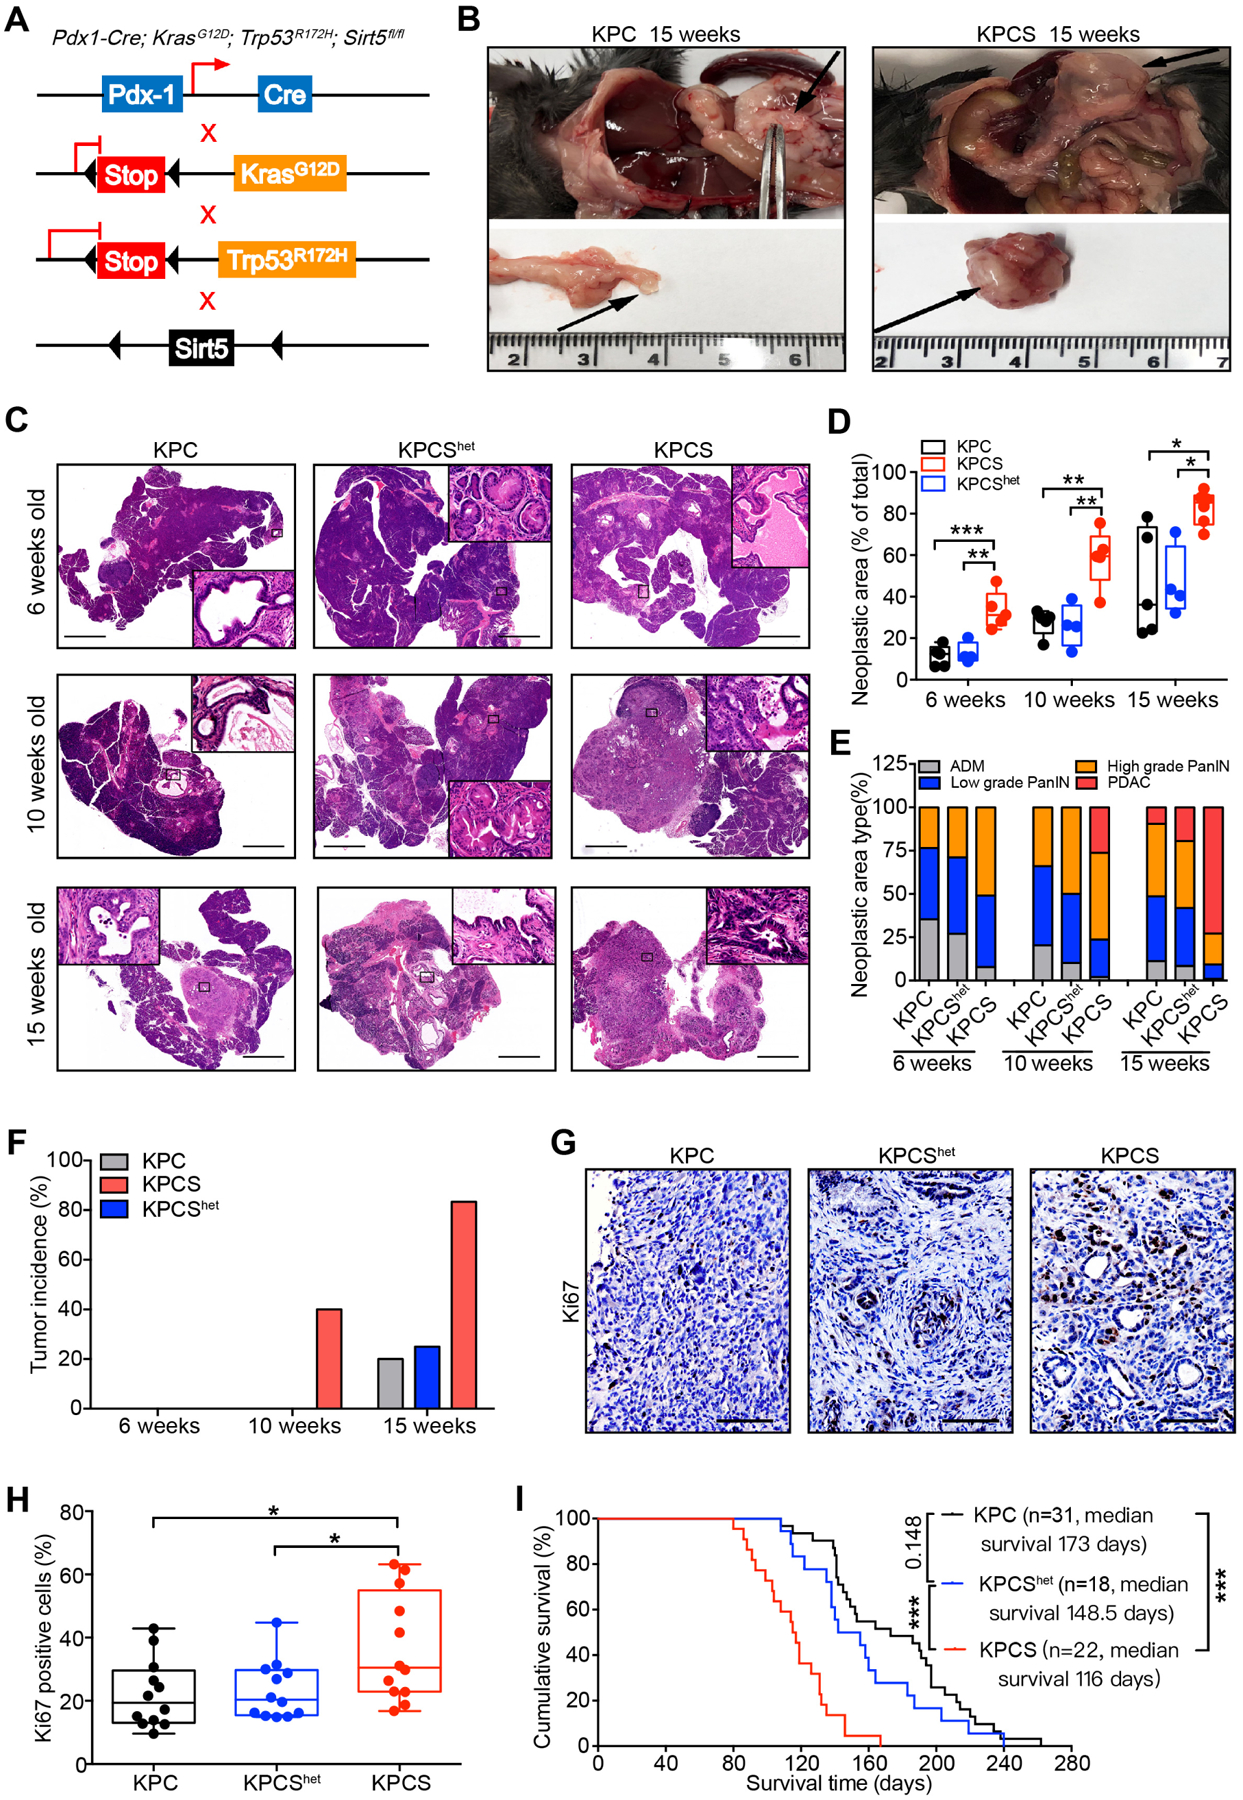
Genomic ablation of Sirt5 promotes PDAC progression.
(A). Genetic strategy for investigating the function of the Sirt5 in KrasG12D and Trp53R172H-driven pancreatic tumorigenesis.
(B). Representative images of pancreatic tumors in 15-week-old KPC and KPCS mice.
(C). Representative H&E-stained images of the pancreatic tissue from age-matched KPC (n = 5), KPCShet (n = 4), and KPCS (n = 5) mice at 6, 10, and 15 weeks. Scale bars 2000 μm.
(D). Percentage of PanIN and PDAC lesion area over the whole pancreatic tissue sections from KPC, KPCShet, and KPCS mice at the indicated age.
(E). Histopathologic analysis of pancreatic tissues from KPC, KPCShet, and KPCS mice at indicated age.
(F). Tumor incidence in KPC, KPCShet, and KPCS cohorts at the indicated age.
(G–H). Ki67 staining and quantification in pancreatic tumor tissues from KPC, KPCShet, and KPCS mice. Scale bars 100 μm.
(I). Kaplan-Meier survival analysis of the KPC, KPCShet, and KPCS mice (Log-rank test).
The data are represented as mean ± SD. One-way ANOVA with Tukey’s test for panels D & H, *P<.05, **P<.01, and ***P<.001.
SIRT5 modulates pancreatic cancer cell growth by suppressing glutamine and glutathione metabolism.
Previous studies have demonstrated that SIRT5 regulated tumorigenesis of multiple cancer types by mediating their metabolic reprogramming12–16. As such, the present study next investigated whether SIRT5 could regulate PDAC metabolism. LC-MS/MS-based metabolite profiles revealed distinct metabolic alterations between control and SIRT5-knockdown PDAC cells (Figure 4A–B, Figure S5). Moreover, metabolite set enrichment analysis indicated that SIRT5 knockdown led to significant changes in metabolites involved in glutathione metabolism, glutamine metabolism, pyrimidine metabolism, and the TCA cycle (Figure 4C–D). SIRT5-knockdown significantly increased the relative abundance of glutamine metabolism intermediates (i.e., malate, fumarate, and citrate), glutathione metabolism pathway metabolites (i.e., GSH and NADPH), and the pyrimidine metabolism intermediates (i.e., dCMP, CTP, dTTP, dUMP, and UTP) (Figure 4E–H, Figure S5A–B). SIRT5-knockdown also led to increased reduction potential as noted by increased GSH/GSSG and NADPH/NADP ratios (Figure 4E–F). Furthermore, the glutamine uptake was measured in control and SIRT5-knockdown PDAC cells. These assays revealed the uptake of glutamine remarkably increased in SIRT5-knockdown cells (Figure 4I). Interestingly, the differences in cell growth rates between the control and SIRT5-knockdown PDAC cells were much greater under the low-glucose (1.25mM, 5%) conditions than those in normal culture conditions (Figure 4J–M). These data suggest SIRT5 loss increases glutamine utilization to maintain redox balance and support PDAC cell growth even under glucose-limited conditions.
Figure 4.
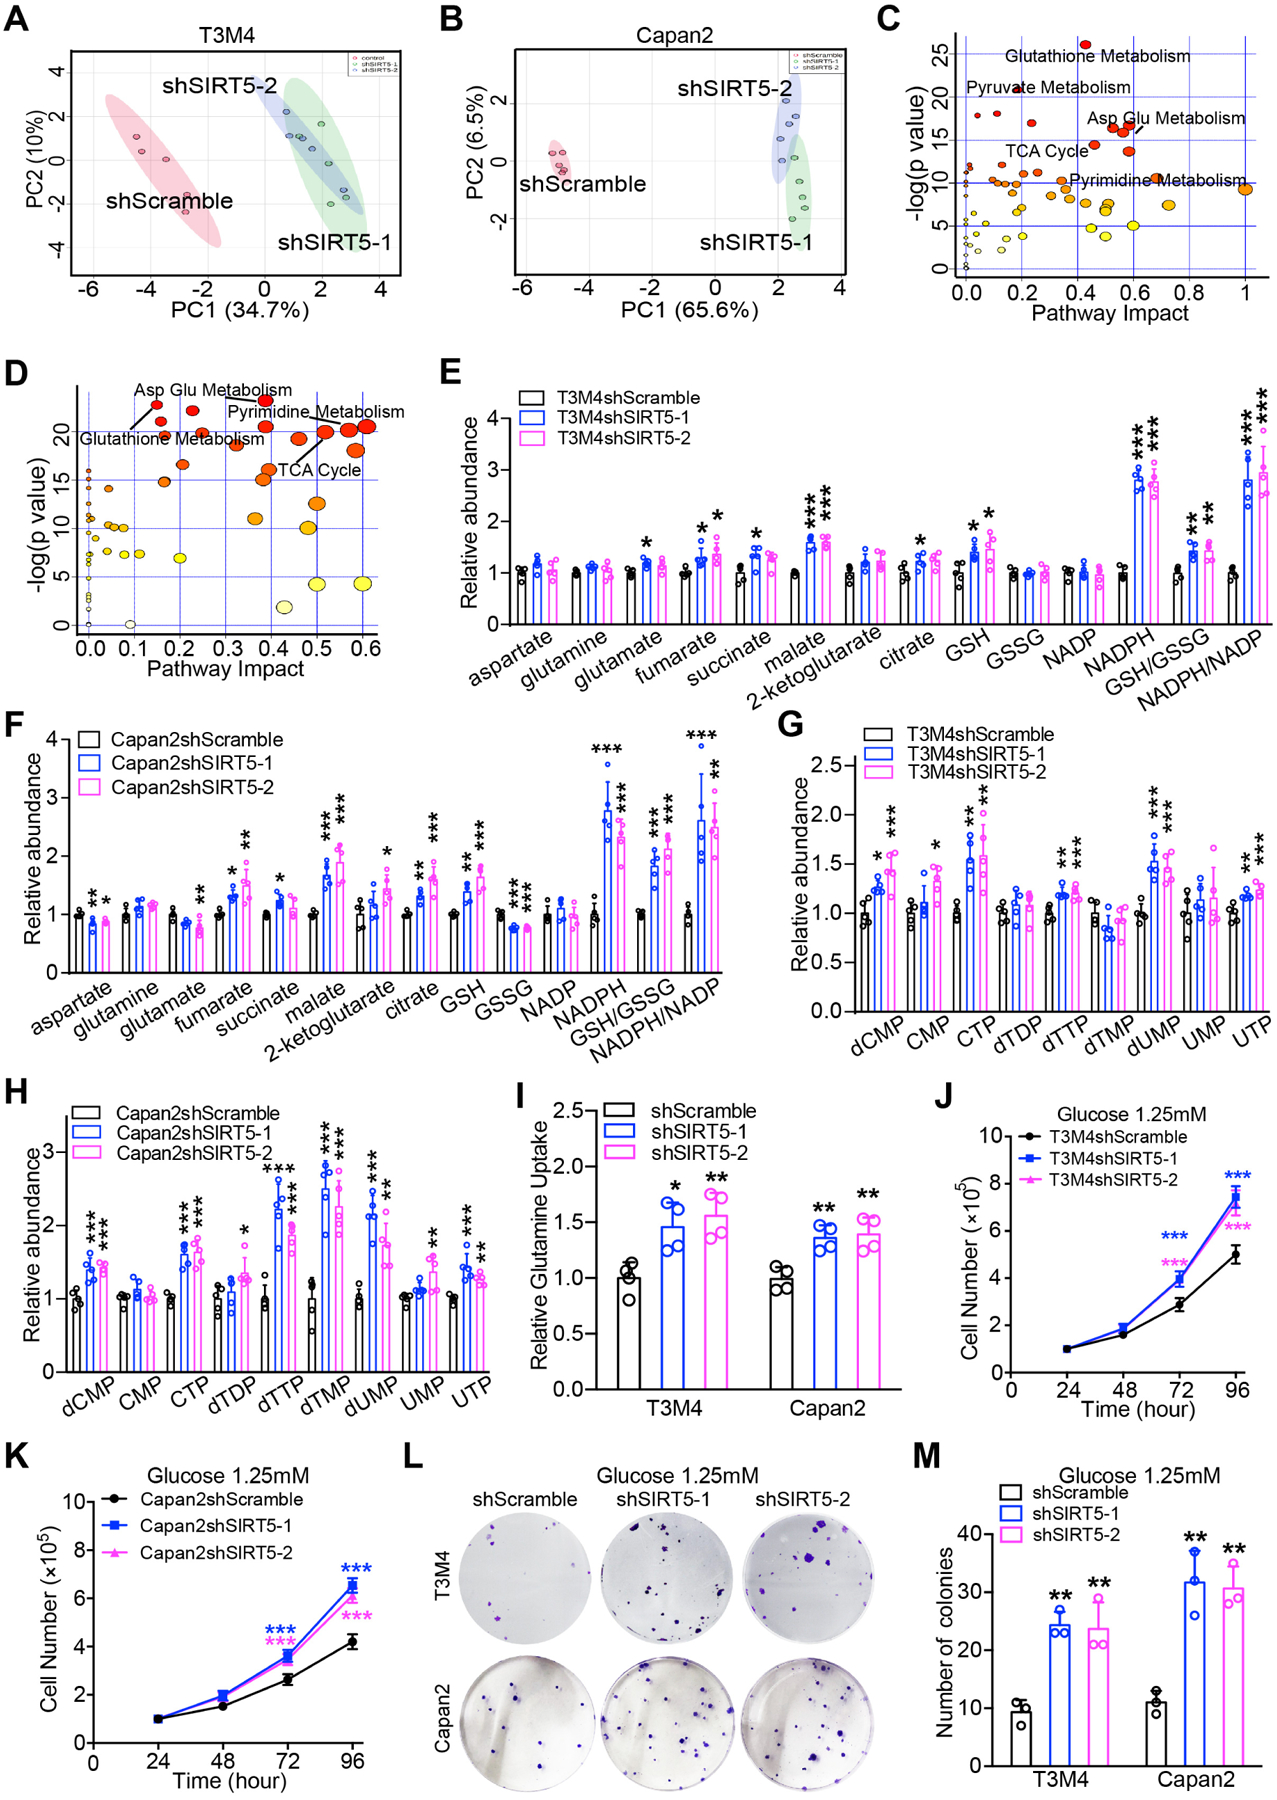
SIRT5 suppresses glutamine and glutathione metabolism, and regulates cellular redox homeostasis.
(A–B). Principal component analysis of metabolic profiles from control and SIRT5-knockdown cells (n= 5).
(C–D). Metabolic pathway analysis of significantly dysregulated metabolites in control and SIRT5-knockdown cells.
(E–F). Significantly different metabolites in glutamine and glutathione metabolism from control and SIRT5-knockdown cells.
(G–H). Significantly different metabolites in pyrimidine metabolism from control and SIRT5-knockdown cells.
(I). Relative glutamine uptake in control and SIRT5-knockdown cells.
(J–K). Growth curves of control and SIRT5-knockdown cells cultured under low glucose conditions (1.25 mM).
(L–M). Colony formation assays for control and SIRT5-knockdown cells under low glucose conditions (1.25 mM).
For all in vitro studies n ≥ 3. The data are represented as mean ± SD. One-way ANOVA with Bonferroni’s test (E-I, M), two-way ANOVA with Bonferroni’s test (J-K), *P<.05, **P<.01, and ***P<.001.
SIRT5 induces dysregulated glutamine and glutathione metabolism via GOT1.
Next, we investigated the mechanistic basis of SIRT5-mediated dysregulation of glutamine and glutathione metabolism in PDAC. KRAS-mutated PDAC cells rely on non-canonical glutamine metabolism (Figure 5A)5. There were no significant differences in mRNA or protein levels of non-canonical glutamine metabolic pathway enzymes upon SIRT5 knockdown (Figure S6A–C). As such, the present study measured the enzymatic activities of enzymes including glutaminase (GLS), GLUD1, and GOT from control and SIRT5-knockdown PDAC cell extracts. Interestingly, suppression of SIRT5 in PDAC cells significantly promoted the enzyme activity of GOT, but not GLS or GLUD1 (Figure 5B and Figure S6D–E). Next, the control and SIRT5-knockdown PDAC cells were treated with inhibitors of glutamine pathway metabolic enzymes to examine their selective responsiveness to these inhibitors (Figure S6F). Results showed SIRT5-knockdown PDAC cells were more sensitive to GOT-inhibitor aminooxyacetate (AOA) than control cells (Figure 5C–D), but there was no significant difference between control and SIRT5-knockdown cells when treated with GLS-inhibitor BPTES and GLUD1-inhibitor EGCG (Figure S6G–J). Moreover, orthotopic implantation studies demonstrated SIRT5-knockdown T3M4 cells were more vulnerable to AOA treatment (Figure 5E–G and Figure S6K–L). These data indicate SIRT5 inhibits glutamine/glutathione metabolism primarily by suppressing the enzyme activity of GOT.
Figure 5.
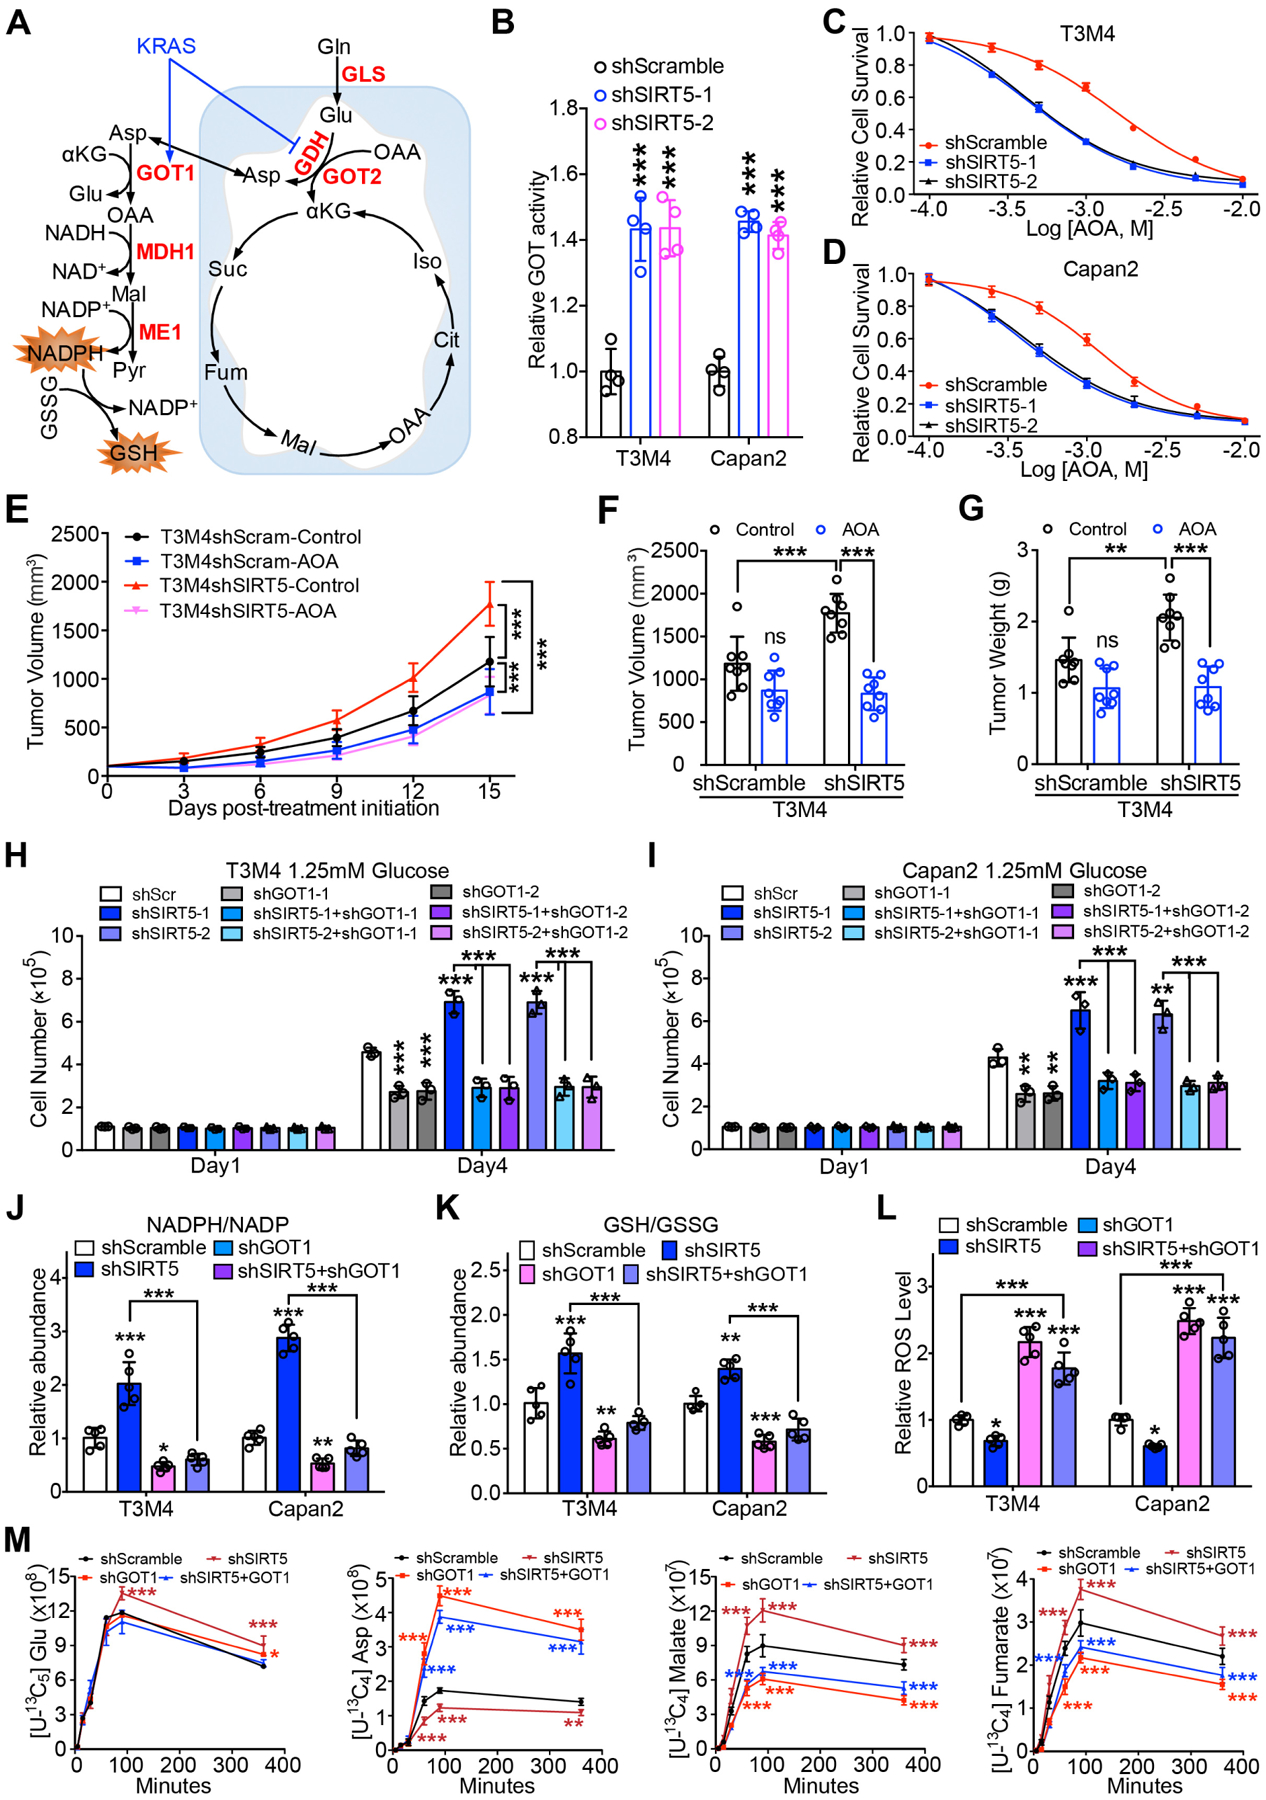
SIRT5 inhibits glutamine and glutathione metabolism by decreasing GOT1 enzyme activity.
(A). The schematic illustration of the Kras-regulated glutamine and glutathione metabolism in mutant Kras-driven PDAC.
(B). Relative GOT enzyme activity in control and SIRT5-knockdown cells.
(C–D). Relative survival of control and SIRT5-knockdown cells treated with GOT inhibitor AOA. Data are normalized to the respective untreated group.
(E–G). Effect of AOA treatment on T3M4 shScramble and shSIRT5 cells in vivo. Tumor growth rates at indicated time points (E). Tumor volume (F) and tumor weight in each group upon necropsy (G).
(H–I). Cell growth of control and SIRT5-knockdown cells transfected with control or GOT1 shRNA under low glucose conditions (1.25 mM). Experiment for scrambled control and SIRT5-knockdown cells transfected with GOT1 or GOT2 shRNA were set up together with common controls.
(J–K). Relative NADPH/NADP ratio (J) or GSH/GSSG ratio (K) in control, GOT1-knockdown, SIRT5-knockdown, and SIRT5/GOT1-double-knockdown cells. GSH, reduced glutathione; GSSH, oxidized glutathione.
(L). Relative intracellular ROS levels in the indicated cells. ROS-insensitive carboxy-DCFDA (CDCFDA) dye was used as a negative control.
(M). Kinetic flux analysis of 13C-labeled glutamine carbon incorporation into downstream metabolites in control, GOT1-knockdown, SIRT5-knockdown, and SIRT5/GOT1-double-knockdown T3M4 cells. Asp, aspartate; Glu, glutamate.
For all in vitro studies n ≥ 3. The data are represented as mean ± SD. One-way ANOVA with Bonferroni’s test (B) or Tukey’s test (F–L), two-way ANOVA with Tukey’s test (E) or Bonferroni’s test (M), *P<.05, **P<.01, and ***P<.001.
To further identify which GOT isoform (GOT1 or GOT2) is the primary target of SIRT5, GOT1 and GOT2 were knocked down in both control and SIRT5-knockdown PDAC cells (Figure S6M–P). GOT1 silencing abolished SIRT5-knockdown-induced PDAC cell growth (Figure 5H–I), while knockdown of GOT2 did not significantly affect cell growth in all the SIRT5-knockdown cells under low-glucose (1.25mM) conditions (Figure S6Q–R). These data preliminarily indicate that GOT1 plays a major role in SIRT5-loss-mediated cell growth. To confirm the regulation of GOT1 by SIRT5, metabolites from control, GOT1-knockdown, SIRT5-knockdown, and SIRT5/GOT1-double-knockdown cells were subjected to LC-MS/MS-based metabolomic analysis. SIRT5-knockdown cells demonstrated significantly increased ratios of reduced-glutathione to oxidized-glutathione (GSH/GSSG) and cellular NADPH/NADP+, which was abolished by GOT1 knockdown (Figure 5J–K). GOT1 catalyzes the conversion reactions of 2-ketoglutarate (αKG) and aspartate into glutamate and oxaloacetate. The metabolomics data indicated SIRT5 knockdown increased the abundance of the GOT1 downstream intermediates (i.e., malate, fumarate). Contrastingly, SIRT5-loss-induced increase in malate and fumarate levels was abolished by the GOT1 knockdown, with a concomitant increase in the levels of the precursor metabolite αKG (Figure S6S–T). As the reducing equivalent NADPH and GSH are important for cellular redox homeostasis, SIRT5 knockdown was posited to increase the generation of NADPH and GSH to maintain redox balance and promote cell proliferation in PDAC cells. As expected, GOT1 silencing abrogated SIRT5-knockdown-mediated decrease of the intracellular ROS levels (Figure 5L). Furthermore, [U-13C5] glutamine-based kinetic flux analysis demonstrated SIRT5 knockdown significantly increased levels of 13C-labeled malate and fumarate, these increased levels were abolished by GOT1 knockdown (Figure 5M). Taken together, these findings indicate SIRT5 inhibits glutamine/glutathione metabolism and regulates cellular redox homeostasis by attenuating the enzymatic activity of GOT1.
SIRT5 inhibits GOT1 enzymatic activity by catalyzing its lysine deacetylation.
We then investigated the mechanistic basis of SIRT5-mediated modulation of GOT1 activity. Considering SIRT5 has been found to regulate metabolic enzymatic activity by altering the post-translational modifications in enzymes11, 25–28, the present study examined whether SIRT5 potentially catalyzes lysine post-translational modifications in GOT1. Interestingly, the lysine acetylation level of GOT1 decreased upon SIRT5 overexpression in PDAC cells, while the lysine glutarylation, succinylation, or malonylation levels of GOT1 remained unaltered or undetectable (Figure 6A). In contrast, SIRT5-knockdown significantly increased the acetylation level of both exogenous GOT1 (Figure 6B) and endogenous GOT1 (Figure S7A). Moreover, the catalytically inactive mutant SIRT5-H158Y11 failed to induce the deacetylation of GOT1 protein compared with the wild-type SIRT5 (Figure 6C). To further identify the SIRT5-dependent deacetylation sites on GOT1, GOT1 protein was purified from the control and SIRT5-knockdown T3M4 cells, and post-translational modifications were assessed using mass spectrometry. As shown in Figure 6D and Figure S7B–G, three acetylation sites (lysine 276, lysine 290, lysine 369) were found in both control and SIRT5-knockdown cells. In addition, a comparison of the lysine acetylation intensities of GOT1 between control and SIRT5-knockdown cells indicated lysine 369 as the major lysine target residue that SIRT5 deacetylates (Figure 6D).
Figure 6.
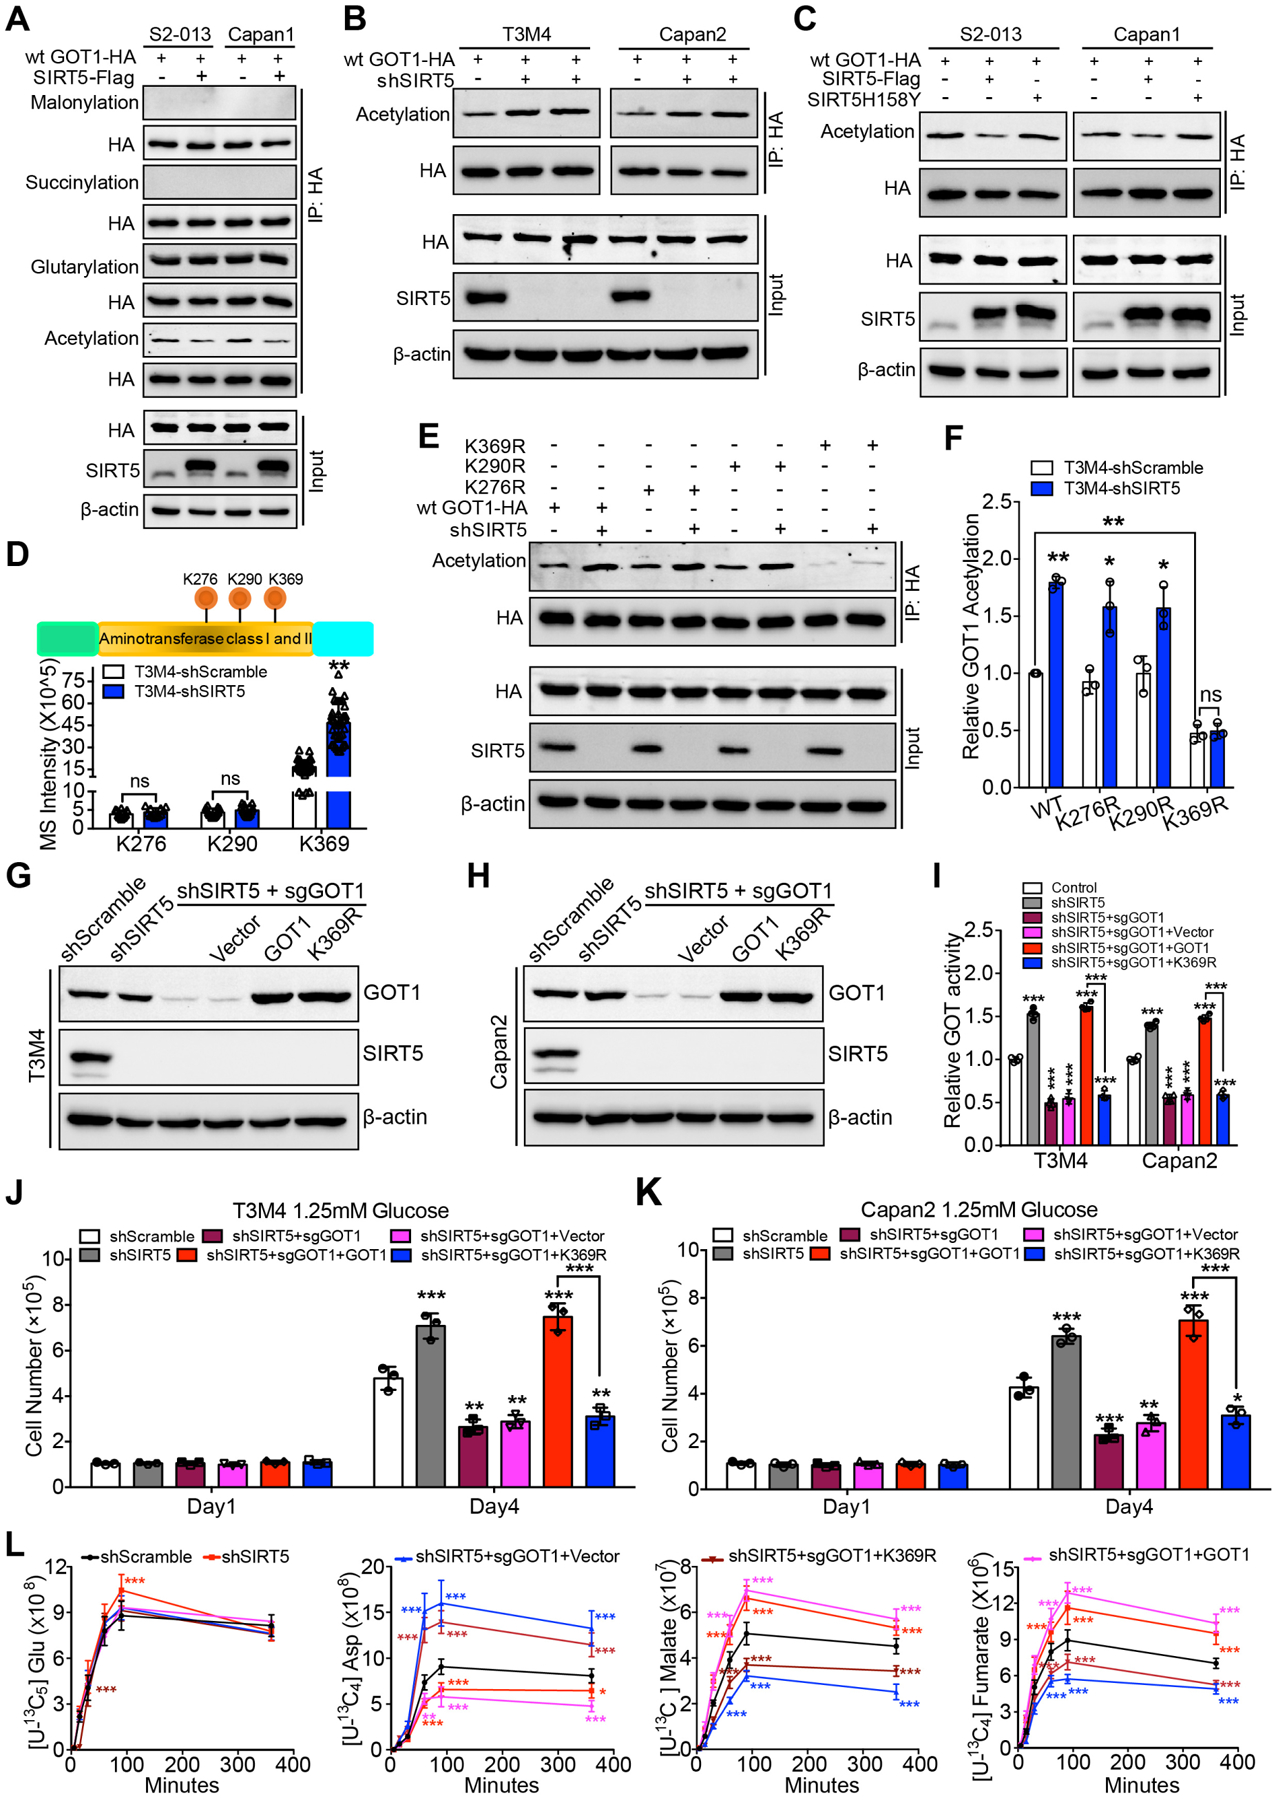
SIRT5 inhibits GOT1 enzymatic activity by catalyzing its lysine deacetylation.
(A). The lysine acetylation, glutarylation, succinylation, and malonylation levels of GOT1 protein immunoprecipitated from control and SIRT5-overexpressing PDAC cells. Input are shown below.
(B). The lysine acetylation level of GOT1 protein immunoprecipitated from control and SIRT5-knockdown T3M4/Capan2 cells. Input are shown below.
(C). The lysine acetylation level of GOT1 protein immunoprecipitated from PDAC cells transfected with vector, SIRT5, and mutant SIRT5-H158Y plasmid. Input are shown below.
(D). Exogenous GOT1 protein immunoprecipitated from control and SIRT5-knockdown T3M4 cells was subjected to proteomic analysis. Top, schematic representation of three acetylation sites identified in GOT1; Bottom, the mass spectrometric signal intensity of indicated acetylation sites in GOT1.
(E–F). Wild-type GOT1, GOT1-K276R, GOT1-K290R, and GOT1-K369R mutant plasmids were transfected into control and SIRT5-knockdown T3M4 cells. The lysine acetylation levels of GOT1 protein immunoprecipitated from above cells, input are shown below (E). The quantification of relative lysine acetylation level of indicated acetylation sites (F).
(G–H). The immunoblotting of SIRT5 and GOT1 levels in scrambled control cells, SIRT5-knockdown cells, and SIRT5-knockdown/GOT1-knockout cells transfected with vector, GOT1, or GOT1-K369R plasmid.
(I). The GOT enzyme activity in scrambled control cells, SIRT5-knockdown cells, and SIRT5-knockdown/GOT1-knockout cells transfected with vector, GOT1, or GOT1-K369R plasmids.
(J–K). Cell growth analysis of scrambled control cells, SIRT5-knockdown cells, and SIRT5-knockdown/GOT1-knockout cells transfected with vector, GOT1, or GOT1-K369R plasmids, cultured under low glucose conditions (1.25 mM).
(L). Kinetic flux analysis of 13C-labeled glutamine carbon incorporation into downstream metabolites in scrambled control cells, SIRT5-knockdown cells, or SIRT5-knockdown/GOT1-knockout cells transfected with vector, wild-type GOT1, or GOT1-K369R plasmids.
For all in vitro studies n ≥ 3. The data are represented as mean ± SD. Student’s t-test (D, F), one-way ANOVA with Tukey’s test (I-K), two-way ANOVA with Tukey’s test (L), *P<.05, **P<.01, and ***P<.001.
To identify if SIRT5-catalyzed post-translational modifications of GOT1 regulated GOT1 activity, we performed site-directed mutagenesis. The lysine to arginine (i.e., K-to-R) mutation preserves the positive charge but cannot be acetylated, and is frequently used as a deacylated lysine mimetic29. Hence, three mutant HA-tagged GOT1 plasmids were generated, in which the lysine 276, lysine 290, or lysine 369 residues were substituted with arginine (R). The wild-type GOT1 plasmid, GOT1-K276R, GOT1-K290R, and GOT1-K369R mutant plasmids were transfected into control and SIRT5-knockdown T3M4 cells. Immunoblots of the purified GOT1 protein from cells expressing wild-type GOT1, GOT1-K276R, GOT1-K290R, and GOT1-K369R mutants were used to detect the acetylation levels of GOT1. The K369R mutation resulted in a significant decrease in the acetylation level of GOT1 (Figure 6E–F). Furthermore, SIRT5-knockdown significantly increased the lysine acetylation levels of wild-type GOT1, GOT1-K276R and GOT1-K290R mutants, but not the GOT1-K369R mutant (Figure 6E–F). These data indicate lysine 369 in GOT1 protein is the primary deacetylation target of SIRT5. To further evaluate the function of GOT1-K369 acetylation under SIRT5-knockdown conditions, first the CRISPR/Cas9 technique was used to generate GOT1-knockout/SIRT5-knockdown cells. The above GOT1-knockout/SIRT5-knockdown cells were then engineered to re-express vector, wild-type GOT1, or GOT1-K369R mutant plasmids (Figure 6G–H). GOT1 knockout abolished SIRT5-knockdown-mediated increase of GOT enzymatic activity, while re-expressing wild-type GOT1, but not GOT1-K369R, restored this activity (Figure 6I). Thus, K369 deacetylation by SIRT5 is primarily responsible for SIRT5-mediated abrogation of GOT activity in PDAC cells.
GOT1 knockout inhibited the effects of SIRT5-knockdown on cell growth, while re-expression of wild-type GOT1 rescued. However, re-expression of GOT1-K369R failed to restore cell growth in GOT1-knockout/SIRT5-knockdown PDAC cells under low-glucose (1.25mM) conditions (Figure 6J–K). Consistently, the [U-13C5] glutamine-based kinetic flux analysis indicated GOT1 knockout abolished the increased 13C-labeled malate and fumarate levels in SIRT5-knockdown cells. Moreover, re-expressing wild-type GOT1 could restore the 13C-labeled malate and fumarate levels in GOT1-knockout/SIRT5-knockdown cells, whereas expressing GOT1-K369R was unable to rescue this phenomenon (Figure 6L). Taken together, these results strongly indicate that SIRT5 suppresses GOT1 enzymatic activity by deacetylating GOT1 at lysine 369, which leads to the inhibition of tumor cell growth.
Targeting PDAC with small-molecule SIRT5-activator MC3138 improves therapeutic efficiency.
Given the important role of SIRT5 in the development of PDAC, it has the potential to serve as a promising drug target. A small-molecule SIRT5 activator, a 1,4-dihydropyridine termed MC3138 was developed (Figure 7A) and tested for potential effects on human PDAC cell lines, organoids, and PDX tumors. The biochemical enzymatic assay results indicated that MC3138 exhibited a selective activation of SIRT5 compared to the selective SIRT1 activator SRT2104 and SIRT3 activator Honokiol (Figure S8A–C). Moreover, treatment with MC3138 mimicked the deacetylation effect mediated by SIRT5 overexpression (Figure S8D). MC3138 treatment decreased lysine acetylation of the GOT1 protein and inhibited its enzymatic activity (Figure 7B–C). The cell viability assay showed MC3138 reduced PDAC cell viability, with IC50 values ranging from 25.4 μM to 236.9 μM (Figure 7D and Figure S8E–F). To validate whether the inhibitory effect of MC3138 was associated with activation of SIRT5, a correlation analysis between the IC50 of MC3138 and SIRT5 protein levels was performed. The IC50 value of MC3138 positively correlated with SIRT5 protein levels (Figure 7E). Moreover, MC3138 was tested in mouse KPC and KPCS cells. Because KPCS cells do not express SIRT5, these cells were, as expected, resistant to MC3138 treatment (Figure 7F). Conversely, the SIRT1 activator SRT2104 and SIRT3 activator Honokiol did not exhibit selective growth inhibition between KPC and KPCS cells (Figure S8G–H). As SIRT5 knockdown significantly increased the metabolite levels in glutamine, glutathione, and pyrimidine metabolism pathways (Figure 4E–H), these metabolites levels were also investigated in PDAC cells treated by MC3138. MC3138 treatment decreased the metabolite levels in these pathways (Figure S8I–L). Our previous studies identified that the increase of endogenous pyrimidine pools can diminish the therapeutic efficiency of pyrimidine analog gemcitabine by molecular competition30. Next, the combinational effect of MC3138 and gemcitabine, a first-line FDA-approved chemotherapeutic to treat PDAC patients, was investigated. A combination of gemcitabine and MC3138 at different dosages exhibited synergistic effects in CFPAC-1 and Colo357/FG cells (Figure S8M–P). Likewise, gemcitabine combined with MC3138 was synergistic at different concentrations in human PDAC organoids with low SIRT5 expression (Figure 7G–L). The MC3138 pharmacokinetics showed that the maximum concentration and half-life of MC3138 in plasma was around 230 μM and 5.059 hours, respectively (Figure S8Q). To further investigate the effect of gemcitabine combined with MC3138 in vivo, PDX tumors (PA137) were orthotopically implanted in NOD-SCID mice. The concentration of MC3138 in the MC3138-treated tumors ranged from around 100 to 200 μM, with the average as 143.57 μM, indicating that MC3138 was efficiently delivered to the tumor tissues (Figure S8R). The combination of gemcitabine and MC3138 significantly decreased tumor size, tumor weight and tumor proliferation cell index in mice (Figure 7M–O, Figure S8S–T). In addition, the GOT activity was significantly decreased in the MC3138-treated tumors (Figure S8U). More importantly, the administered drug combination was well tolerated in mice as no significant alterations were observed in body weight and blood biochemistry indices (Figure S8V–W). Collectively, these data indicate that gemcitabine combined with SIRT5 activator MC3138 can be a potential therapeutic option for PDAC with low SIRT5 expression.
Figure 7.
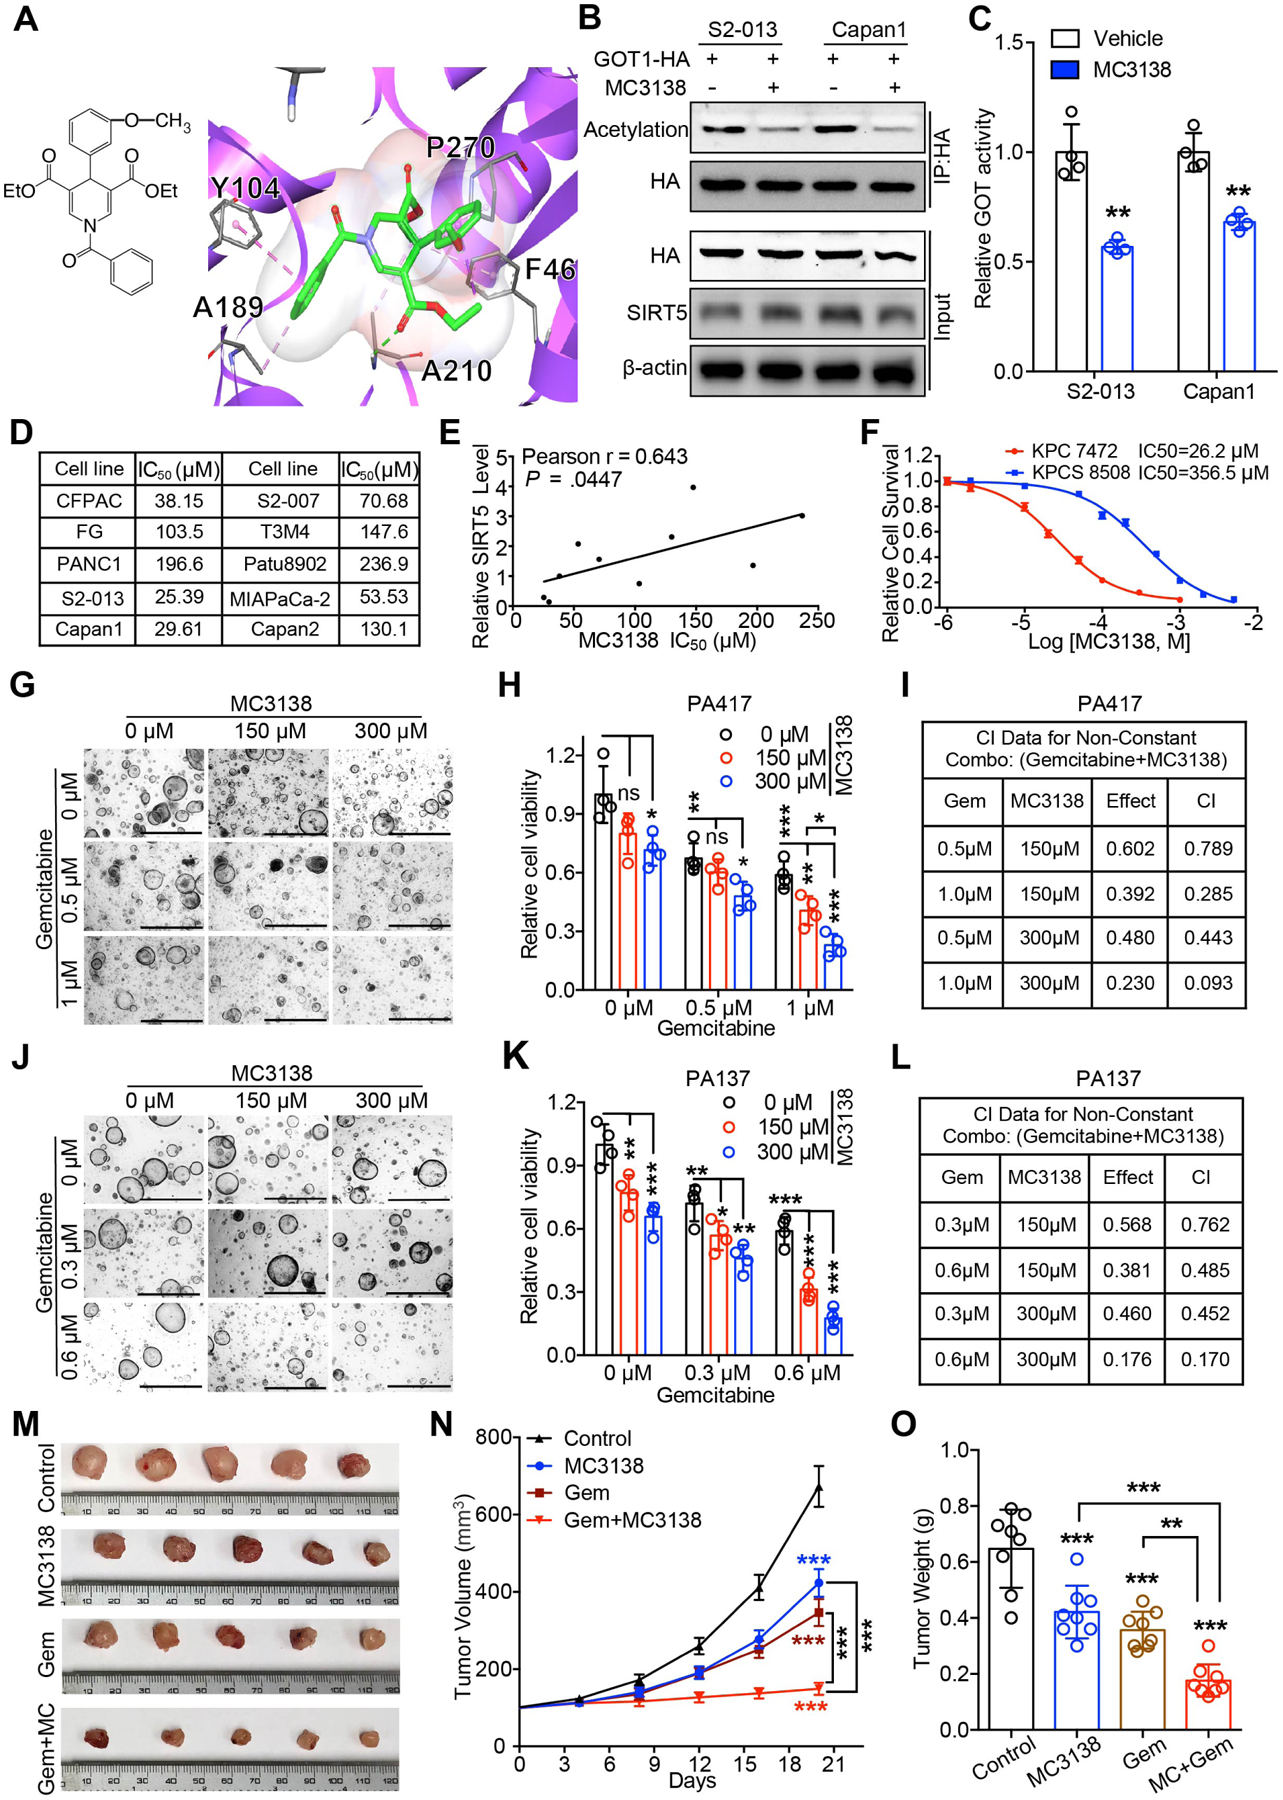
SIRT5 activator MC3138 exhibits anti-tumor effects and synergism with gemcitabine in human PDAC cells, organoids, and PDX models.
(A). The chemical structure of SIRT5 activator MC3138 and an enlarged view of Sirt5 docked with MC3138. Protein is shown in purple flat ribbon and compound is depicted via a stick model.
(B). The lysine acetylation level of GOT1 protein immunoprecipitated from PDAC cells treated with DMSO or 10 μM MC3138 for 24 h. Input are shown below.
(C). The GOT enzyme activity in PDAC cells treated with DMSO or 10 μM MC3138 for 24 h.
(D). IC50 data of ten wild-type PDAC cell lines treated by MC3138.
(E). Pearson’s correlation analysis between SIRT5 protein level (from Figure S1L) and IC50 of MC3138 in PDAC cell lines.
(F). Relative cell survival of KPC cell and SIRT5-knockout KPC cell (KPCS) treated with MC3138.
(G–H, J–K). Representative images and cell viability of PDAC organoids PA417 (G–H) and PA137 (J–K) treated with indicated concentration of gemcitabine and MC3138 for 72 h.
(I, L). Combination index (CI) of gemcitabine and MC3138 at indicated concentrations. ‘Effect’ in the Table refers to the relative cell survival upon the combination therapy treatment.
(M–O). Effect of MC3138 in combination with gemcitabine on PDX (PA137) model. Representative tumor images upon necropsy (M). Tumor volumes are represented as mean ± SEM (N). Tumor weight upon necropsy (O). Gem: Gemcitabine; MC: MC3138.
For all in vitro studies n ≥ 3. The data are represented as mean ± SD. Student’s t-test (C), one-way ANOVA with Tukey’s test (H, K, O), two-way ANOVA with Tukey’s test (N), *P<.05, **P<.01, and ***P<.001.
DISCUSSION
In this work, we established a novel tumor suppressor function of SIRT5 in PDAC cell lines, organoids, orthotopic and spontaneous models, and patients. SIRT5 knockdown increased PDAC cell growth in normal and nutrient-limited conditions while SIRT5 overexpression diminished PDAC cell growth. Genetic ablation of Sirt5 in the mouse spontaneous tumor progression model accelerated acinar-to-ductal metaplasia, PanIN formation, and pancreatic tumorigenesis, which results in decreased survival.
Previous studies demonstrate that Kras-mutated PDAC can reprogram its metabolism to adapt to the harsh microenvironment5. However, the molecular regulators downstream of oncogenic Kras that mediate metabolic adaptations, remain poorly characterized. Our present study shows Sirt5 mRNA and protein levels are decreased in KPC tumor tissues. In the genetically engineered mouse model with the oncogenic KrasG12D mutation, Sirt5 ablation accelerated PanIN formation and PDAC progression. Hence, Sirt5 loss potentially functions downstream of Kras, and facilitates the oncogenic Kras mutation-driven PDAC initiation and development.
Previous studies reveal oncogenic Kras mutation-driven PDAC cells utilize glutamine in a non-canonical way via the GOT2-GOT1-ME1 pathway5, 31. However, the mechanistic basis of Kras-mediated induction of the pathway is not fully understood. Accordingly, our present study shows that SIRT5 can suppress PDAC progression by inhibiting the GOT1-mediated glutamine/glutathione metabolic pathway via post-translational modification of GOT1. Notably, SIRT5 knockdown sensitizes PDAC cells to the GOT-inhibitor AOA both in vitro and in vivo. While the GOT-inhibitor AOA is a pan-aminotransferase inhibitor32, 33, SIRT5-knockdown PDAC cells with significantly higher GOT1 activity were much more sensitive to AOA treatment both in vitro and in vivo (Figure 5 B–G). Combined with increased glutamine uptake of SIRT5 knockdown cells, these results indicate SIRT5-mediated deacetylation of GOT1 as a metabolic switch that must be inactivated to facilitate Kras-induced glutamine addiction. Notably, very few studies have reported direct regulation of glutamine metabolism in cancer cells via post-translational modifications that provide nutritional flexibility. Yang et al. showed that SIRT3 regulated the malate–aspartate shuttle activity by deacetylating GOT2 in pancreatic cancer34. However, unlike GOT1, GOT2 knockdown could not abolish SIRT5 knockdown-induced increased cell growth under low glucose conditions. Two other SIRT5-mediated post-translational modifications have been reported to target glutamine metabolism via SIRT5-mediated desuccinylation of GLS in breast cancer and deglutarylation of GLUD1 in colorectal cancer that increased glutamine uptake and metabolism to support proliferation in other tumor models13, 16. Conversely, we report increased glutamine uptake and enhanced cell growth in PDAC upon SIRT5 knockdown. Of note, in a previous study, GLUD1 knockdown failed to diminish Kras-induced PDAC cell growth; however, GOT1 knockdown significantly inhibited tumor cell growth5. These studies are further supported by our findings and lead to the notion that the mechanistic regulation of glutamine metabolism is distinct in Kras-driven PDAC tumors as compared to tumors of other origin and non-cancer cells that are dependent on the canonical glutamine metabolism. Thus, our study demonstrates the mechanistic regulation of non-canonical glutamine metabolism via post-translational modifications in PDAC cells with activating KRAS mutations.
Our current study provides the first evidence in support of SIRT5 activation as a therapeutic strategy. We developed a novel first-in-class small-molecule SIRT5 activator, MC3138, which shows selectivity over SIRT1 and SIRT3. Furthermore, MC3138 synergized with gemcitabine in human PDAC cell lines, organoids, and PDX tumors with low SIRT5 expression. SIRT5 loss-mediated increase in pyrimidine nucleotide pools provides a potential mechanistic basis for the synergistic effect of the combination with gemcitabine. These results are in line with previous studies demonstrating that molecular competition with increased endogenous pyrimidine pools can outcompete pyrimidine analog gemcitabine and impart resistance30. Of note, the toxicity assays indicated MC3138 combined with gemcitabine was well tolerated in mice. These results demonstrate that MC3138 combined with gemcitabine can be a safe and effective therapeutic option for PDAC with low SIRT5 expression.
In conclusion, our study identifies a vital role SIRT5 plays in regulating glutamine/glutathione metabolism during the initiation and progression of PDAC. Moreover, our data indicate a synergistic effect of the small-molecule SIRT5-activator MC3138 combined with gemcitabine in human PDAC organoids and PDX models. As such, these findings shed new light on the potential use of SIRT5 activation as a novel therapeutic strategy for PDAC patients with decreased SIRT5 expression.
Supplementary Material
WHAT YOU NEED TO KNOW.
BACKGROUND AND CONTEXT
PDAC cells with activating KRAS mutations utilize glutamine in a non-canonical way via the GOT2-GOT1-ME1 pathway. SIRT5 has pleiotropic roles, serving as an oncogene and tumor suppressor in different cancers.
NEW FINDINGS
SIRT5 is a novel tumor suppressor for pancreatic cancer and genetically targeting SIRT5 makes PDAC tumors more aggressive.
SIRT5 negatively regulates non-canonical glutamine metabolism via direct post-translational modifications of GOT1.
Activation of SIRT5 with a novel small molecule is a potential new therapy for PDAC with low SIRT5 levels.
LIMITATIONS
This study was conducted in PDAC cell lines, genetically-engineered mice models, human tissue samples (tissue microarrays, PDAC organoids, and patient-derived xenografts). More work needs to be done in human patients.
IMPACT
SIRT5 activation (small-molecule SIRT5-activator MC3138) combined with gemcitabine may lead to a novel safe and effective therapy for PDAC patients with low tumoral SIRT5 expression.
ACKNOWLEDGMENTS:
A part of Tuo Hu’s stipend was supported by the China Scholarship Council (CSC) program.
Funding:
This work was supported in part by the funding from National Institutes of Health (R01 CA216853, R01CA210439, R01CA163649, and P01 CA2117798, NCI) to PKS, (SPORE, 2P50 CA127297, NCI) to PKS, the Italian AIRC 2016 (n. 19162) to AM, and (P30 CA036727, NCI) for supporting shared resources.
Study Sponsor Note:
The study sponsors are listed in the acknowledgement section and they had no role in the study design in the collection, analysis, and interpretation of data.
Footnotes
Publisher's Disclaimer: This is a PDF file of an unedited manuscript that has been accepted for publication. As a service to our customers we are providing this early version of the manuscript. The manuscript will undergo copyediting, typesetting, and review of the resulting proof before it is published in its final form. Please note that during the production process errors may be discovered which could affect the content, and all legal disclaimers that apply to the journal pertain.
Conflict of Interest: The authors declare no conflict of interest
References:
- 1.Derle A, De Santis MC, Gozzelino L, et al. The role of metabolic adaptation to nutrient stress in pancreatic cancer. Cell Stress 2018;2:332–339. [DOI] [PMC free article] [PubMed] [Google Scholar]
- 2.Vernucci E, Abrego J, Gunda V, et al. Metabolic Alterations in Pancreatic Cancer Progression. Cancers (Basel) 2019;12. [DOI] [PMC free article] [PubMed] [Google Scholar]
- 3.Chaika NV, Yu F, Purohit V, et al. Differential expression of metabolic genes in tumor and stromal components of primary and metastatic loci in pancreatic adenocarcinoma. PLoS One 2012;7:e32996. [DOI] [PMC free article] [PubMed] [Google Scholar]
- 4.Gebregiworgis T, Purohit V, Shukla SK, et al. Glucose Limitation Alters Glutamine Metabolism in MUC1-Overexpressing Pancreatic Cancer Cells. J Proteome Res 2017;16:3536–3546. [DOI] [PMC free article] [PubMed] [Google Scholar]
- 5.Son J, Lyssiotis CA, Ying H, et al. Glutamine supports pancreatic cancer growth through a KRAS-regulated metabolic pathway. Nature 2013;496:101–5. [DOI] [PMC free article] [PubMed] [Google Scholar]
- 6.Li M, Chiang YL, Lyssiotis CA, et al. Non-oncogene Addiction to SIRT3 Plays a Critical Role in Lymphomagenesis. Cancer Cell 2019;35:916–931 e9. [DOI] [PMC free article] [PubMed] [Google Scholar]
- 7.Winnik S, Auwerx J, Sinclair DA, et al. Protective effects of sirtuins in cardiovascular diseases: from bench to bedside. Eur Heart J 2015;36:3404–12. [DOI] [PMC free article] [PubMed] [Google Scholar]
- 8.Chalkiadaki A, Guarente L. The multifaceted functions of sirtuins in cancer. Nat Rev Cancer 2015;15:608–24. [DOI] [PubMed] [Google Scholar]
- 9.Matsushita N, Yonashiro R, Ogata Y, et al. Distinct regulation of mitochondrial localization and stability of two human Sirt5 isoforms. Genes Cells 2011;16:190–202. [DOI] [PubMed] [Google Scholar]
- 10.Park J, Chen Y, Tishkoff DX, et al. SIRT5-mediated lysine desuccinylation impacts diverse metabolic pathways. Mol Cell 2013;50:919–30. [DOI] [PMC free article] [PubMed] [Google Scholar]
- 11.Nishida Y, Rardin MJ, Carrico C, et al. SIRT5 Regulates both Cytosolic and Mitochondrial Protein Malonylation with Glycolysis as a Major Target. Mol Cell 2015;59:321–32. [DOI] [PMC free article] [PubMed] [Google Scholar]
- 12.Yang X, Wang Z, Li X, et al. SHMT2 Desuccinylation by SIRT5 Drives Cancer Cell Proliferation. Cancer Res 2018;78:372–386. [DOI] [PubMed] [Google Scholar]
- 13.Wang YQ, Wang HL, Xu J, et al. Sirtuin5 contributes to colorectal carcinogenesis by enhancing glutaminolysis in a deglutarylation-dependent manner. Nat Commun 2018;9:545. [DOI] [PMC free article] [PubMed] [Google Scholar]
- 14.Li F, He X, Ye D, et al. NADP(+)-IDH Mutations Promote Hypersuccinylation that Impairs Mitochondria Respiration and Induces Apoptosis Resistance. Mol Cell 2015;60:661–75. [DOI] [PubMed] [Google Scholar]
- 15.Chen XF, Tian MX, Sun RQ, et al. SIRT5 inhibits peroxisomal ACOX1 to prevent oxidative damage and is downregulated in liver cancer. EMBO Rep 2018;19. [DOI] [PMC free article] [PubMed] [Google Scholar]
- 16.Greene KS, Lukey MJ, Wang X, et al. SIRT5 stabilizes mitochondrial glutaminase and supports breast cancer tumorigenesis. Proc Natl Acad Sci U S A 2019. [DOI] [PMC free article] [PubMed] [Google Scholar]
- 17.Yan D, Franzini A, Pomicter AD, et al. Sirt5 Is a Druggable Metabolic Vulnerability in Acute Myeloid Leukemia. Blood Cancer Discov 2021;2:266–287. [DOI] [PMC free article] [PubMed] [Google Scholar]
- 18.Giblin W, Bringman-Rodenbarger L, Guo AH, et al. The deacylase SIRT5 supports melanoma viability by influencing chromatin dynamics. J Clin Invest 2021;131. [DOI] [PMC free article] [PubMed] [Google Scholar]
- 19.Abril YLN, Fernandez IR, Hong JY, et al. Pharmacological and genetic perturbation establish SIRT5 as a promising target in breast cancer. Oncogene 2021;40:1644–1658. [DOI] [PMC free article] [PubMed] [Google Scholar]
- 20.Hingorani SR, Petricoin EF, Maitra A, et al. Preinvasive and invasive ductal pancreatic cancer and its early detection in the mouse. Cancer Cell 2003;4:437–50. [DOI] [PubMed] [Google Scholar]
- 21.Olive KP, Tuveson DA, Ruhe ZC, et al. Mutant p53 gain of function in two mouse models of Li-Fraumeni syndrome. Cell 2004;119:847–60. [DOI] [PubMed] [Google Scholar]
- 22.Du J, Zhou Y, Su X, et al. Sirt5 is a NAD-dependent protein lysine demalonylase and desuccinylase. Science 2011;334:806–9. [DOI] [PMC free article] [PubMed] [Google Scholar]
- 23.Dasgupta A, Shukla SK, Vernucci E, et al. SIRT1-NOX4 signaling axis regulates cancer cachexia. J Exp Med 2020;217. [DOI] [PMC free article] [PubMed] [Google Scholar]
- 24.Strobel O, Dor Y, Alsina J, et al. In vivo lineage tracing defines the role of acinar-to-ductal transdifferentiation in inflammatory ductal metaplasia. Gastroenterology 2007;133:1999–2009. [DOI] [PMC free article] [PubMed] [Google Scholar]
- 25.Nakagawa T, Lomb DJ, Haigis MC, et al. SIRT5 Deacetylates carbamoyl phosphate synthetase 1 and regulates the urea cycle. Cell 2009;137:560–70. [DOI] [PMC free article] [PubMed] [Google Scholar]
- 26.Rardin MJ, He W, Nishida Y, et al. SIRT5 regulates the mitochondrial lysine succinylome and metabolic networks. Cell Metab 2013;18:920–33. [DOI] [PMC free article] [PubMed] [Google Scholar]
- 27.Sadhukhan S, Liu X, Ryu D, et al. Metabolomics-assisted proteomics identifies succinylation and SIRT5 as important regulators of cardiac function. Proc Natl Acad Sci U S A 2016;113:4320–5. [DOI] [PMC free article] [PubMed] [Google Scholar]
- 28.Zhou L, Wang F, Sun R, et al. SIRT5 promotes IDH2 desuccinylation and G6PD deglutarylation to enhance cellular antioxidant defense. EMBO Rep 2016;17:811–22. [DOI] [PMC free article] [PubMed] [Google Scholar]
- 29.Schwer B, Bunkenborg J, Verdin RO, et al. Reversible lysine acetylation controls the activity of the mitochondrial enzyme acetyl-CoA synthetase 2. Proc Natl Acad Sci U S A 2006;103:10224–10229. [DOI] [PMC free article] [PubMed] [Google Scholar]
- 30.Shukla SK, Purohit V, Mehla K, et al. MUC1 and HIF-1alpha Signaling Crosstalk Induces Anabolic Glucose Metabolism to Impart Gemcitabine Resistance to Pancreatic Cancer. Cancer Cell 2017;32:71–87 e7. [DOI] [PMC free article] [PubMed] [Google Scholar]
- 31.Abrego J, Gunda V, Vernucci E, et al. GOT1-mediated anaplerotic glutamine metabolism regulates chronic acidosis stress in pancreatic cancer cells. Cancer Lett 2017;400:37–46. [DOI] [PMC free article] [PubMed] [Google Scholar]
- 32.Korangath P, Teo WW, Sadik H, et al. Targeting Glutamine Metabolism in Breast Cancer with Aminooxyacetate. Clin Cancer Res 2015;21:3263–73. [DOI] [PMC free article] [PubMed] [Google Scholar]
- 33.Hao Y, Samuels Y, Li Q, et al. Oncogenic PIK3CA mutations reprogram glutamine metabolism in colorectal cancer. Nat Commun 2016;7:11971. [DOI] [PMC free article] [PubMed] [Google Scholar]
- 34.Yang H, Zhou L, Shi Q, et al. SIRT3-dependent GOT2 acetylation status affects the malate-aspartate NADH shuttle activity and pancreatic tumor growth. EMBO J 2015;34:1110–25. [DOI] [PMC free article] [PubMed] [Google Scholar]
Associated Data
This section collects any data citations, data availability statements, or supplementary materials included in this article.