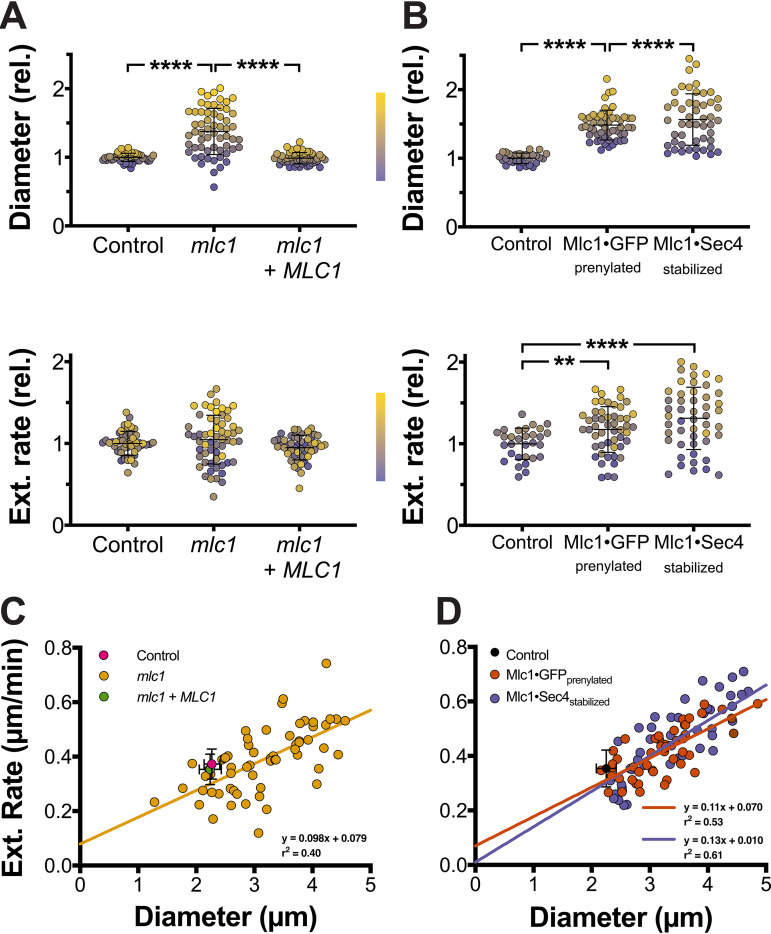
FIG 8.
The Spitzenkörper is a critical regulator of filamentous growth. (A) The myosin light chain is required for maintaining filament diameter and extension rate. Filament diameters (top) and extension rates (bottom) were determined from time-lapse experiments as described in the legend to Fig. 1A. Diameters are the averages of values measured every 5 to 10 min over a 120-min time-lapse experiment, and extension rates are from linear fits of filament length over at least 60 min (r2 > 0.9). Diameters were normalized to the control strain mlc1Δ/MLC1, which had a mean value of 2.3 ± 0.1 μm. Extension rates were normalized to the control strain mlc1Δ/MLC1 mean value of 0.37 ± 0.06 μm/min. Values were sorted by filament diameter and color coded with a color gradient from purple (smallest diameter) to yellow (largest diameter) for each strain (Lookup Table [LUT], center). Values are means (horizontal lines) ± standard deviations (error bars) (n = 50 to 60 cells), with **** indicating a P value of <0.0001. (B) Perturbation of Mlc1 distribution or stability dramatically increases growth rate. (A and B) Diameters (top) and extension (Ext.) rates (bottom) were quantitated and represented as described in the legend to Fig. 4A. They were normalized to the mean values of the wild-type control strain, 2.2 ± 0.2 μm and 0.35 ± 0.07 μm/min, respectively. Values are means (horizontal lines) ± standard deviations (error bars) (n = 30 to 50 cells), with ** and **** indicating P values of <0.005 and <0.0001, respectively. (C) In the absence of Mlc1, there is direct correlation between filament diameter and extension rate. Values from Fig. 4A were plotted with means and standard deviations for the two control strains (magenta and green circles) and values for each mlc1 cell are shown in yellow. (D) Perturbation of Mlc1 distribution or stability also results in a direct correlation between filament diameter and extension rate. Values from Fig. 4B were plotted with the mean and standard deviation for the control strain (black circle) and values for each Mlc1·GFP prenylated or Mlc1·Sec4 -stabilized cell in red and blue, respectively.

