

Abstract
Computational modeling is of growing importance in orthopedics and biomechanics as a tool to understand differences in pathology and predict outcomes from surgical interventions. However, the computational models of the knee have historically relied on in vitro data to create and calibrate model material properties due to the unavailability of accurate in vivo data. This work demonstrates the design and use of a custom device to quantify anterior-posterior (AP) and internal-external (IE) in vivo knee laxity, with an accuracy similar to existing in vitro methods. The device uses high-speed stereo radiography (HSSR) tracking techniques to accurately measure the resulting displacements of the femur, tibia, and patella bones during knee laxity assessment at multiple loads and knee flexion angles. The accuracy of the knee laxity apparatus was determined by comparing laxity data from two cadaveric specimens between the knee laxity apparatus and an existing in vitro robotic knee joint simulator. The accuracy of the knee laxity apparatus was within 1 mm (0.04 in.) for AP and 2.5 deg for IE. Additionally, two living subjects completed knee laxity testing to confirm the laboratory use of the novel apparatus. This work demonstrates the ability to use custom devices in HSSR to collect accurate data, in vivo, for calibration of computational models.
Introduction
Technological advancements in orthopedics are enabling personalized surgical plans, guides, and implants with improved results compared to traditional surgical approaches [1–3]. Personalized medicine in orthopedics has created a surge in interest in advanced computational models to aid in the design and decision-making of surgical interventions and better understand the underlying differences between asymptomatic and symptomatic populations. Clinically, these models provide useful information for a range of predictions of ligament, joint, and muscle loads, which are useful in models of pathology and repair. However, the accuracy of these models depends on the accuracy of the data used to calibrate their properties. Additionally, many models are calibrated to data that describes the average behavior of populations instead of measurements from the individual they describe.
Realistic computational models of how the knee moves in response to applied loads require calibrations to experimental load–displacement data to determine the parameters of the knee ligaments, such as ligament stiffness, slack length, and attachment sites [4–11]. Since these parameters cannot be accurately measured in vivo, a common method to calibrate these parameters in knee models is to match the behavior of the knee model with experimental measurements of the nonlinear force–displacement or “laxity” characteristics of the knee under various loads and knee flexion angles [12]. Whereby, the laxity is measured as the translation or rotation of the tibia relative to the femur under a known load, often in a single degree-of-freedom (DOF) [12–15].
After laxity measurements are made, they can be used to calibrate subject-specific computational models of the knee [16]. This calibration process has been previously described in work by Harris et al., Erdemir et al., and others but is summarized here [5,16,17]. Subject-specific geometry from magnetic resonance imaging (MRI) or computed tomography (CT) imaging is used to create bone and tissue geometries of the knee, including ligament models with approximate attachment sites. Because ligament geometry and material properties cannot be accurately measured in vivo, researchers use measurements of tibiofemoral load–displacement, or laxity, to calibrate the modeled ligaments, with initial material properties frequently based on values reported in the literature. In order for the model to behave like the knee of the specific subject, ligament material properties and attachment sites are adjusted in the model until the displacement of the tibia relative to the femur in response to an applied load matches the measured response of the subject's knee to the same applied load. While this might be done using manual adjustments, more frequently the measured laxity/force–displacement curves for multiple DOF at different flexion/extension angles are discretized to create target data points for use in global optimization. A cost function is created to minimize the difference in the displacement of the tibia relative to the femur between the simulated model displacement and the measured displacement from the experiment. In the optimization, loads are applied to the knee model to simulate the laxity experiment at different target data points, and global optimization techniques, such as simulated annealing, vary the properties of each of the ligaments simultaneously (e.g., slack lengths, stiffnesses, and attachment sites). This is repeated until the cost function reaches a minimum, corresponding to the displacement of the computational model and experimental laxity data matching at each target data point. The end results of the optimization are calibrated ligament parameters matching the passive properties of the subject-specific knee to applied external loads. The value of the knee laxity apparatus presented here is that it can be used to provide the target load–displacement measurements for knee model calibration.
For this study, in vivo measurements shall refer to noninvasive measurements made on living subjects, while in vitro testing shall refer to measurements made using invasive methods on cadaveric specimens. Calibration of computational models is most frequently done using the steps previously stated, whether the data came from in vitro or in vivo measurements. However, models of the knee are most frequently calibrated with average in vitro measurements, as there are few practical ways to apply loads to or measure the displacement of the tibia relative to the femur accurately in vivo [8–20]. In addition, in vivo laxity assessments differ in magnitude between sedated and nonsedated patients [13] due to differences in the contribution of muscle forces, therefore bringing into question the viability of modeling in vivo kinematics quantified from in vitro measurements. Nevertheless, the accuracy of subject-specific computational models will likely improve if they are calibrated using the target individuals' measurements. Thus, an accurate measurement of in vivo laxity is necessary to improve the accuracy of existing subject-specific computational models of the knee.
While in vitro measurements utilize load cells and markers rigidly attached to the bones to make accurate laxity assessments, in vivo measurements are limited to noninvasive methods. Prior noninvasive methods have primarily been limited to force–displacement measurements using surface-based instruments that yield poor accuracy due to soft-tissue deformation [5,13,21–23]. Recent work has used more accurate means of bone displacement measurement, including dynamic MRI and fluoroscopy, to record the displacements of the bones without relying on surface-based measurements [24–30]. However, to the authors' knowledge, no device exists that has been validated for in vivo use that utilizes high-accuracy bone imaging methods while being capable of making both anterior-posterior (AP) and internal-external (IE) laxity measurements over a range of knee flexion angle critical for accurate knee model calibration. In particular, the measurements from AP laxity can be used to calibrate the cruciate ligaments, and the measurements from IE laxity are used to calibrate the collateral ligaments [5].
In this work, we present and demonstrate a novel apparatus capable of making AP and IE laxity measurements in vivo using high-speed stereo radiography (HSSR), with an accuracy similar to existing in vitro methods. This supports our overall aim to accurately capture in vivo laxity measurements for future subject-specific computational model calibration of the knee. Using the novel apparatus, laxity measurements were made on two cadaveric specimens, and the results were compared to an in vitro measurement method [31] to assess the accuracy of the apparatus. Lastly, measurements were taken from two living subjects and compared to previous results from cadaveric specimens and living-subject testing to confirm the effectiveness and viability of the apparatus for its intended use of obtaining laxity measurements in vivo.
Methods
Knee Laxity Apparatus Design.
The knee laxity apparatus (Fig. 1) holds the limb in place and allows for AP and IE laxity tests to be performed at a range of loads and knee flexion angles. Additionally, the apparatus is made primarily of radiolucent materials, including Delrin and Acrylic, to maximize the transparency of the device in the captured radiographic images.
Fig. 1.

(Left) CAD geometry rendering of knee laxity apparatus in SolidWorks, (right) knee laxity apparatus testing setup on living subject performing right knee anterior laxity assessment at 30 degrees of knee flexion. Subject thigh rests against the adjustable thigh flexion pad (a), with the ankle of the subject in the orthopedic boot (b). Subject anthropometrics can be accounted for by moving the position of the vertical tower and the boot using thumb screws (c). Anterior laxity loads are applied via the pulleys at the top frame (d), and posterior loads are applied via the pulleys on the bottom frame (e). IE loads are applied via the IE torque wheel attached to the boot (f).
During measurements, the subject lies supine on a table with their hip flexed to allow their thigh to rest against a rubber pad (Fig. 1); the shank is supported on one side at the knee by the pad parallel to the ground, with the other side suspended by securing the ankle into a plastic orthopedic boot (Fig. 1). The knee flexion angle is adjusted by tilting the rubber pad and fixing it in place using a set of cotter pins and predrilled holes. The boot is attached to a vertical stage with slots and thumbscrews (Fig. 1) to allow for a wide range of subject anthropometric differences between the 5th percentile of smallest females to the 95th percentile of largest males according to limb length and size [32]. Together, these components require the subject to lie supine with their hip and knee flexed to the same angle, which causes the shank to be near parallel with the top and bottom of the laxity apparatus and thus ensures that AP loads are applied near perpendicular to the shank. Additionally, the boot is rigidly attached to a pulley with a bolt and bearings, colinear with the shank of the subject, thus allowing for pure IE torques to be applied to the subject's shank.
AP loads are applied to the knee by a cuff attached to the shank and then attached through a cable and pulley system to the top and bottom frames of the laxity apparatus (Fig. 1). Palpation is used to identify the tibial tuberosity, and a goniometer is used to align the cable attached to the top frame pulley perpendicular to the shank at the desired location of the tibial tuberosity. Similarly, a pulley on the base, below the knee, is aligned in the same manner for posterior load application. The thigh is firmly held in place using straps, and the foot is captured in the orthopedic boot in the vertical position. By removing a cotter pin in the boot, IE torques can be applied through a cable applying a torque to a pulley rigidly attached to the boot where the subject's foot and shank are secured (Fig. 1). Loads and torques are measured in real-time using a 100 kg DYMH-103 load cell (ATO, Diamond Bar, CA) in line with the corresponding pulley cable and measured at the point of attachment to the limb or IE pulley for AP and IE, respectively, to minimize errors from frictional losses in the pulleys. Static loads can be applied through a series of discrete weights or via a continuous dynamic load, which has previously been shown to yield different results [33,34].
A laxity measurement is made by recording the position of the tibia and femur before load application using two 12-bit grayscale, 1024 × 1024 pixel resolution stereo radiography images, and then recording the change in bone position after applying a known load to the tibia. Kinematics were measured using previously validated bone tracking techniques, combining HSSR with bone geometries obtained from CT or MRI. The tracking process is further described below. Additionally, while not used for data analysis in this study, the apparatus is built to allow for the simultaneous use of a Vantage and MX-T40S (Vicon, United Kingdom) optical motion capture system as well as a Noraxon DTS electromyography (EMG) sensors (Noraxon, Scottsdale, AZ) for comprehensive laxity assessment in vivo.
Cadaveric Testing.
The accuracy of the knee laxity apparatus was quantified via measurements made using cadaveric specimens in both the “in vivo” knee laxity apparatus setup as well as a conventional in vitro setup using a robotic knee joint simulator. The measurements were compared between each method to quantify the difference in reported knee displacements.
Cadaveric Laxity Testing in Knee Laxity Apparatus.
Two male pelvis-to-toes specimens (ages 64 and 29; BMI 17.8 and 32.1, respectively) were obtained for cadaveric testing. Each specimen was placed on a lift table with their knee brought into view of the HSSR system. The specimen was manually moved by hand through several cycles of a no-load joint flexion–extension range of motion (ROM) and then averaged to act as a baseline of the location of the knee at each flexion angle. Following this, the specimen was placed supine in the knee laxity apparatus in view of the HSSR. A series of straps were used to secure the thigh to the knee-flexion pad and another set of straps to secure the hips of the specimen to the hydraulic table. Additionally, the foot and ankle of the subject were secured into the orthopedic boot using a strap and built-in inflatable pads.
IE loads were applied to the specimen, as previously described, using tensile loads to the cable to apply a known torque to the boot. These IE loads were applied statically from 1.41 N*m (1.04 lbf*ft) up to 5.65 N*m (4.17 lbf*ft) in increments of 1.41 N*m (1.04 lbf*ft) and then continuously ramped from 0 N*m (0 lbf*ft) to 6 N*m (4.42 lbf*ft) through a ramp and hold trapezoidal wave profile [14,34]. Following this, AP loads were applied in discrete amounts from 44.5 N (10 lbf) up to 178 N (40 lbf) in increments of 44.5 N (10 lbf), followed by the same continuous ramp and hold profile as the IE loads up to 200 N (45 lbf) [13,21,34]. For the static measurements, the radiographs were taken within 10 s of the load being applied to the apparatus, while the radiographs for the continuous loading profiles were taken continuously at 50 fps. The left knee of each specimen was tested for all laxity measurements at 90 deg of knee flexion and then again at 30 deg of knee flexion to minimize the amount of time for tissue degradation.
Knee kinematics from the HSSR images are obtained by first segmenting bone geometries from specimen CT scans using Simpleware ScanIP (Synopsys, Mountain View, CA). Then Grood and Suntay (GS) coordinate systems are applied to the bones using the transepicondylar axis coordinate system [35,36]. The transepicondylar axis coordinate system was chosen because it has previously been shown to be both clinically easy to identify and align well with the actual functional flexion axis of the knee, making it popular in clinical settings to evaluate knee joint motion [37]. Following this, DSX (C-Motion, Germantown, MD) was used to place the femur, tibia, and patella bones in three-dimensional space through the captured bi-plane radiographs from the HSSR system using previously validated techniques with tracking inaccuracies less than 0.25 mm (0.0098 in.) and 1.0 deg for translation and rotational DOF, respectively [38,39]. In brief, these techniques use calibrated positions of the camera system and the bone geometries to manipulate the virtual bone position in three-dimensional space until the resulting two-dimensional projections of the bones onto each camera view create the resulting captured image. After initial manual alignment, DSX was used for the final optimization of the placement using an iterative simulated annealing optimization of 100,000 iterations to optimize the conditional entropy between the bone reconstruction Hounsfield unit gradient and the Hounsfield unit gradient of the radiographic images [40]. This procedure is repeated for the femur and tibia for every captured frame to obtain the relative transformations from one bone to another following the GS Joint Coordinate System convention [36].
Kinematics data were obtained using the bone transformations and a custom script in MATLAB ver. 2019 (MathWorks, Natick, MA). For each trial, the displacement was recorded as the net difference between the loaded kinematic position and passive kinematic position from the no-load motion. Force and torque data captured from the load cell were combined with the displacement data to create AP and IE laxity curves. The hysteresis in the loading and unloading portion of the continuous loading laxity curves was quantified using the minimum and maximum displacements at a given load across 14 discrete loads and calculating the root mean squared difference (RMSD) between the maximum and minimum at these loads.
Cadaveric Laxity Testing in Robotic Knee Joint Simulator.
Following the knee laxity apparatus measurements, the specimens were placed into a VIVO robotic knee joint simulator (AMTI, Watertown, MA) (Fig. 2) for comparison to the measurements made by the knee laxity apparatus. The specimen was dissected, leaving approximately 230 mm (9.05 in.) of the femur and 125 mm (4.92 in.) of the tibia from the approximate joint center and maintaining around 200 mm (7.87 in.) of soft tissue surrounding the knee intact, including approximately 102 mm (4 in.) of the quadriceps tendon. The knee was potted using polymethylmethacrylate and custom fixturing. A custom-designed linear actuator clamp was used to apply a 10 N (2.25 lbf) load through the quadriceps tendon parallel to the femur to simulate the passive tension in the extensor mechanism [41,42]. Matching the laxity apparatus experiment, a passive ROM was performed on the specimens to act as baseline knee kinematics. AP and IE laxity measurements were made using similar continuous loading profiles to those in the knee laxity apparatus testing and performed at flexion angles between 0 deg and 120 deg in 15 deg increments. The knee flexion angle was held constant during the trial, and the load in the DOF of interest was applied by following a trapezoidal load profile. The only external load was applied through the quadriceps mechanism, as previously described. All remaining DOF were set to maintain zero-load to allow for unconstrained movement. Kinematics were measured using the Optotrak Certus (Northern Digital Inc., Waterloo, ON, Canada) motion capture system using active markers rigidly affixed to the femur, tibia, patella, and the robotic system (Fig. 2). Optotrak motion was transformed using the same landmarks as the HSSR data to create kinematic data in the same GS coordinate system as previously described for the knee laxity apparatus testing. A six DOF load cell built into the VIVO system base was used to measure the applied loads. The kinematics and loads were then combined to create laxity curves using the same methods as previously described.
Fig. 2.
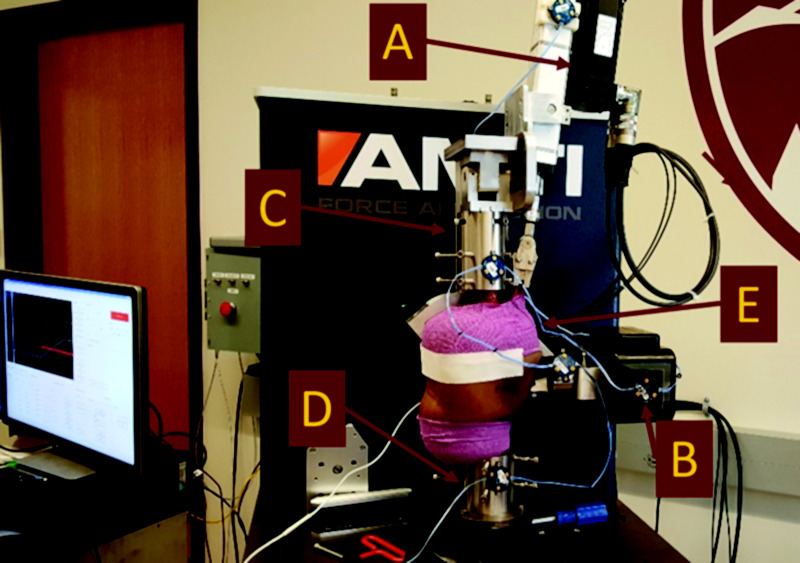
Sagittal view of robotic knee joint simulator setup in the AMTI VIVO, including custom quadriceps mechanism (a) for cadaveric laxity testing. The setup uses rigid body markers (b) fixed to the femur (c), the tibia (d) and the patella (e) for tracking during testing. The quadriceps mechanism, seen as the top actuator (a), is used to apply the passive tension to the patella (e).
Living Subject Testing.
Two male subjects (ages 51 and 73; BMI 31.5 and 26.7, respectively) provided informed consent and were recruited after approval by the Institutional Review Board of the University of Denver (IRB 472101-16). Prior to collecting laxity measurements, subjects performed isometric maximal voluntary contractions (MVC) for both extension and flexion of the knee at approximately 70 deg of knee flexion. Repeated MVCs were performed to reduce maximal force production in an attempt to reduce passive muscle tone and prevent increased muscle activation during laxity assessment [13,15].
The subjects were placed in the knee laxity apparatus at a 30 deg knee flexion angle (Fig. 1). Proprioceptive neuromuscular facilitation (PNF) was used to limit further passive-muscle tone, where subjects were instructed to first apply resistance against the applied load and then relax into the load, as this has been shown to increase ROM of various joints [43]. After the subjects felt they had wholly relaxed into the weight, the trial was captured using single frame stereo radiographs. Following previous work in living participants, anterior laxity loads were applied to the subject up to 178 N (40 lbf) using discrete static weights [21,34,44]. Due to time and radiation exposure constraints of the larger, overarching study that the subjects participated in, posterior loads were not performed. The knee laxity apparatus was then reconfigured for IE laxity. Again following previous work, loads were applied to the knees at discrete static loads up to 6 N*m (4.42 ft*lbf) [14,34,44]. The subjects expressed little to no discomfort with the testing procedures. Data for the trials was tracked using the same HSSR tracking process, as previously stated. Laxity plots were made in the same format as before by calculating the displacement at an applied load relative to the no-load joint kinematic position.
Results
Knee Laxity Apparatus Versus Robotic Knee Joint Simulator Cadaveric Specimen.
The maximum difference in total AP displacement for both cadaveric specimens (Fig. 3(a)) was found to be less than 1 mm (0.04 in.) between the laxity apparatus measurement and the robotic knee measurement (Table 1). In addition, the maximum difference in total IE displacements (Fig. 3(b)) was found to be less than 2.5 deg between the laxity apparatus measurement and the robotic knee measurement (Table 1). These differences in maximum total displacement, as a percentage of the total sum of the total displacement for AP and IE for the given specimen, were 7.8% for AP and 8.1% for IE, with both maximums occurring in Specimen 2. Additionally, the RMSD between the knee laxity apparatus using the static measurements versus the corresponding values for the robotic knee joint simulator was 0.42 mm (0.02 in.) for AP and 1.34 deg for IE (Table 2).
Fig. 3.

(a) Knee laxity apparatus versus robotic knee joint simulator AP Laxity for specimen 1 left at 30 deg of knee flexion. (b) Knee laxity apparatus versus robotic knee joint simulator IE laxity for specimen 1 left at 30 deg of knee flexion. The x-axis represents the total displacement or rotation, and the y-axis is the corresponding applied load or torque for AP and IE, respectively. Plots represent data from a single specimen, at 30 deg of knee flexion in the robotic knee joint simulator, compared with the continuous and static loading curves in the knee laxity apparatus. The behavior shown was similar for the other specimen and the 90 deg knee flexion angle.
Table 1.
Total laxity displacement for specimen testing at 30 deg of knee flexion at maximal load
| Knee laxity apparatus specimen #1 | Robotic knee tester specimen #1 | Knee laxity apparatus specimen #2 | Robotic knee tester specimen #2 | |
|---|---|---|---|---|
| Anterior (mm) | 5.80 | 5.30 | 7.60 | 6.90 |
| Posterior (mm) | N/A | −4.20 | −6.60 | −5.90 |
| External (deg) | 16.40 | 18.20 | 17.80 | 15.80 |
| Internal (deg) | −17.40 | −19.70 | −17.30 | −14.90 |
Table 2.
AP and IE laxity errors for cadaveric specimen 1 and cadaveric specimen 2 for static/discrete knee laxity apparatus measurements versus AMTI VIVO robotic knee joint simulator
| AP laxity (mm) | IE laxity (deg) | |
|---|---|---|
| Maximum | 0.73 | 2.50 |
| RMS | 0.42 | 1.34 |
| Mean | 0.35 | 0.94 |
| Standard Dev | 0.26 | 1.02 |
The continuous laxity measurements for the cadaveric specimens (Fig. 4) show increases in the maximum anterior laxity at 200 N (45 lbf) from 90 deg to 30 deg of knee flexion of 3 mm (0.12 in.) and 2.3 mm (0.09 in.) for the knee laxity apparatus compared to the robotic knee joint simulator. However, for both specimens, the hysteresis of the laxity curves in the majority of cases was larger in the knee laxity apparatus compared with the robotic joint (Fig. 4 and Table 3).
Fig. 4.

Graph of specimen 2 left knee continuous anterior laxity of knee laxity apparatus versus robotic knee joint simulator at 30 deg and 90 deg of knee flexion. The behavior shown was similar for the other specimen and the other DOF.
Table 3.
Measured RMSD of laxity hysteresis for specimen testing
| AP root mean square difference (mm) | IE root mean square difference (deg) | |||
|---|---|---|---|---|
| Specimen #1 | Specimen #2 | Specimen #1 | Specimen #2 | |
| Knee Laxity | 2.77 | 1.60 | 6.39 | 2.95 |
| Robotic Knee | 0.41 | 0.98 | 2.65 | 3.57 |
Cadaveric Specimen and Living Subject Testing Versus Literature.
AP and IE static, discrete displacements are within ±2 standard deviations of literature reported average laxity values for AP and IE at each applied load, for both living subject testing and cadaveric testing (Figs. 5(a) and 5(b)) [34,44].
Fig. 5.
![(a) AP laxity curves for knee laxity apparatus compared to Markolf et al. at 30 deg of knee flexion [33]. (b) IE laxity curves for knee laxity apparatus compared to Markolf et al. at 30 deg of knee flexion [24]. The x-axis represents the resulting displacement and rotation from the applied load or torque on the y-axis for AP and IE, respectively. The shaded green region represents the ±1 standard deviation of displacement or rotation at a given load or torque from Markolf et al.](https://cdn.ncbi.nlm.nih.gov/pmc/blobs/fe8e/8546959/d4c3e62c3d65/med-20-1204_041004_g005.jpg)
(a) AP laxity curves for knee laxity apparatus compared to Markolf et al. at 30 deg of knee flexion [33]. (b) IE laxity curves for knee laxity apparatus compared to Markolf et al. at 30 deg of knee flexion [24]. The x-axis represents the resulting displacement and rotation from the applied load or torque on the y-axis for AP and IE, respectively. The shaded green region represents the ±1 standard deviation of displacement or rotation at a given load or torque from Markolf et al.
Maximum displacement values from the subjects and cadaveric testing were compared to other literature at 100 N (22.5 lbf) of anterior load and 3 N*m (2.21 ft*lbf) of internal load (Figs. 6(a) and 6(b), respectively) for both the knee laxity apparatus and robotic knee simulator [13,14,21,25,27,34,44–46]. The values for the anterior displacement at 100 N (22.5 lbf) for the cadaveric specimens were approximately 1 mm (0.04 in.) higher than the average displacement of around 3 mm (0.12 in.) but were all within ±2 standard deviations. Similarly, for the 3 N*m (2.21 ft*lbf) internal torque, the cadaveric specimens were within 2 deg of the 13 deg average internal rotation and all within ±1 standard deviations of the study by Markolf et al., but the total internal rotations were more than 7 deg lower than those measured by Blankevoort et al. [14,34]. The displacements for the living subjects in the anterior DOF at 100 N (22.5 lbf) were 2 mm (0.08 in.) and 0.5 mm (0.02 in.), and for the internal DOF at 3 N*m (2.21 ft*lbf) were 12 deg and 13 deg, for each subject, respectively. Notably, these values were within 1 mm (0.04 in.) for the anterior DOF and 2 deg for the internal DOF of another living subject study, but more than 6 mm (0.24 in.) and 9 deg different of another study for each measurement, respectively.
Fig. 6.
![(a) Total anterior displacement from submaximal 100 N (22.5 lbf) of applied anterior load of cadaveric testing and living subject testing versus literature [13,14,17,24,33,35]. (b) Total internal rotation from submaximal 3 N*m (2.21 ft*lbf) of applied internal torque versus literature [19,24,27,36]. Bars on the left are from cadaveric testing performed in this study versus previous studies performed on cadavers, while bars on the right are of living subject testing compared to other living subject laxity studies. Each literature bar represents the reported average values, and the black error bars represent ±1 standard deviation when reported for that study.](https://cdn.ncbi.nlm.nih.gov/pmc/blobs/fe8e/8546959/82c783a1759f/med-20-1204_041004_g006.jpg)
(a) Total anterior displacement from submaximal 100 N (22.5 lbf) of applied anterior load of cadaveric testing and living subject testing versus literature [13,14,17,24,33,35]. (b) Total internal rotation from submaximal 3 N*m (2.21 ft*lbf) of applied internal torque versus literature [19,24,27,36]. Bars on the left are from cadaveric testing performed in this study versus previous studies performed on cadavers, while bars on the right are of living subject testing compared to other living subject laxity studies. Each literature bar represents the reported average values, and the black error bars represent ±1 standard deviation when reported for that study.
Discussion
Previous knee laxity devices have, in general, fit into two categories: 1. Devices that use high accuracies displacement measurements such as fluoroscopy or MRI but are limited to measuring a single DOF at a single knee flexion angle, 2. Devices that can determine laxity at multiple DOF and knee flexion angles but rely on inaccurate surface-based displacement measurements. This study has introduced a novel apparatus that can apply AP and IE DOF loads to the knee at a range of knee flexion angles for measuring in vivo knee laxity using high accuracy stereo radiography. Additionally, the apparatus was used on two living subjects to show its viability for in vivo testing.
The validation of the apparatus compared the laxity measurements of two cadaveric specimens between the data obtained from the knee laxity apparatus and the data collected from a robotic knee joint simulator. The AP and IE displacements measured using the knee laxity apparatus were comparable to the displacements measured during in vitro testing at the maximum loads applied. The maximum errors between the robotic knee joint simulator and the knee laxity apparatus were used to report an accuracy of the knee laxity apparatus of within 1 mm (0.093 in.) for AP and 2.5 deg for IE. In addition, the total displacements measured were similar to ranges reported previously in literature for knee laxity measurements [13,14,34,44]. These results suggest that the knee laxity apparatus is capable of making accurate measurements for total displacements at clinically relevant loads [13,21]. The anterior displacement measurements of 5.3 mm (0.21 in.) and 6.9 mm (0.27 in.) made at the maximum anterior loads are in agreement with previous work using the KT1000 arthrometer, where the anterior displacement was found to have a mean and standard deviation displacement of 7.2 mm (0.28 in.) and 1.9 mm (0.07 in.), respectively [13]. Additionally, the values recorded using the knee laxity apparatus were similar to the means and standard deviations reported in the literature using similar technology (Figs. 6(a) and 6(b)).
While the continuous and static measurements had similar laxity at the maximum loads, the continuous laxity curves for the knee laxity apparatus compared poorly to the to the robotic knee joint simulator. In particular, the knee laxity apparatus produced larger hysteresis values than the laxity measurements obtained from the robotic knee joint simulator. This increased hysteresis can most readily be seen in Fig. 4, wherein the continuous laxity measurements obtained with the robotic knee joint simulator follow results presented in previous work [25]. In addition, the knee laxity apparatus produced curves with shifted force–displacement profiles between subsequent cycles. The poor performance of continuous load measurements with the knee laxity device is likely the result of discrepancies in control of the loads applied to the knee from the knee laxity apparatus compared to the robotic knee joint simulator. The knee laxity apparatus applies the loads to the surface of the segment, resulting in higher variability in the direction of the load application as a result of muscle and other soft tissue deformation [27]. This can cause the laxity to not follow the same path during repeated loading and unloading cycles because the loads in the other DOF may not be consistent between cycles. In contrast, the bones are rigidly fixed to the robotic mechanism when using the robotic-knee joint simulator, and the loads are directly applied to the bones using a controller. This means that the robotic laxity test can apply loads purely in a single DOF while leaving the others free, resulting in a more consistent load between cycles. These discrepancies in load application between the in vitro and in vivo testing highlight the importance of accurate load application in all DOF, particularly when observing time-varying force–displacement behavior, such as those measured in the continuous laxity measurements with the knee laxity apparatus [14]. It also suggests that for future studies that aim to quantify nonlinear time-dependent properties – such as stress relaxation, creep, and hysteresis – accurate force application in all DOF will be crucial.
The displacements recorded during static, discrete loads using the knee laxity apparatus have much higher accuracy relative to the robotic knee joint simulator compared with the continuous loading (Figs. 3(a) and 3(b)). The errors shown in Table 2 are small and emphasize that when using the static measurements, the knee laxity apparatus has a difference in measurement within 1 mm (0.04 in.) for AP and 2.5 deg for IE. This is an appealing result since the static loads result in greatly reduced radiation exposure compared with continuous dynamic trials, making them the preferred option for in vivo subject testing. For this reason, discrete loads were used for testing on the two living subjects, which likely provided a more accurate result than if a continuous loading profile had been applied.
The in vivo subject testing confirmed the utility of the knee laxity apparatus for its intended use on living subjects. Two subjects were subjected to anterior and IE load sets, and the resulting measurements (Figs. 5(a) and 5(b)), were within the standard deviations previously reported by Markolf et al. [34,44] and similar to our in vitro results. This confirms that the knee laxity apparatus can make safe and accurate in vivo knee laxity measurements on subjects without subject discomfort.
Additionally, the recorded anterior displacements using living subjects are close to the values reported by Kupper et al., who used a loading apparatus and dynamic MRI as the means of measuring the displacements [25]. However, these results reported a smaller displacement than those reported in Daniel et al. and Rangger et al. [13,21]; notably, these studies used surface-based measurements with the KT1000, which overestimate measured bone displacements of individuals [26]. These comparisons support the need for accurate bone-displacement measurements in laxity assessment, which tend to be overestimated using surface measurements [47].
Furthermore, the anterior displacements for the living subject testing were less than the cadaveric testing. This is likely a result of muscle guarding that has been reported previously [13,25,48], illustrating the effect of muscle activity on knee laxity measurements. In particular, passive hamstring activation can act to reduce the amount of displacement of the knee joint from an applied load, particularly in the anterior direction [49,50]. To better control for muscle guarding, future studies could use EMG sensors on living subjects to quantify the relative activation of agonist and antagonist muscle groups during the laxity assessment. Muscle activation data could further explain the underlying differences present between the cadaveric specimens and living subjects.
Internal rotation of the living subjects is similar to the values from Shultz et al. (Fig. 6(b)), which used a modified version of the Vermont Knee Laxity Device to assess the laxity in living subjects [46,51]. These values are also comparable to the values for the cadaveric laxity measurements, which further suggests that the muscle guarding effects are more prominent in the AP laxity assessment when compared with the IE laxity assessments. Of note, the values reported in Moewis et al. are lower than the values reported for all cadaveric specimens and living-subject testing reported from other literature [27]. The Moewis et al. study only used continuous measurements, which further supports the observation made in this study that the continuous measurements tend to be less accurate compared to the discrete static (Figs. 3(a), 3(b), 4, and Table 3). Blankevoort et al. theorized this to be a result of the “envelope” of passive motion wherein the exact motion pathway of the knee is highly dependent on the loads in the other DOF and the specific loads in the actual DOF [14]. As such, continuous loads are likely being applied less accurately compared with the static, discrete loads, yielding the resulting discrepancy.
A limitation of the study is the small sample size: two cadavers and two subjects. Future testing with a greater number of specimens could provide more confidence in the reliability and accuracy of the knee laxity apparatus for in vivo testing. A two-sided matched-pairs t-test power analysis with a power of 0.8 and an alpha of 0.05 was performed with the results – particularly the mean and standard deviations of the magnitude of the errors between the robotic knee joint simulator and the knee-apparatus testing on the cadaveric specimens. The power analysis suggests that three samples are needed for the reported AP accuracy of 1 mm (0.04 in.), while five samples would be needed to predict accuracy of 0.5 mm (0.02 in.). For the reported IE accuracy of 2.5 deg, the number of samples is predicted to be four, while five samples would be needed for an accuracy of 2 deg. Future testing should also account for sex differences as females tend to have greater knee laxity compared to males [52–56].
Another related limitation is that repeated measures were not performed for the laxity assessment for both the cadavers and the living subjects. For the cadavers, repeated measures were not performed during the knee laxity apparatus testing because of the observed fast tissue degradation rate. Since the tissue was not frozen or preserved before or during testing, there was concern that the material properties of the tissues in the knee would degrade between the two testing sessions: in vitro and in vivo. Additionally, repeated measures of the living subjects were not performed because of subject radiation exposure and time constraints of the larger overarching study in which the subjects participated. As such, the repeatability of the knee laxity apparatus has not been quantified. However, current testing on a larger cohort of living subjects aims to address this by performing repeated measures of all maximum loads at each DOF and knee flexion angle for both legs to quantify the repeatability of the device.
Another limitation of the study was the accuracy of the tracking of the bones in HSSR, which is based on the clarity of the acquired images. While the object tracking process in ideal cases has been shown to have a submillimeter accuracy, the accuracy in tracking of the bones is dependent on the final quality of the radiographic images. In particular, higher-quality images could further improve the accuracy of the knee laxity apparatus beyond the reported accuracy. This study attempted to further improve overall tracking accuracy by utilizing an adaptive simulated annealing optimization routine in DSX (C-motion, Germantown, MD) [40].
The final limitation discussed here is that muscle guarding by the living subjects may have influenced the laxity measurements. This study attempted to minimize muscle guarding through PNF, but it is impossible to remove the potential for muscle contribution entirely. This muscle contribution likely diminished the measured laxity of the knee in the living subjects compared to the ideal measurement with no muscle activation. Future work using the knee laxity apparatus on living subjects will include the use of six EMGs per leg, located at the major muscle groups spanning the knee. These EMGs will allow the use of the MVCs performed by the subject, prior to knee laxity, to be used as a means to quantify the maximum activation for the extensors and flexors of the knee. These values can then be used during the knee laxity assessment as a real-time indicator of the level of activation in the muscle groups. Recording of laxity measurements can be paused until there is a noticeable relaxation of the subject into the current measurement. Additionally, after capture, the EMG data can be used to estimate the force produced in the muscles during the laxity measurement. Together with subject-specific model geometry, EMG force data could be used to offset the influence of muscle forces for calibration of the passive knee properties. The EMG data could also be used to explain significant differences in laxity between subjects, such as the differences observed herein between the two living subjects.
In summary, this study described and validated the use of a knee laxity-apparatus during in vivo AP and IE laxity assessment, with accuracies similar to existing in vitro testing methods. This was accomplished by quantifying and using relative boney displacement as a proxy for joint laxity with HSSR techniques. Validation was performed by comparing displacements measured using the knee laxity apparatus to displacements measured with a robotic knee joint simulator; with static measurements in an agreement between the two devices, while continuous measurements showed some distinct differences in the shapes of the curves. Additional testing on living subjects safely and effectively demonstrated the intended use of the knee laxity apparatus for in vivo testing. The apparatus and underlying data provide a mechanism and workflow to calibrate subject-specific joint laxity for computational modeling and may enable future technology to better quantify clinically relevant measurements beyond knee laxity to improve assessment of the underlying pathologies.
Acknowledgment
The authors would like to thank Stormy Hegg and Ryan Knowles for their contributions in the processing of the HSSR trials.
Funding Data
NIH National Institute of Arthritis and Musculoskeletal and Skin Diseases, National Institute of Biomedical Imaging and Bioengineering, and the National Institute of Child Health and Human Development (Grant No. U01 AR072989; Funder ID: 10.13039/100000069).
References
- [1]. Ng, V. Y. , DeClaire, J. H. , Berend, K. R. , Gulick, B. C. , and Lombardi, A. V. , 2012, “ Improved Accuracy of Alignment With Patient-Specific Positioning Guides Compared With Manual Instrumentation in TKA,” Clin. Orthop. Relat. Res., 470(1), pp. 99–107. 10.1007/s11999-011-1996-6 [DOI] [PMC free article] [PubMed] [Google Scholar]
- [2]. Haglin, J. M. , Eltorai, A. E. M. , Gil, J. A. , Marcaccio, S. E. , Botero-Hincapie, J. , and Daniels, A. H. , 2016, “ Patient-Specific Orthopaedic Implants,” Orthop. Surg., 8(4), pp. 417–424. 10.1111/os.12282 [DOI] [PMC free article] [PubMed] [Google Scholar]
- [3]. Patil, S. , Bunn, A. , Bugbee, W. D. , Colwell, C. W. , and D'Lima, D. D. , 2015, “ Patient-Specific Implants With Custom Cutting Blocks Better Approximate Natural Knee Kinematics Than Standard TKA Without Custom Cutting Blocks,” Knee, 22(6), pp. 624–629. 10.1016/j.knee.2015.08.002 [DOI] [PubMed] [Google Scholar]
- [4]. Blankevoort, L. , and Huiskes, R. , 1996, “ Validation of a Three-Dimentional Model of the Knee,” J. Biomech., 29(7), pp. 955–961. 10.1016/0021-9290(95)00149-2 [DOI] [PubMed] [Google Scholar]
- [5]. Harris, M. D. , Cyr, A. J. , Ali, A. A. , Fitzpatrick, C. K. , Rullkoetter, P. J. , Maletsky, L. P. , and Shelburne, K. B. , 2016, “ A Combined Experimental and Computational Approach to Subject-Specific Analysis of Knee Joint Laxity,” ASME J. Biomech. Eng., 138(8), pp. 1–8. 10.1115/1.4033882 [DOI] [PMC free article] [PubMed] [Google Scholar]
- [6]. Baldwin, M. A. , Clary, C. , Maletsky, L. P. , and Rullkoetter, P. J. , 2009, “ Verification of Predicted Specimen-Specific Natural and Implanted Patellofemoral Kinematics During Simulated Deep Knee Bend,” J. Biomech., 42(14), pp. 2341–2348. 10.1016/j.jbiomech.2009.06.028 [DOI] [PubMed] [Google Scholar]
- [7]. Mootanah, R. , Imhauser, C. W. , Reisse, F. , Carpanen, D. , Walker, R. W. , Koff, M. F. , Lenhoff, M. W. , Rozbruch, S. R. , Fragomen, A. T. , Dewan, Z. , Kirane, Y. M. , Cheah, K. , Dowell, J. K. , and Hillstrom, H. J. , 2014, “ Development and Validation of a Computational Model of the Knee Joint for the Evaluation of Surgical Treatments for Osteoarthritis,” Comput. Methods Biomech. Biomed. Eng., 17(13), pp. 1502–1517. 10.1080/10255842.2014.899588 [DOI] [PMC free article] [PubMed] [Google Scholar]
- [8]. Ali, A. A. , Shalhoub, S. S. , Cyr, A. J. , Fitzpatrick, C. K. , Maletsky, L. P. , Rullkoetter, P. J. , and Shelburne, K. B. , 2016, “ Validation of Predicted Patellofemoral Mechanics in a Finite Element Model of the Healthy and Cruciate-Deficient Knee,” J. Biomech., 49(2), pp. 302–309. 10.1016/j.jbiomech.2015.12.020 [DOI] [PMC free article] [PubMed] [Google Scholar]
- [9]. Beillas, P. , Papaioannou, G. , Tashman, S. , and Yang, K. H. , 2004, “ A New Method to Investigate In Vivo Knee Behavior Using a Finite Element Model of the Lower Limb,” J. Biomech., 37(7), pp. 1019–1030. 10.1016/j.jbiomech.2003.11.022 [DOI] [PubMed] [Google Scholar]
- [10]. Hume, D. R. , Navacchia, A. , Rullkoetter, P. J. , and Shelburne, K. B. , 2019, “ A Lower Extremity Model for Muscle-Driven Simulation of Activity Using Explicit Finite Element Modeling,” J. Biomech., 84(xxxx), pp. 153–160. 10.1016/j.jbiomech.2018.12.040 [DOI] [PMC free article] [PubMed] [Google Scholar]
- [11]. Li, G. , Lopez, O. , and Rubash, H. , 2001, “ Variability of a Three-Dimensional Finite Element Model Constructed Using Magnetic Resonance Images of a Knee for Joint Contact Stress Analysis,” ASME J. Biomech. Eng., 123(4), pp. 341–346. 10.1115/1.1385841 [DOI] [PubMed] [Google Scholar]
- [12]. Emery, M. , Moffroid, M. , Boerman, J. , Fleming, B. , Howe, J. , and Pope, M. , 1989, “ Reliability of Force/Displacement Measures in a Clinical Device Designed to Measure Ligamentous Laxity at the Knee,” J. Orthop. Sports Phys. Ther., 10(11), pp. 441–447. 10.2519/jospt.1989.10.11.441 [DOI] [PubMed] [Google Scholar]
- [13]. Daniel, D. M. , Stone, M. L. , Sachs, R. , and Malcom, L. , 1985, “ Instrumented Measurement of Anterior Knee Laxity in Patients With Acute Anterior Cruciate Ligament Disruption,” Am. J. Sports Med., 13(6), pp. 401–407. 10.1177/036354658501300607 [DOI] [PubMed] [Google Scholar]
- [14]. Blankevoort, L. , Huiskes, R. , and de Lange, A. , 1988, “ The Envelope of Passive Knee Joint Motion,” J. Biomech., 21(9), pp. 705–720. 10.1016/0021-9290(88)90280-1 [DOI] [PubMed] [Google Scholar]
- [15]. Skinner, H. B. , Wyatt, M. P. , Stone, M. L. , Hodgdon, J. A. , and Barrack, R. L. , 1986, “ Exercise-Related Knee Joint Laxity,” Am. J. Sports Med., 14(1), pp. 30–34. 10.1177/036354658601400106 [DOI] [PubMed] [Google Scholar]
- [16]. Erdemir, A. , Besier, T. F. , Halloran, J. P. , Imhauser, C. W. , Laz, P. J. , Morrison, T. M. , and Shelburne, K. B. , 2019, “ Deciphering the ‘Art’ in Modeling and Simulation of the Knee Joint: Overall Strategy,” ASME J. Biomech. Eng., 141(7), pp. 1–10. 10.1115/1.4043346 [DOI] [PMC free article] [PubMed] [Google Scholar]
- [17]. Peters, A. E. , Akhtar, R. , Comerford, E. J. , and Bates, K. T. , 2018, “ Tissue Material Properties and Computational Modelling of the Human Tibiofemoral Joint: A Critical Review,” PeerJ, 2018(1), pp. 1–48. 10.7717/peerj.4298 [DOI] [PMC free article] [PubMed] [Google Scholar]
- [18]. Navacchia, A. , Hume, D. R. , Rullkoetter, P. J. , and Shelburne, K. B. , 2019, “ A Computationally Efficient Strategy to Estimate Muscle Forces in a Finite Element Musculoskeletal Model of the Lower Limb,” J. Biomech., 84(xxxx), pp. 94–102. 10.1016/j.jbiomech.2018.12.020 [DOI] [PMC free article] [PubMed] [Google Scholar]
- [19]. Esrafilian, A. , Stenroth, L. , Mononen, M. E. , Tanska, P. , Avela, J. , and Korhonen, R. K. , 2020, “ EMG-Assisted Muscle Force Driven Finite Element Model of the Knee Joint With Fibril-Reinforced Poroelastic Cartilages and Menisci,” Sci. Rep., 10(1), pp. 1–16. 10.1038/s41598-020-59602-2 [DOI] [PMC free article] [PubMed] [Google Scholar]
- [20]. Fitzpatrick, C. K. , Baldwin, M. A. , and Rullkoetter, P. J. , 2010, “ Computationally Efficient Finite Element Evaluation of Natural Patellofemoral Mechanics,” ASME J. Biomech. Eng., 132(12), pp. 1–8. 10.1115/1.4002854 [DOI] [PubMed] [Google Scholar]
- [21]. Rangger, C. , Daniel, D. M. , Stone, M. L. , and Kaufman, K. , 1993, “ Diagnosis of an ACL Disruption With KT-1000 Arthrometer Measurements,” Knee Surg. Sport. Traumatol. Arthrosc., 1(1), pp. 60–66. 10.1007/BF01552161 [DOI] [PubMed] [Google Scholar]
- [22]. Collette, M. , Courville, J. , Forton, M. , and Gagnière, B. , 2012, “ Objective Evaluation of Anterior Knee Laxity; Comparison of the KT-1000 and GNRB® Arthrometers,” Knee Surg., Sport. Traumatol. Arthrosc., 20(11), pp. 2233–2238. 10.1007/s00167-011-1869-2 [DOI] [PubMed] [Google Scholar]
- [23]. Lorenz, A. , Krickl, V. , Ipach, I. , Arlt, E. M. , Wülker, N. , and Leichtle, U. G. , 2015, “ Practicability for Robot-Aided Measurement of Knee Stability in-Vivo Orthopedics and Biomechanics,” BMC Musculoskelet. Disord., 16(1), pp. 1–9. 10.1186/s12891-015-0826-5 [DOI] [PMC free article] [PubMed] [Google Scholar]
- [24]. Beukes, G. L. , Patnaik, S. , and Sivarasu, S. , 2018, “ In Vitro Functional Verification of a Novel Laxity Measurement Stress Radiography Device,” ASME Paper No. DMD2018-6943. 10.1115/DMD2018-6943 [DOI] [Google Scholar]
- [25]. Kupper, J. C. , Westover, L. , Frayne, R. , and Ronsky, J. L. , 2016, “ Application of a Novel Measure of In Vivo Knee Joint Laxity,” ASME J. Biomech. Eng., 138(10), pp. 1–7. 10.1115/1.4034169 [DOI] [PubMed] [Google Scholar]
- [26]. Fleming, B. C. , Brattbakk, B. , Peura, G. D. , Badger, G. J. , and Beynnon, B. D. , 2002, “ Measurement of Anterior-Posterior Knee Laxity: A Comparison of Three Techniques,” J. Orthop. Res., 20(3), pp. 421–426. 10.1016/S0736-0266(01)00134-6 [DOI] [PubMed] [Google Scholar]
- [27]. Moewis, P. , Duda, G. N. , Jung, T. , Heller, M. O. , Boeth, H. , Kaptein, B. , and Taylor, W. R. , 2016, “ The Restoration of Passive Rotational Tibio-Femoral Laxity After Anterior Cruciate Ligament Reconstruction,” PLoS One, 11(7), p. e0159600. 10.1371/journal.pone.0159600 [DOI] [PMC free article] [PubMed] [Google Scholar]
- [28]. Carpenter, R. D. , Shefelbine, S. J. , Lozano, J. , Carballido-Gamio, J. , Majumdar, S. , and Ma, C. B. , 2008, “ A New Device for Measuring Knee Rotational Kinematics Using Magnetic Resonance Imaging,” ASME J. Med. Devices, Trans., 2(4), pp. 1–5. 10.1115/1.2976029 [DOI] [Google Scholar]
- [29]. Colombet, P. , Jenny, J. Y. , Menetrey, J. , Plaweski, S. , and Zaffagnini, S. , 2012, “ Current Concept in Rotational Laxity Control and Evaluation in ACL Reconstruction,” Orthop. Traumatol. Surg. Res., 98(8), pp. S201–S210. 10.1016/j.otsr.2012.10.005 [DOI] [PubMed] [Google Scholar]
- [30]. Pedersen, D. , Vanheule, V. , Wirix-Speetjens, R. , Taylan, O. , Delport, H. P. , Scheys, L. , and Andersen, M. S. , 2019, “ A Novel Non-Invasive Method for Measuring Knee Joint Laxity in Four DOF: In Vitro Proof-of-Concept and Validation,” J. Biomech., 82, pp. 62–69. 10.1016/j.jbiomech.2018.10.016 [DOI] [PubMed] [Google Scholar]
- [31]. Fitzpatrick, C. K. , Maag, C. , Clary, C. W. , Metcalfe, A. , Langhorn, J. , and Rullkoetter, P. J. , 2016, “ Validation of a New Computational 6-DOF Knee Simulator During Dynamic Activities,” J. Biomech., 49(14), pp. 3177–3184. 10.1016/j.jbiomech.2016.07.040 [DOI] [PubMed] [Google Scholar]
- [32]. Churchill, E. , and McConville, J. T. , 1976, “ Sampling and Data Gathering Strategies for Future USAF Anthropometry,” AMRL-TR, 74(102), pp. 1–133.https://apps.dtic.mil/sti/citations/ADA025240 [Google Scholar]
- [33]. Weiss, J. A. , Gardiner, J. C. , and Bonifasi-Lista, C. , 2002, “ Ligament Material Behavior is Nonlinear, Viscoelastic and Rate-Independent Under Shear Loading,” J. Biomech., 35(7), pp. 943–950. 10.1016/S0021-9290(02)00041-6 [DOI] [PubMed] [Google Scholar]
- [34]. Markolf, K. L. , Mensch, J. S. , and Amstutz, H. C. , 1976, “ Stiffness and Laxity of the Knee - The Contributions of the Supporting Structures,” J. Bone Jt. Surg., 58-A(5), pp. 583–594.https://journals.lww.com/jbjsjournal/Abstract/1976/58050/Stiffness_and_laxity_of_the_knee__the.1.aspx [PubMed] [Google Scholar]
- [35]. Kozanek, M. , Hosseini, A. , Liu, F. , Van de Velde, S. K. , Gill, T. J. , Rubash, H. E. , and Li, G. , 2009, “ Tibiofemoral Kinematics and Condylar Motion During the Stance Phase of Gait,” J. Biomech., 42(12), pp. 1877–1884. 10.1016/j.jbiomech.2009.05.003 [DOI] [PMC free article] [PubMed] [Google Scholar]
- [36]. Grood, E. S. , and Suntay, W. J. , 1983, “ A Joint Coordinate System for the Clinical Description of Three-Dimensional Motions: Application to the Knee,” ASME J. Biomech. Eng., 105(2), pp. 136–144. 10.1115/1.3138397 [DOI] [PubMed] [Google Scholar]
- [37]. Churchill, D. L. , Incavo, S. J. , Johnson, C. C. , and Beynnon, B. D. , 1998, “ The Transepicondylar Axis Approximates the Optimal Flexion Axis of the Knee,” Clin. Orthop. Relat. Res., 356, pp. 111–118. 10.1097/00003086-199811000-00016 [DOI] [PubMed] [Google Scholar]
- [38]. Kefala, V. , Ali, A. A. , Mannen, E. M. , and Shelburne, K. B. , 2021, “ Patellofemoral Kinematics in Healthy Older Adults During Gait Activities,” Hum. Mov. Sci., 75, p. 102746. 10.1016/j.humov.2020.102746 [DOI] [PMC free article] [PubMed] [Google Scholar]
- [39]. Ivester, J. C. , Cyr, A. J. , Harris, M. D. , Kulis, M. J. , Rullkoetter, P. J. , and Shelburne, K. B. , 2015, “ A Reconfigurable High-Speed Stereo-Radiography System for Sub-Millimeter Measurement of In Vivo Joint Kinematics,” J. Med. Devices, Trans. ASME, 9(4), pp. 1–7. 10.1115/1.4030778 [DOI] [Google Scholar]
- [40]. Wang, F. , Vemuri, B. , Rao, M. , and Chen, Y. , 2004, “ Cumulative Residual Entropy: A New Measure of Information,” IEEE Trans. Inf. Theory, 50(6), pp. 1220–1228. 10.1109/TIT.2004.828057 [DOI] [Google Scholar]
- [41]. Behnam, Y. A. , Krishnan, A. A. , and Clary, C. W. , 2020, “ Experimental Method and Computational Model for Evaluation of Knee Joint Mechanics,” ORS 2020 Annual Meeting, Orthopaedic Research Society, Phoenix, AZ, Feb. 8–11, Paper No. 1058, p. 2017. [Google Scholar]
- [42]. McKay, W. P. , Chilibeck, P. D. , Daku, B. L. F. , and Lett, B. , 2010, “ Quantifying the Mechanical Work of Resting Quadriceps Muscle Tone,” Eur. J. Appl. Physiol., 108(4), pp. 641–648. 10.1007/s00421-009-1261-9 [DOI] [PubMed] [Google Scholar]
- [43]. Hindle, K. , Whitcomb, T. , Briggs, W. , and Hong, J. , 2012, “ Proprioceptive Neuromuscular Facilitation (PNF): Its Mechanisms and Effects on Range of Motion and Muscular Function,” J. Hum. Kinet., 31(2012), pp. 105–113. 10.2478/v10078-012-0011-y [DOI] [PMC free article] [PubMed] [Google Scholar]
- [44]. Markolf, K. L. , Kochan, A. , and Amstutz, H. C. , 1984, “ Measurement of Knee Stiffness and Laxity in Patients With Documented Absence of the Anterior Cruciate Ligament,” J. Bone Jt. Surg., 66(2), pp. 242–253. 10.2106/00004623-198466020-00011 [DOI] [PubMed] [Google Scholar]
- [45]. Rudy, T. W. , Livesay, G. A. , Woo, S. L. Y. , and Fu, F. H. , 1996, “ A Combined Robotic/Universal Force Sensor Approach to Determine In Situ Forces of Knee Ligaments,” J. Biomech., 29(10), pp. 1357–1360. 10.1016/0021-9290(96)00056-5 [DOI] [PubMed] [Google Scholar]
- [46]. Shultz, S. J. , Shimokochi, Y. , Nguyen, A.-D. , Schmitz, R. J. , Beynnon, B. D. , and Perrin, D. H. , 2007, “ Measurement of Varus–Valgus and Internal–External Rotational Knee Laxities In Vivo—Part I: Assessment of Measurement Reliability and Bilateral Asymmetry,” J. Orthop. Res., 25(8), pp. 981–988. 10.1002/jor.20397 [DOI] [PubMed] [Google Scholar]
- [47]. Hume, D. R. , Kefala, V. , Harris, M. D. , and Shelburne, K. B. , 2018, “ Comparison of Marker-Based and Stereo Radiography Knee Kinematics in Activities of Daily Living,” Ann. Biomed. Eng., 46(11), pp. 1806–1815. 10.1007/s10439-018-2068-9 [DOI] [PMC free article] [PubMed] [Google Scholar]
- [48]. Kupper, J. C. , 2008, A Novel Measure of In-Vivo Knee Joint Laxity, University of Calgary, Calgary, AB, Canada. 10.11575/PRISM/20005 [DOI] [Google Scholar]
- [49]. Barcellona, M. G. , Morrissey, M. C. , Milligan, P. , and Amis, A. A. , 2014, “ The Effect of Thigh Muscle Activity on Anterior Knee Laxity in the Uninjured and Anterior Cruciate Ligament-Injured Knee,” Knee Surg., Sport Traumatol. Arthrosc., 22(11), pp. 2821–2829. 10.1007/s00167-013-2695-5 [DOI] [PubMed] [Google Scholar]
- [50]. Liu, W. , and Maitland, M. E. , 2000, “ The Effect of Hamstring Muscle Compensation for Anterior Laxity in the ACL-Deficient Knee During Gait,” J. Biomech., 33(7), pp. 871–879. 10.1016/S0021-9290(00)00047-6 [DOI] [PubMed] [Google Scholar]
- [51]. Un, B. S. , Beynnon, B. D. , Churchill, D. L. , Haugh, L. D. , Risberg, M. A. , and Fleming, B. C. , 2001, “ A New Device to Measure Knee Laxity During Weightbearing and Non-Weightbearing Conditions,” J. Orthop. Res., 19(6), pp. 1185–1191. 10.1016/S0736-0266(01)00055-9 [DOI] [PubMed] [Google Scholar]
- [52]. Pollard, C. D. , Braun, B. , and Hamill, J. , 2006, “ Influence of Gender, Estrogen and Exercise on Anterior Knee Laxity,” Clin. Biomech., 21(10), pp. 1060–1066. 10.1016/j.clinbiomech.2006.07.002 [DOI] [PubMed] [Google Scholar]
- [53]. Rozzi, S. L. , Lephart, S. M. , Gear, W. S. , and Fu, F. H. , 1999, “ Knee Joint Laxity and Neuromuscular Characteristics of Male and Female Soccer and Basketball Players,” Am. J. Sports Med., 27(3), pp. 312–319. 10.1177/03635465990270030801 [DOI] [PubMed] [Google Scholar]
- [54]. Park, H. S. , Wilson, N. A. , and Zhang, L. Q. , 2008, “ Gender Differences in Passive Knee Biomechanical Properties in Tibial Rotation,” J. Orthop. Res., 26(7), pp. 937–944. 10.1002/jor.20576 [DOI] [PubMed] [Google Scholar]
- [55]. Park, S. K. , Stefanyshyn, D. J. , Loitz-Ramage, B. , Hart, D. A. , and Ronsky, J. L. , 2009, “ Changing Hormone Levels During the Menstrual Cycle Affect Knee Laxity and Stiffness in Healthy Female Subjects,” Am. J. Sports Med., 37(3), pp. 588–598. 10.1177/0363546508326713 [DOI] [PubMed] [Google Scholar]
- [56]. Harmon, K. G. , and Ireland, M. L. , 2000, “ Gender Differences in Noncontact Anterior Cruciate Ligament Injuries,” Clin. Sports Med., 19(2), pp. 287–302. 10.1016/S0278-5919(05)70204-0 [DOI] [PubMed] [Google Scholar]