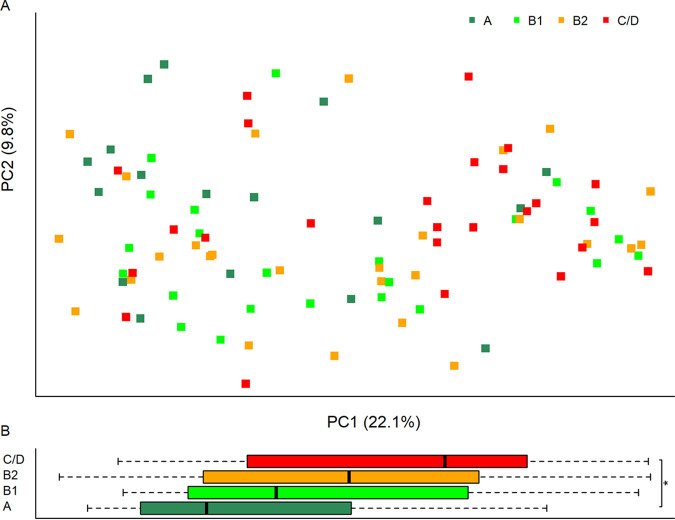
FIG 2.
(A) Principal-coordinate analysis on the Bray-Curtis distance of the four groups. The first two principal coordinates (PCs), PC1 and PC2, are shown. The x and y axes indicate data variances captured by PC1 and PC2, respectively. (B) Box plots of PC1 by groups. ANOVA and Tukey’s tests found differences on PC1. No difference was found on PC2. Adjusted P value: *, P < 0.05.

