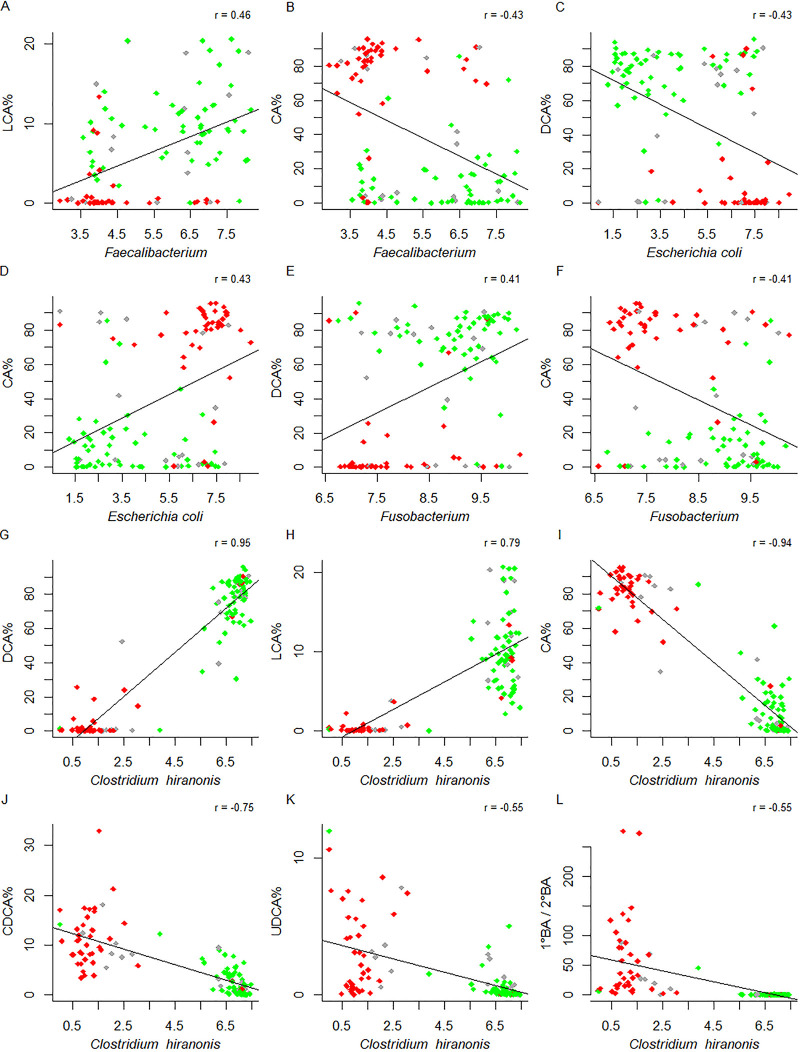
FIG 7.
Pearson’s correlations between fecal bile acids (BAs) and gut microbes. CA, cholic acid; LCA, lithocholic acid; DCA, deoxycholic acid; CDCA, chenodeoxycholic acid; UDCA, ursodeoxycholic acid; 1° BA/2° BA, the ratio of primary to secondary BAs; r, correlation coefficient. (A to L) The percentage of each BA was calculated as the ratio of BA to the sum of primary and secondary BAs (y axis). Bacterial abundance was expressed as log10 DNA abundance (x axis). Only unconjugated BAs were considered. Samples were colored by dysbiosis index (DI): green for DI ≤ 0, red for DI ≥ 2, gray for others. P < 1e−5 in all cases.

