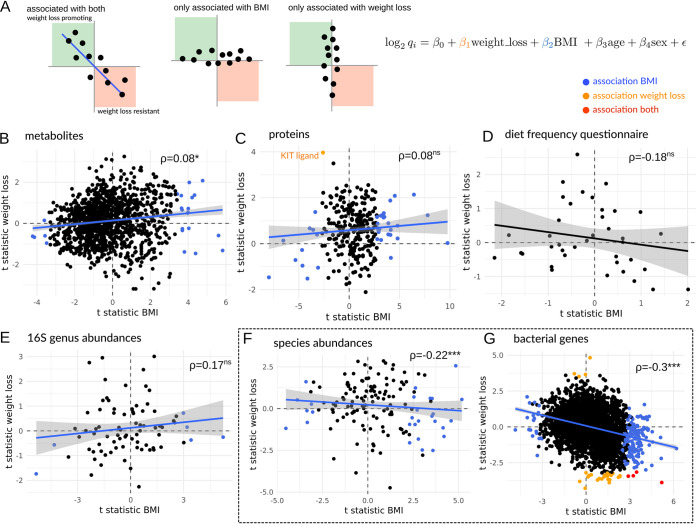
FIG 4.
Associations between baseline multi-omic features, BMI, and weight loss. Biplots show t statistic for features’ independent associations with BMI or weight loss, controlling for age and sex (A). Analyses were run separately for baseline blood metabolites (B), baseline blood proteins (C), baseline dietary features (D), baseline 16S gut bacterial genera (E), baseline metagenome-derived gut bacterial species (F), and baseline metagenome-derived gut bacterial functional genes (G). Blue dots denote features significantly associated with BMI only (i.e., independent of weight loss, age, and sex), orange dots denote features significantly associated with weight loss only (independent of BMI, age, and sex), and red dots denote features independently associated with both BMI and weight loss (independent of age and sex). In panels B to G, asterisks denote significance under a Pearson correlation test and ⍴ denotes the Pearson correlation coefficient between the t statistics for BMI and weight loss (***, P < 0.001; **, P < 0.01; *, P < 0.05; ns, P > 0.05). The dashed box around panels F and G denotes metagenomic results from the subcohort of 25 individuals, while the results in panels B to E are from the larger cohort of 105 individuals.

