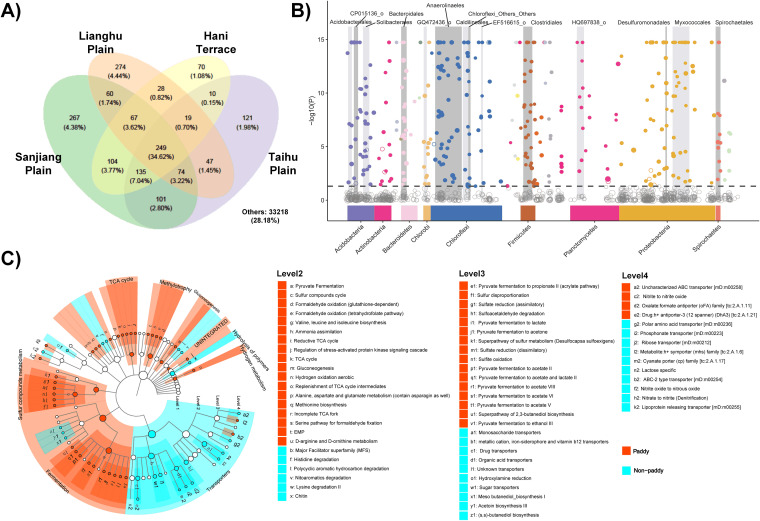
FIG 2.
Taxonomic and functional profiling of paddy and nonpaddy soils suggests a core paddy soil microbiota with enriched functional potentials in paddy soils. (A) Overlapped bacterial OTUs among paddy soil samples in different regions using Venn diagrams. OTU numbers and their percentages of the total are shown in each segment. (B) Manhattan plot showing OTUs enriched in paddy soils compared to nonpaddy soils. Significantly enriched OTUs are depicted as full circles. The dashed line corresponds to the FDR-corrected P value threshold of significance (α = 0.05). The color of each dot represents the taxonomic affiliation of OTUs at the phylum level, and the sizes correspond to their relative abundances. Gray boxes are used to denote the dominant orders (with the relative abundance > 10%). The various shades of gray are used to differentiate orders, and the wider the box, the higher the relative abundance. (C) Functional differences between paddy and nonpaddy soils based on metagenomics analysis using LEfSe statistical tools. The functions were searched against a functional gene database (FOAM) and have been classified into four levels. Nonsignificantly different functions or their relative abundances <1% are not shown. Within each level, functions are listed in a decreasing order according to their relative abundances. Functions in level 1 are labeled on the clustering dendrogram.

