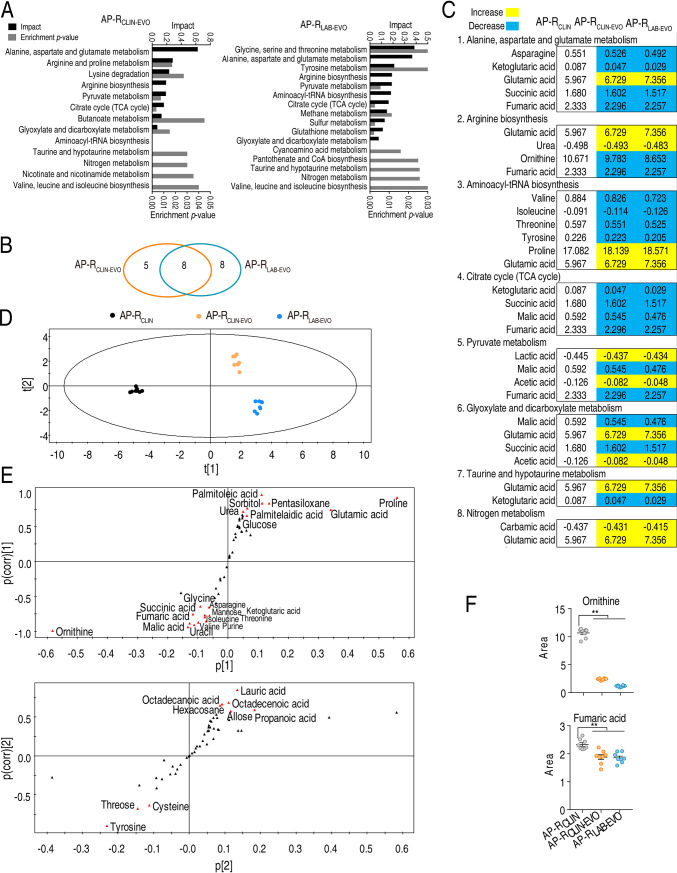
FIG 3.
Overlapping pathways, metabolites, and multivariate data analysis between AP-RCLIN-EVO and AP-RLAB-EVO. (A) Enriched pathways by differential abundances of metabolites. (B) Venn diagram showing overlapping and unique differential pathways. (C) Integrative analysis of metabolites in significantly enriched pathways. Yellow and blue indicate increase and decrease of metabolites, respectively. Number shows the relative value of differential abundance of metabolites. (D) PCA of AP-CLIN, AP-RCLIN-EVO, and AP-RLAB-EVO. Each dot represents the technical replicate of samples in the plot. (E) S-plot generated from OPLS-DA. Predictive component p[1] and correlation p(corr)[1] differentiate AP-RCLIN and AP-RLAB-EVO from AP-RCLIN-EVO. Predictive component p[2] and correlation p(corr)[2] separate AP-RCLIN from AP-RLAB-EVO and deviations of AP-RCLIN-EVO. The triangle represents metabolites in which candidate biomarkers are marked. (F) Scatter diagram of biomarkers ornithine identified by p[1] and p(corr)[2] and arginine identified by p[2] and p(corr)[2]. *, P < 0.05; **, P < 0.01.

