

Abstract
Systems biology involves the integration of multiple data types (across different data sources) to offer a more complete picture of the biological system being studied. While many existing biological databases are implemented using the traditional SQL (Structured Query Language) database technology, NoSQL database technologies have been explored as a more relationship-based, flexible and scalable method of data integration. In this paper, we describe how to use the Neo4J graph database to integrate a variety of types of data sets in the context of systems vaccinology. Specifically, we have converted into a common graph model diverse types of vaccine response measurement data from the NIH/NIAID ImmPort data repository, pathway data from Reactome, influenza virus strains from WHO, and taxonomic data from NCBI Taxon. While Neo4J provides a graph-based query language (Cypher) for data retrieval, we develop a web-based dashboard for users to easily browse and visualize data without the need to learn Cypher. In addition, we have prototyped a natural language query interface for users to interact with our system. In conclusion, we demonstrate the feasibility of using a graph-based database for storing and querying immunological data with complex biological relationships. Querying a graph database through such relationships has the potential to reveal novel relationships among heterogeneous biological data.
Keywords: ontology, knowledgebase, graph database, immunology, influenza vaccine
I. Introduction
Relational (SQL or Structured Query Language) database technology has widely been used for storing and managing data in different domains including the biomedical domain. However, NoSQL databases have recently emerged as an alternative database technology as part of the solution to address the big data problem, dealing with issues involving a large volume, velocity, variety, and veracity of data. Among the NoSQL technologies, the Neo4J graph database/knowledgebase has increasingly been used as a relationship-based (or knowledge-based), efficient, flexible and scalable method for querying and integrating data based a graph data model. Neo4J has been compared to SQL databases to show a better query performance in the biological context [1]. Biological data is typically highly connected, semi-structured and unpredictable, and these features make the graph data model more suitable than the relational (SQL) data model. In addition, graph traversal type queries are important for hypothesis generation, as they can reveal relationships connecting entities that might not have been expected and might not be apparent from visual inspection of the network.
Biological network data can be modeled naturally and manipulated efficiently based on a graph structure. Neo4J has been applied to the representation and querying of network data at the molecular and cellular level. For example, Reactome [2], which is a biological pathway database, was converted into a Neo4J database [3] that provides a more natural representation of biological networks. Recon2Neo4j [4] is another Neo4J database that features a graph representation of the human metabolic network. It also allows translation between the Neo4J graph format and the SBML/SIF format. CyNeo4j [5] incorporates Neo4J into a network data visualization tool, Cytoscape [6], to make the implementation of network visualization and analysis more efficient.
While specific types of network data can help us understand certain aspects of a biological system [7], they can yield a more comprehensive picture of the biological system being studied when combined and integrated. As described in [7], there are hierarchical and non-hierarchical relationships between components in different layers of networks (e.g., genome, proteome and metabolome). Neo4J has been employed as a graph-based approach for relating and integrating diverse types of data in the context of systems biology. For example, Neo4J was used to combine multiple types of networks including gene-disease network and protein-drug network to facilitate link discovery type of queries to identify drug targets for asthma [8]. ANIMA [9] generates a multiscale association network (stored as a graph database using Neo4J) from multiple data types including expression data, clinical data and biological pathways. In [7], a large collection of various types of genomics data from different sources were integrated into a Neo4J database.
While there are a growing number of valuable Neo4J databases in the biological domain, these databases represent separate graphs (silos) that do not allow for integrated queries. To address this limitation, we have built LinkedImm to integrate multiple types of data in the context of systems vaccinology. LinkedImm is a Neo4J database that converts heterogeneously formatted datasets into a common graph format and also integrates other Neo4J databases.
II. METHOD
A. Systems Vaccinology Use Case
Systems vaccinology studies leverage high-throughput profiling techniques to provide an integrated, dynamic view of vaccine-driven immune responses [10]. In a typical systems vaccinology study, blood samples are collected from well characterized cohorts at multiple time-points pre- and post-vaccination (Figure 1). High-throughput immune profiling methods, such as genome-wide transcriptional profiling or B/T cell receptor repertoire profiling [10], are carried out on each of the samples in order to measure the unfolding immune response. These measurements are then analyzed to determine features that are differentially-regulated following vaccination, or are associated with the quality of the response.
Figure 1.

Generation of profiling data from young and older subjects before (day 0) and following influenza vaccination.
Systems vaccinology approaches have been widely applied to understand the human response to influenza vaccination [10]. Influenza is a highly contagious respiratory illness caused by influenza viruses and affects human health globally. It causes 30,000 to 40,000 annual deaths in the United States [11]. Vaccination remains the primary method of preventing influenza. However, despite the overall public health success of annual influenza vaccinations, many individuals fail to induce a significant antibody response, particularly in the older population [12, 13].
Several influenza vaccination profiling studies have been conducted and coordinated as part of the NIH/NIAID Human Immunology Project Consortium (HIPC) (immuneprofiling.org) [14]. HIPC has also conducted a meta-analysis to identify a pre-vaccination gene signature that was predictive of the quality of the response [14]. The data associated with these HIPC studies are stored in the NIH/NIAID ImmPort repository [15] that is a SQL (MySQL) database. HIPC data are also made available to the public through ImmuneSpace, which facilitates user-driven analyses of HIPC data [14]. ImmPort and ImmuneSpace offer the potential for secondary analysis to identify robust signatures of vaccination responses, including pre- and post-vaccination time-points.
We have identified over sixty influenza vaccination studies in ImmPort that include pre- and post-vaccination transcriptional profiling data. These include studies done by HIPC as well as those done by other research groups. To construct LinkedImm, we have initially focused on this set of influenza vaccination studies. These studies followed the typical systems vaccinology design (Figure 1). All of the studies recruited young adult cohorts, and some also included older adults. Patient demographic data (e.g., age and sex) are available for each subject, along with antibody titers and transcriptional profiling data. Antibody titers to each of the influenza strains included in the vaccine are usually measured by hemagglutination-inhibition assay (HAI) at one time-point pre-vaccination (e.g., day 0) and another time-point post-vaccination (e.g., day 28) to assess the quality of the vaccination response. In addition, many of these studies also include transcriptional profiling carried out on PBMCs using gene expression microarrays at multiple time points pre- and post-vaccination (time point 0 represents pre-vaccination and subsequent time points correspond to the post-vaccination period). Each one of these experiments provide a measurement of individual gene expression levels for ~20,000 genes. Many of these studies also include additional types of immune profiling data, such as high-dimensional cytometry, but these have not been incorporated into our prototype system yet. Other studies in ImmPort make similar antibody titer and gene expression measurements using different experimental technologies, such as virus neutralization assay (VNA) and RNA-seq.
Figure 2 shows the types of data that are currently integrated to build LinkedImm. We begin the construction of LinkedImm by converting ImmPort’s HAI and gene expression data into a Neo4J graph database. The conversion steps and the resulting graph model is shown in Figure 3 In the graph model, Study is represented as the root node that has Subject as a child node (subjects can be grouped into a cohort or arm). Subject has biosamples (Biosample) that have experimental samples (Expsample) with which assay results are associated. Our current implementation uses the Enterprise Edition (version 3.5) of Neo4J running on a Linux server with 32 GB RAM, and 500 TB Solid State Disk (SSD). It uses Apache 2.0 as the web server. To extract HAI data from ImmPort, we used ImmPort’s API (application program interface) to automatically fetch the HAI results from all vaccine studies (there are a total of 58 studies with HAI results). The API output is in CSV format. We wrote a Cypher script to parse the CSV file and transform the HAI data into the NEO4J graph format. Unlike the case for HAI data, ImmPort only stores metadata about the microarray experiment, while the underlying gene expression data are stored in the NCBI Gene Expression Omnibus (GEO) repository [16]. To obtain the gene expression data, we rely on ImmuneSpace (https://www.immunespace.org/), which uses the metadata of published studies from ImmPort to retrieve the raw data from GEO and then processes these data to generate normalized gene expression values. Further analysis (e.g., fold change) can be done on the processed gene expression data made available through ImmuneSpace. In this work, we wrote Cypher script to parse the fold change data (in CSV format) derived from the processed data downloaded from ImmuneSpace for conversion into Neo4J. The result of this process is a graph database that links subjects, biosamples and experiments, along with HAI and gene expression results (see Figure 3).
Figure 2.

LinkedImm is created based on integration of diverse types of data from multiple sources.
Figure 3.

The graph model of HAI and gene expression measurements for a single study (SDY404). Study subjects (yellow circles) are annotated by their demographic information, including age cohort (e.g., young, older, etc.). Each subject is linked to blood samples that were collected (red circles), which are in turn linked to the different experiments that were run on these samples (green circles). HAI measurements (grey circles) are collected for each of the virus strains included in the vaccine given to that subject. Gene expression measurement are available for all of the transcripts measured (green circles, with only a subset shown for clarity).
Integrative analysis is a key component of systems vaccinology. For example, identifying pathways that are activated following vaccination involves bringing together information on gene expression levels in the study of interest along with prior knowledge on the set of genes associated with each pathway (e.g., from Reactome [17]). Many databases that collect prior knowledge have been developed and made accessible over the web for the researcher to access and query. Although web-accessible databases can be individually queried and the results can be downloaded, it is often the user’s responsibility to figure out how to link them in a meaningful context for integrated data analysis. Such data integration efforts are hampered by the lack of standard formats and identifiers, as well as the lack of formal relationships between data in different databases.
To facilitate integrative analyses, we have expanded the LinkedImm graph database by linking the HAI and gene expression data from ImmPort with additional types of data available through other sources (Figure 2). Specifically, we: (1) define relationships between the HAI measurements in different studies by incorporating information on influenza virus strains from the CDC and NCBI, and (2) define the relationships between genes by incorporating pathway associations from Reactome [2]. The seasonal influenza virus strain information was produced by WHO and made available as a tab-delimited file through CDC. We read in this file, and mapped the virus strain names to the names of the virus strains in the NCBI Taxonomy to create the links using a Neo4J graph for NCBI Taxonomy implemented by EBI (https://www.ebi.ac.uk/ols/docs/neo4j-schema) (Figure 4). For efficiency, we actually extracted a subgraph based on the WHO virus strains, which is stored in LinkedImm. Second, we imported a subgraph of the Reactome graph database into LinkedImm. This subgraph includes all pathways containing any of the genes measured in the microarray data from ImmPort. In total, we incorporated information on nineteen unique influenza virus strains and over two thousand human pathways covering approximately twenty thousand genes.
Figure 4.

The graph model for HAI result linked to virus taxonomy as part of NCBI TAXON.
B. Web-Based Dashboard and Natural Language Query Interface
We have implemented a web interface based on the PHP framework that can be used to interactively explore LinkedImm without learning the Cypher query language. The PHP-based web form takes the input from users and passes that input to a dynamic Cypher generation (DCG) function. The DCG function retrieves data from the LinkedImm graph database and stored the results into a CSV file. Subsequently, our script passes the CSV results to an R function which uses the Ggplot2 library to render the data through a plot view.
Users can also type natural-language queries in a text input field; alternatively, if using a web browser that supports the experimental Web Speech API (Google Chrome, currently), they can speak the query and have the browser convert the speech to text. Either way, the query text is sent to a natural language processing agent hosted on Dialogflow https://dialogflow.com/), a service owned by Google. The Dialogflow agent has been trained with example queries to determine what type of information the user seeks. Using information from this agent, the web app queries the LinkedImm database and displays results, which can include interactive plots and tables. Since the NLP agent has some ability to remember the current query context, it is possible to implement support for follow-up queries; for example, “How about for 2014?” after having previously asked the agent to show results from the 2013 influenza vaccination season.
III. Results
The LinkedImm graph knowledgebase currently contains 37,992 nodes and 72,229 relationships. Neo4J comes with a web-based interface for users to query the database using Cypher. The query output can be displayed as a graph or in other formats (e.g., tabular format). Figure 5 shows a Cypher query to retrieve the subjects for a study whose accession is “SDY404” and its output in graphical format. The Cypher query language is expressive enough to allow users to ask more sophisticated questions like the following: ”find subjects with age greater than 65 and HAI titer value for H3N2 strain on day 28 greater than day 0” (Figure 6). Not only does this query requires connecting multiple types of information (e.g., demographic information and HAI titer values at different time points), but it also makes inference based on the hierarchical structure (taxonomy) of virus strains. In this case H3N2 is a broader category of different virus strains like A/Victoria/3/1975 and A/Berth/16/2009. Thus, LinkedImm supports queries that go beyond simple virus strain name matching only by leveraging the known relationships.
Figure 5.

A Cypher query (top line) is used to retrieve all the subjects (red circles) profiled in a specified study (SDY404, blue circle).
Figure 6.
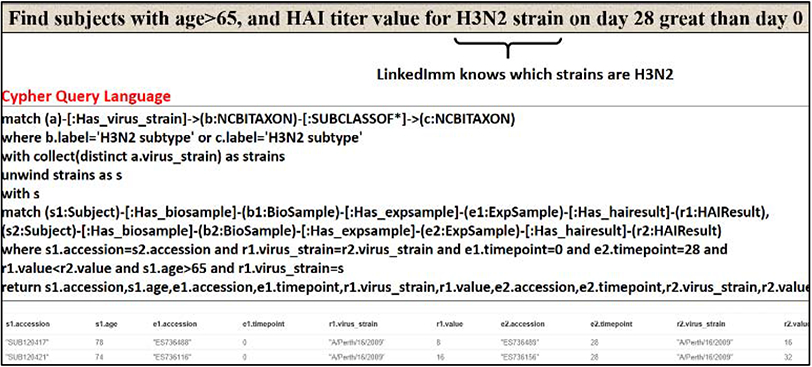
A more expressive Cypher query involving inference based on the hierarchical relationship recognizing the virus strains of the H3N2 subtype.
Although Cypher is powerful, it requires a learning curve which can be steep for general users, like experimental immunologists, who may not be familiar with Cypher or other query languages. To address this, we have developed a web-based dashboard for users to interact with LinkedImm. This dashboard is designed to provide basic subject-level information, including age distributions (Figure 7) and antibody titers (Figure 8) across the different studies. The user can perform filtering to focus on specific subjects and/or studies. The antibody titer interface demonstrates the power of linking the immune profiling measurements with external, prior knowledge on virus strains. The virus strains included in the influenza vaccine can change each year, but these strains can be related to each other based on their type (e.g., influenza A or B) and subtype (e.g., H1N1 or H3N2). With LinkedImm, users can query results on individual strains, but also results from all of the H1N1 strains (Figure 8).
Figure 7.

A plot view of the age distributions of subjects for different HIPC studies.
Figure 8.

A box plot of the distributions of antibody titer values for different H1N1 virus strains measured across different studies.
Our prototype web interface supports database queries through a form or spoken/typed natural language. Figure 7 demonstrates the use of a form-based query to visualize the distribution of subject ages in a collection of studies. Figure 9 shows a natural language query plotting the age distribution of female subjects older than 65 years old.
Figure 9.

A natural language query example (plot female subjects over 65 years old).
IV. DISCUSSIONS
We have created a graph knowledgebase (LinkedImm) based on integration of related types of immunological data from multiple resources including other Neo4J databases that are not connected. This integrated resource can be accessed through the web front using Cypher queries, dashboard interface, and natural language query interface.
While data and metadata can be modeled as a graph, we can enrich the graph based on existing concepts and relationships. For example, we have defined older subjects as subjects whose age is greater than a threshold age (e.g., 65). Similarly, we can describe certain genes as “up-regulated” if their expression values post-vaccination are at least two-fold higher than those in the pre-vaccination sample. An enriched graph can be generated using Cypher queries so that the resulting enriched graph can further be queried in a simpler and quicker way.
To make graph databases accessible to scientists and researchers (e.g., experimental immunologists), a friendly user interface is needed. To this end, we have demonstrated the use of a web-based dashboard and natural language query interface as an intuitive approach to easing data navigation and queries. More advanced data visualization methods can be explored to display graph/network data.
The current size of LinkedImm does not require extensive computing power. Most queries can be executed within a few seconds. As LinkedImm continues to grow, performance may become an issue . To scale the performance, we can increase the main memory size, upgrade CPU speed, and utilize solid state disks. In addition, the enterprise version of Neo4J provides causal clustering (https://neo4j.com/docs/operations-manual/current/clustering/introduction/) that features fault tolerance, scalability, and data consistency.
As more Neo4J databases/knowledgebases are developed in various domains, the need to integrate these graph databases grows. It would be useful to create a central registry that can help users find these graph databases and a common query interface to access multiple graph databases simultaneously. Linking the entities in these databases can be a challenge. In LinkedImm, we semi-automatically match the names between entities. However, a more principled and automatic approach could semantically map study data to ontologies, thus unifying terminologies and facilitating data integration. Plugins such as Neosemantics (https://github.com/jbarrasa/neosemantics) have been developed for allowing Neo4J databases to be mapped to RDF/OWL ontologies. This would allow a seamless integration between Neo4J databases and RDF databases including those in the linked data cloud (https://lod-cloud.net/).
V. CONCLUSION
LinkedImm is publicly accessible at http://linkedimm.org. We have used Neo4J to implement a graph knowledgebase system (LinkedImm) to enable systems vaccinology research by integrating diverse types of immunological data from multiple sources. We have demonstrated how this graph-based approach can be used to inter-connect data and make inferences based on meaningful relationships. While SQL databases have been used widely, NoSQL databases like graph databases have gained attention, traction and momentum because of their advantages in dealing with diverse, semi-structured data. In addition to database technologies, we have highlighted the importance of user’s interaction with the knowledgebase through prototyping a web-based dashboard interface and a natural language query interface.
Acknowledgment
This work was supported by grant UH2AI132341 awarded by the National Institute of Allergy and Infectious Diseases. The authors would also like to thank Patrick Dunn from the ImmPort team for his help in extracting data/metadata from the ImmPort database.
NIH/NIAID grant 5UH2AI132341.
Contributor Information
Syed Ahmad Chan Bukhari, Division of Computer Science, Mathematics and Science Lesley H. & William L. Collins College of Professional Studies, St. John’s University, New York, NY, USA.
Jeff Mandell, Interdepartmental Program in Computational Biology and Bioinformatics, Yale University, New Haven, CT, USA.
Steven H. Kleinstein, Department of Pathology, Interdepartmental Program in Computational Biology and Bioinformatics, Yale University, New Haven, CT, USA
Kei-Hoi Cheung, Department of Emergency Medicine and Yale Center for Medical Informatics Computationa Biology and Bioinformaticcs, Yale University, New Haven, CT, USA.
References
- [1].Yoon BH, Kim SK, and Kim SY, Use of Graph Database for the Integration of Heterogeneous Biological Data. Genomics Inform, 2017. 15(1): p. 19–27. [DOI] [PMC free article] [PubMed] [Google Scholar]
- [2].Joshi-Tope G, et al. , Reactome: a knowledgebase of biological pathways. Nucleic Acids Res, 2005. 33(Database issue): p. D428–32. [DOI] [PMC free article] [PubMed] [Google Scholar]
- [3].Fabregat A, et al. , Reactome graph database: Efficient access to complex pathway data. PLoS Comput Biol, 2018. 14(1): p. e1005968. [DOI] [PMC free article] [PubMed] [Google Scholar]
- [4].Balaur I, et al. , Recon2Neo4j: applying graph database technologies for managing comprehensive genome-scale networks. Bioinformatics, 2017. 33(7): p. 1096–1098. [DOI] [PMC free article] [PubMed] [Google Scholar]
- [5].Summer G, et al. , cyNeo4j: connecting Neo4j and Cytoscape. Bioinformatics, 2015. 31(23): p. 3868–9. [DOI] [PMC free article] [PubMed] [Google Scholar]
- [6].Shannon P, et al. , Cytoscape: a software environment for integrated models of biomolecular interaction networks. Genome Res, 2003. 13(11): p. 2498–504. [DOI] [PMC free article] [PubMed] [Google Scholar]
- [7].Altaf-Ul-Amin M, et al. , Systems biology in the context of big data and networks. Biomed Res Int, 2014. 2014: p. 428570. [DOI] [PMC free article] [PubMed] [Google Scholar]
- [8].Lysenko A, et al. , Representing and querying disease networks using graph databases. BioData Min, 2016. 9: p. 23. [DOI] [PMC free article] [PubMed] [Google Scholar]
- [9].Deffur A, et al. , ANIMA: Association network integration for multiscale analysis. Wellcome Open Res, 2018. 3: p. 27. [DOI] [PMC free article] [PubMed] [Google Scholar]
- [10].Hagan T, et al. , Systems vaccinology: Enabling rational vaccine design with systems biological approaches. Vaccine, 2015. 33(40): p. 5294–301. [DOI] [PMC free article] [PubMed] [Google Scholar]
- [11].Thompson WW, et al. , Mortality associated with influenza and respiratory syncytial virus in the United States. JAMA, 2003. 289(2): p. 179–86. [DOI] [PubMed] [Google Scholar]
- [12].Goodwin K, Viboud C, and Simonsen L, Antibody response to influenza vaccination in the elderly: a quantitative review. Vaccine, 2006. 24(8): p. 1159–69. [DOI] [PubMed] [Google Scholar]
- [13].Osterholm MT, et al. , Efficacy and effectiveness of influenza vaccines: a systematic review and meta-analysis. Lancet Infect Dis, 2012. 12(1): p. 36–44. [DOI] [PubMed] [Google Scholar]
- [14].Team, H.-C.S.P. and H.-I. Consortium, Multicohort analysis reveals baseline transcriptional predictors of influenza vaccination responses. Sci Immunol, 2017. 2(14). [DOI] [PMC free article] [PubMed] [Google Scholar]
- [15].Bhattacharya S, et al. , ImmPort, toward repurposing of open access immunological assay data for translational and clinical research. Sci Data, 2018. 5: p. 180015. [DOI] [PMC free article] [PubMed] [Google Scholar]
- [16].Clough E and Barrett T, The Gene Expression Omnibus Database. Methods Mol Biol, 2016. 1418: p. 93–110. [DOI] [PMC free article] [PubMed] [Google Scholar]
- [17].Croft D, et al. , The Reactome pathway knowledgebase. Nucleic acids research, 2014. 42(D1): p. D472–D477. [DOI] [PMC free article] [PubMed] [Google Scholar]