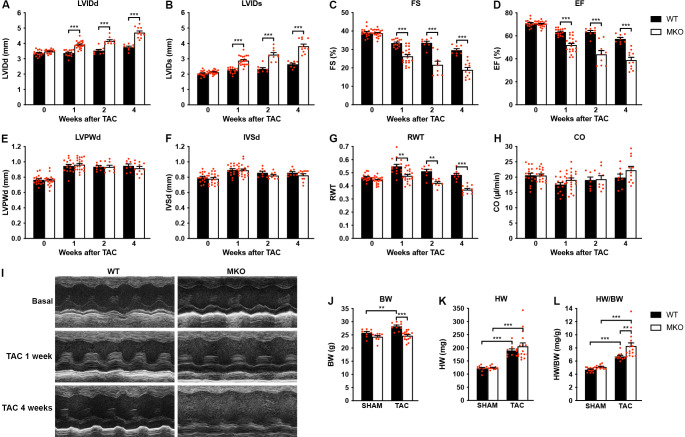
Figure 4. Echocardiographic analyses of wild-type (WT) and myopalladin knockout (MKO) mice following transaortic constriction (TAC).
(A–H) Echocardiography analyses of WT and MKO male mice under basal conditions and 1, 2, and 4 weeks after TAC. Pressure gradient >70 mmHg. LVID, left ventricular inner diameter; FS, fractional shortening; EF, ejection fraction; LVPW, left ventricular posterior wall thickness; IVS, interventricular septum thickness; RWT, relative wall thickness ((LVPWd + IVSd)/LVIDd); CO, cardiac output; d, diastole; s, systole. Data are represented as mean ± standard error of the mean (SEM) (n = 8–19 per group). **p < 0.01; ***p < 0.001; linear mixed model (LMM) with Bonferroni’s multiple comparison test. (I) Representative echocardiographic short-axis M-mode images from hearts of WT and MKO male mice under basal conditions and 1 and 4 weeks after TAC. (J–L) Body weight (BW) (J), heart weight (HW) (K), and heart weight to body weight ratio (HW/BW) (L) of WT and MKO male mice 4 weeks after TAC or SHAM surgery. Data are represented as mean ± SEM (n = 9–11 per group). **p < 0.01; ***p < 0.001; two-way analysis of variance (ANOVA) with Bonferroni’s multiple comparison test.

