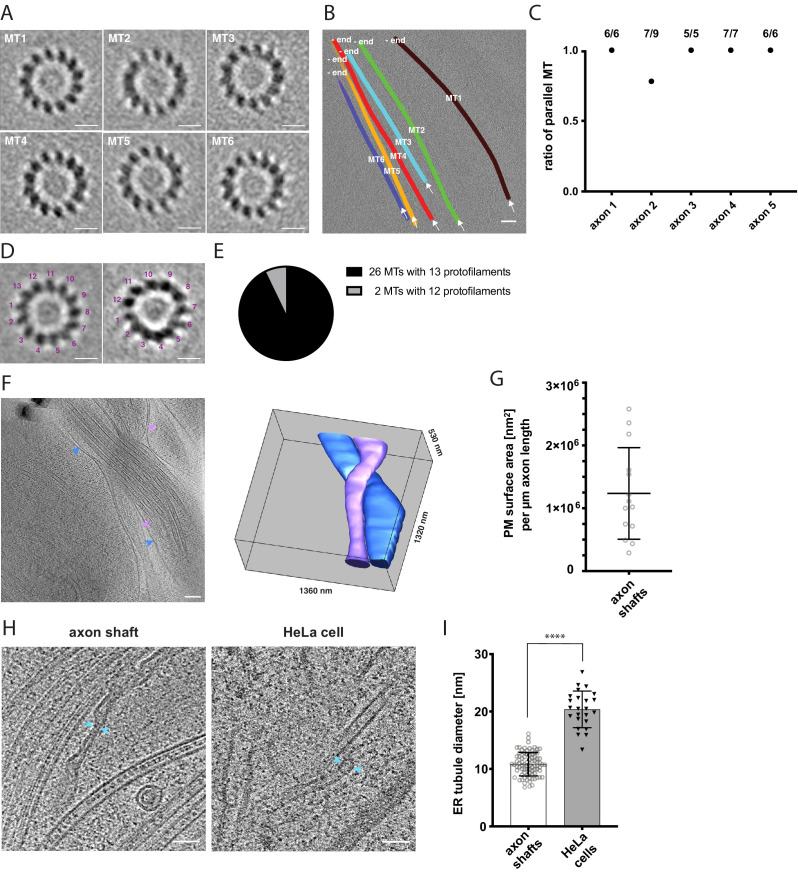
Figure 3. Cytoskeletal and membrane architecture of developing axon shafts.
(A) Axial views of subtomogram averages reveal the polarity of each microtubule (MT) shown in B. The directionality of the microtubule was determined from the radial tilt of the protofilaments seen in axial views (Sosa and Chrétien, 1998). (B) Tomographic slice with six microtubules depicted as differently colored tubes (MT1-MT6) (same tomogram as shown in Figure 2B, ‘no GFP’ panel). Arrows indicate the viewing direction of the axial views of subtomogram averages shown in A. The -end of each microtubule is indicated, determined by the analysis shown in A. (C) Ratio of parallel microtubules determined by subtomogram averaging in five different axons (6–9 individual microtubules per axon). Axon one is depicted in A. and B. (D) Axial view on subtomogram average examples of individual microtubules with 13 protofilaments (left) and with 12 protofilaments (right). (E) Occurrence of microtubules with 12 and 13 protofilaments, determined by individual subtomogram averaging of 28 microtubules as shown in D. (F) Virtual tomographic slice and the corresponding segmentation model of the plasma membrane of two individual axon shafts. Blue and magenta arrows indicate plasma membrane segments visible in the virtual tomographic slice. (G) Plasma membrane (PM) surface area measurements in nm2 normalized to the length in µm of 14 axon shafts captured in 12 tomograms. (H) The curvature of ER tubules is higher in axon shafts than in HeLa cells. Arrows indicate the shortest distance between the membrane bilayer cross sections. (I) Diameters of the thinnest ER tubules measured in axon shafts and in HeLa cells (82 and 24 measurements, respectively). Welch’s t test was employed for statistical analysis: p < 0.0001. Scale bars: 10 nm in A. and D., 100 nm in B. and F., 50 nm in H.


