Abstract
Photoacoustic tomography (PAT) is an emerging biomedical imaging technology that can realize high contrast imaging with a penetration depth of the acoustic. Recently, deep learning (DL) methods have also been successfully applied to PAT for improving the image reconstruction quality. However, the current DL-based PAT methods are implemented by the supervised learning strategy, and the imaging performance is dependent on the available ground-truth data. To overcome the limitation, this work introduces a new image domain transformation method based on cyclic generative adversarial network (CycleGAN), termed as PA-GAN, which is used to remove artifacts in PAT images caused by the use of the limited-view measurement data in an unsupervised learning way. A series of data from phantom and in vivo experiments are used to evaluate the performance of the proposed PA-GAN. The experimental results show that PA-GAN provides a good performance in removing artifacts existing in photoacoustic tomographic images. In particular, when dealing with extremely sparse measurement data (e.g., 8 projections in circle phantom experiments), higher imaging performance is achieved by the proposed unsupervised PA-GAN, with an improvement of ∼14% in structural similarity (SSIM) and ∼66% in peak signal to noise ratio (PSNR), compared with the supervised-learning U-Net method. With an increasing number of projections (e.g., 128 projections), U-Net, especially FD U-Net, shows a slight improvement in artifact removal capability, in terms of SSIM and PSNR. Furthermore, the computational time obtained by PA-GAN and U-Net is similar (∼60 ms/frame), once the network is trained. More importantly, PA-GAN is more flexible than U-Net that allows the model to be effectively trained with unpaired data. As a result, PA-GAN makes it possible to implement PAT with higher flexibility without compromising imaging performance.
1. Introduction
As a non-invasive multi-scale biomedical imaging technique that enables image deep tissues with high contrast, photoacoustic tomography (PAT) has become a new powerful pre-clinical and clinical tool [1–6]. Briefly, to implement PAT, a biological object is first illuminated by short optical pulses and excited photoacoustic (PA) wave signal is then detected by ultrasound probes [7,8]. A photoacoustic image is subsequently generated by reconstruction methods, e.g., universal back-projection (UBP) or time reversal (TR) methods [9,10]. However, in practice, ultrasound probes have limited detection bandwidths and finite apertures which hinder the acquisition of complete original waveform signals. Due to the use of sparsely sampled data, artifacts are inevitably introduced into the reconstructed PAT images, which leads to the problems of image blur, distortion, and low resolution. Consequently, the reconstruction methods are important for PAT and directly affect the imaging performance. However, the reconstruction of PAT is a challenging task for most clinical applications because of the under-sampled data and inexact inverse model [11].
To address the problems, a serial of techniques including physical hardware and reconstruction method optimization has been studied. For instance, acoustic deflectors [12], bowl transducer arrays [13,14], and full-view ring transducer arrays [15,16] have been used to resolve the limited-view issue. Although these techniques can effectively improve the imaging quality of PAT and make it available in pre-clinical and clinical studies, there are still some inconveniences in practice, e.g., high cost and system complexity. On the other hand, the imaging performance of PAT can also be improved by optimizing reconstruction method. Based on the strategy, various reconstruction methods, e.g., weighted-factor [17], iterative-based back-projection [18], and compressed-sensing (CS) [19], have been explored to boost the imaging performance. It is noteworthy that these reconstruction methods generally require accurate prior knowledge (e.g., absorption coefficient and sound velocity in tissue) to implement high-quality PAT [20]. However, prior knowledge is difficult to obtain accurately in real experiments. In addition, these methods are computationally intensive and time consuming.
Recently, deep learning (DL) has been increasingly applied in bio-medical imaging fields. At the same time, DL-based methods have also been used to implement PAT from the raw PA waves directly, or remove the artifacts caused by using under-sampled and limited-view measurement data [21–31]. In [21], Waibel et al. designed an U-Net to reconstruct PAT images from the synthetic waveform data of a simple circular phantom. Furthermore, Tong et al. trained an FPNet to implement signal-to-image transformation with in vivo data [24]. Shan et al. utilized the modified U-Net to complete the correction of reflection artifacts in PAT images [26]. Davoudi et al. proposed an U-Net trained with both simulation and realistic data to enhance the imaging quality of sparse PA data [28]. Guan et al. introduced an FD-UNet to decrease the artifacts existing in sparse data [30]. Meanwhile, Vu et al. [31] designed a WGAN-GP to further remove the artifacts in phantom and in vivo data. Note that in the above works, these DL-based methods request the paired data for training. However, it is impractical to collect extensive ground-truth images in experiments, and the model trained with simulation data usually cannot gain impressive results.
Generative adversarial network (GAN) is an effective unsupervised DL method [32–34]. In recent years, it has gained significant attention in handling with multimodal medical imaging data [35]. Various frameworks of GAN, e.g., deep convolutional GAN (DCGAN), Laplacian GAN (LAPGAN), Pix2Pix, CycleGAN, etc., have been successfully used in medical tasks such as image augmentation [36], image registration [37], image generation [38], image reconstruction [39], and image-to-image translation [40]. Inspired by these works, in this paper, we propose an unsupervised DL method based on CycleGAN (termed as PA-GAN) to improve the image quality in PAT, i.e., to remove the artifacts in PAT images caused by using the limited-view measurement data. To evaluate the performance of the proposed PA-GAN method, a series of data from phantom and in vivo experiments are used. Especially, PA-GAN is trained with the mixed phantom and in vivo PAT images, which is helpful for learning the authentic effective features. The experimental results show that PA-GAN provides good performance in removing artifacts existing in PAT images. In particularly, when dealing with extremely sparse data (e.g., 8 projections in circle phantom experiments), higher imaging performance is achieved, with an improvement of ∼14% in SSIM and ∼66% in PSNR, compared with the supervised-learning method (e.g., U-Net). With an increasing number of projections (e.g., 128 projections), U-Net, especially FD U-Net, provide a slight improvement in artifact removal capability, in terms of SSIM and PSNR. Furthermore, the computational time (∼60 ms/frame) obtained by PA-GAN is similar to that obtained by U-Net, once the network is trained. More importantly, PA-GAN is more flexible that allows the model to be trained with unpaired data. As a result, PA-GAN makes the possibility of implementing PAT with higher flexibility, without compromising the imaging performance.
The rest of the paper is organized as follows. Section 2 describes the proposed methodology including network architecture, loss function, training strategy, and training dataset. In Section 3, the corresponding results are presented and analyzed. Finally, discussion and conclusion regarding this study are drawn in Section 4.
2. Methods
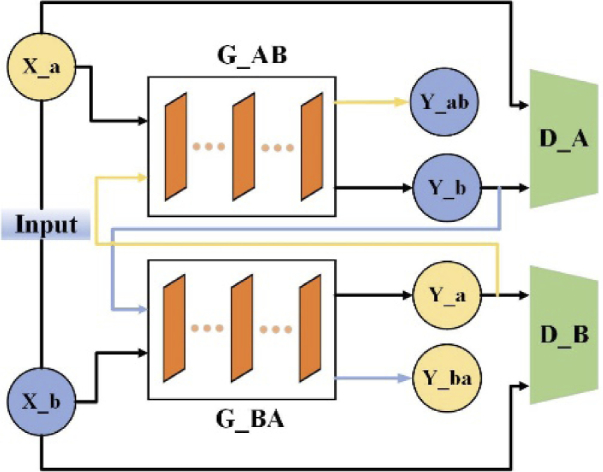
PAT can be treated as an image-to-image translation problem, which provides the potential in converting artifact images to high-quality artifact-free images [42–45]. Recently, the cyclic generative adversarial network (CycleGAN) has been successfully used to realize high-resolution image-to-image translation by using unpaired natural images [41]. Inspired by this work, here our network is designed based on the framework of CycleGAN to improve the image quality in PAT (remove the artifacts in PAT images) in an unsupervised-learning way. Briefly, the network consists of two generators, where the generator G_AB transfers the images in the domain A (limited-view photoacoustic tomographic images) to the domain B (full-view photoacoustic tomographic images), and another generator G_BA realizes the opposite transformation. Correspondingly, the model has two discriminators, namely D_A and D_B, which are used to identify the domain of the image. Also, a cycle training procedure is used in this work. In detail, the sparse image in domain A can be translated to the fake image in domain B. Then, the fake image as the input of G_BA can be recovered to fake sparse data. This cycle facilitates the dual learning of the model and the unsupervised training way. To further improve the image quality, a multi-scale learning, an attention mechanism, and a modified cycle-consistency loss are integrated into the network. In addition, a new two-stage training strategy is also proposed to improve the imaging performance in extremely sparse data conditions, and to accelerate model stable convergence [46]. The main framework of the unsupervised domain transformation network is shown in Fig. 1.
Fig. 1.
Schematic diagram depicting the overall structure of domain transformation network (PA-GAN). PA-GAN uses two generators to achieve the translation between two image domains. The generator translating limited-view photoacoustic tomographic images (domain A) to full-view photoacoustic tomographic images (domain B) is termed as G_AB. The generator achieving the opposite translation is termed as G_BA. The artifact image in domain A, X_a is fed into G_AB to generate the fake artifact-free image (Y_b) in domain B. Y_b as the input of G_BA is cyclically translated into a fake image (Y_ba) in domain A. For the image in domain B, the network executes the same operations. The output of generators passes through the corresponding discriminators to identify the domain of the image.
2.1. Network architecture
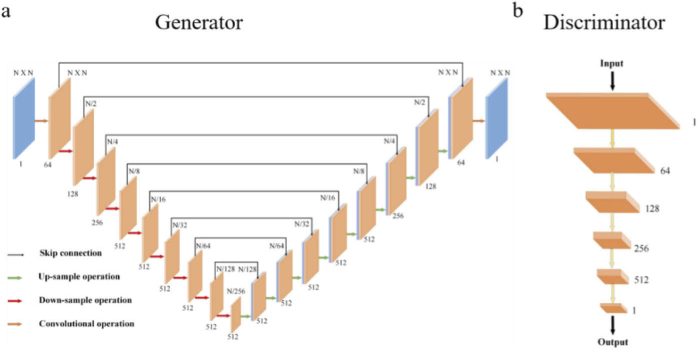
For the generator, we adopt the U-Net convolutional framelet, which is helpful to extract underlying features. In detail, the network consists of four parts, i.e., the head layer, the down-sampling attention block, the up-sampling block, and the tail layer. The first head layer contains one convolution with a 5 × 5 kernel for extracting shallow features. There are eight down-sampling attention blocks including the multi-scale attention layer to complete the down-sampling operation. A convolution with a 4 × 4 kernel and a 2 × 2 stride, a multi-scale attention layer, an instance normalization, and a rectified linear unit (ReLU) are stacked sequentially in each block. Then, the corresponding up-sampling blocks follow to enlarge the feature map. Each up-sampling block contains a transposed convolution with kernel 4 and stride 2, an instance normalization, and a ReLU. Moreover, the skip-connection is used between the feature in the down-sampling operation and the feature in the up-sampling operation with the same size. At the end, the last convolutional layer maps the feature to a single-channel output image.
As for the discriminator, PatchGAN [33] is utilized to classify whether the image patches are real or fake. PatchGAN treats structure at the scale of patches, which enables the network to learn the structural information of images more effectively and takes less memory. In the discriminator, four repeated blocks containing convolution with a 4 × 4 kernel and strides of 2, an instance normalization and a leaky ReLU with a slope of 0.2 are stacked to get the features of batches. At the final step of the architecture, a 4 × 4 convolution layer with a 1 × 1 stride is added to generate a single-channel prediction map. The overview of the proposed model structure is illustrated in Fig. 2.
Fig. 2.
The network architecture of the generator and discriminator. (a) The structure of the generator network. The overall structure is based on U-Net. The red arrows indicate the down-sampling operation. The green arrows represent the up-sampling operation. The orange arrows show the common convolution operation. The number means the channel of the current feature map. N is the size of the input. The generator consists of eight down-sampling attention blocks to complete down-sampling. In this block, every down-sampling layer is followed by a multi-scale attention layer, an instance normalization, and a ReLU sequentially to improve the feature extracting ability and avoid overfitting of the network. The eight up-sampling sections are used to increase the size of the feature map. Each up-sampling section contains a transposed convolution with a 4 × 4 kernel and a 2× 2 stride, an instance normalization, and a ReLU. Skip connections are used to share data between the layers of the same level, see the black arrows. These skip connections concatenate the output of the down-sampling layer with the corresponding up-sampling feature map. (b) The structure of the discriminator network. It comprises five down-sampling blocks, each of which has a convolution layer with a kernel of 4 to reduce the feature size. The first four down blocks reduce the size of the images while increasing the number of channels to 512. The last convolution layer outputs the single-channel feature map to provide the ultimate output of D.
Attention mechanism has been successfully adopted in image processing tasks. Rather than treating the entire image on the same level, the attention mechanism enables the model to focus on the most relevant part of images or features. The generator combined with the attention mechanism focuses on the informative regions of input and extracts important features from images to produce the desired output. Considering that PAT images in an experiment are generally large and imaging objects are complex, a modified multi-scale attention method is employed to extract informative features [47,48]. Figure 3 shows the multi-scale attention layer. Here, different scale features can be obtained through convolution operation with different receptive fields (1 × 1, 3 × 3, 5 × 5). Then, the different scale features are used as the input of the Channel Attention layer to extract the important and more expressive multi-scale attention features. Finally, the features of four branches are concatenated to get the feature map of the current down-sampling attention block. The details of the multi-scale attention layer are depicted in Fig. 3.
Fig. 3.
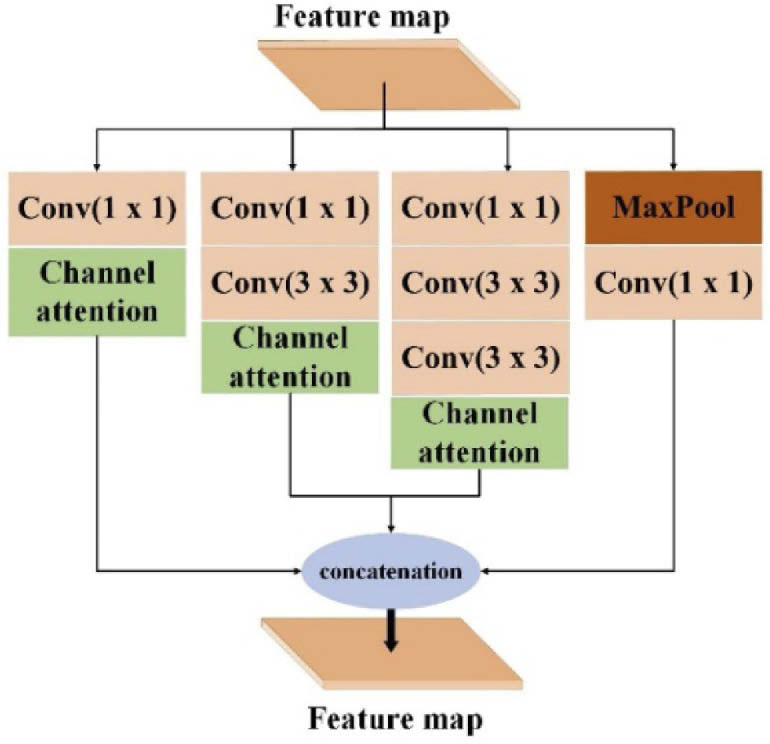
The details of the multi-scale attention layer. This layer is incorporated into each down-sampling attention block. The feature map through the previous down-sampling operation as input is fed into this layer. This layer contains four branches, which each branch extracts different scale features by convolutions with a different receptive field, i.e., 1 ×1, 3 × 3, and 5 × 5. Then, the attention features through the channel attention layer of all branches are concatenated to get the final feature map of the current down-sampling operation.
2.2. Loss function
Adversarial loss plays a vital role in a generative adversarial network. In this work, according to [34], the least-squares loss function and the a-b coding scheme are used. Here, a and b are the labels for fake data and real data respectively. The modified functions for adversarial loss can be defined as follows,
| (1) |
| (2) |
where means the data distribution. x and y represent the PAT images in domain A and domain B, respectively. G denotes the generator transforming image in domain A to image in domain B. is the translated fake image through G. D is the discriminator distinguishing the batches between translated sample and real sample y. In this work, b is set to 1, a is set to 0, and c is set to 1 according to [34].
With the great capability, the GAN network can realize that the learned mapping transforms the image in domain A to image with any random distribution in domain B. While, the adversarial loss alone cannot overcome this limitation, and cannot guarantee the learned function with the desired output. Ideally, each image in domain A should be translated to an image in domain B with similar distribution, which means two images with the same imaging object but different backgrounds. To further improve the stability and precision of the network, cycle consistency loss is introduced [41]. According to this, cycle consistency loss measures the difference between the original image and the generated image after cyclic conversion by generators. Then, the modified functions for cycle consistency loss can be expressed as follows,
| (3) |
where denotes the generator transforming image in domain B to image in domain A. and is the translated fake images in domain B and domain A. is the structure similar index between the images. and represent the weight coefficients. Referring to [49], here, and .
2.3. Dataset
The experimental data used in this study are acquired from https://doi.org/10.6084/m9.figshare.9250784 [28]. The dataset includes the full-view and limited-view photoacoustic tomographic images of in vivo mouse and phantoms (circular and vessel-like), which are firstly collected by photoacoustic setup consisted of an 80 mm diameter ring detection array with 512 individual detection elements. After that, the acquired measurement data are reconstructed by universal back-projection (UBP) method to obtain the corresponding photoacoustic tomographic images. The detailed information can be found in [28].
In this work, the training dataset consists of two image domains. Domain A contains 3,500 limited-view photoacoustic tomographic images from the phantom (circular and vessel phantom) and in vivo mouse data. And domain B contains 600 full-view photoacoustic tomographic images from the phantom (circular and vessel phantom) and in vivo mouse data. Specifically, in domain A, there are 2,258 limited-view tomographic images of circle phantom reconstructed from 8 to 128 projections (about 450 images in each type of 8, 16, 32, 64, and 128 projections), 327 limited-view tomographic images of vessel phantom reconstructed from 16 to 128 projections (about 80 images in each type of 16, 32, 64, and 128 projections), and 915 limited-view tomographic images of mice reconstructed from 16 to 128 projections (about 180 images in each type of 16, 32, 64, 128, and 256 projections). For domain B (i.e., targets), there are totally 600 full-view tomographic images reconstructed from 512 projections, where 334 images of circle phantom, 77 images of vessel phantom, and 189 images of mice are randomly selected and used. Due to the poor image quality in the vessel-phantom and mouse data caused by using the extremely sparse measurement data (e.g., 8 projections), these images are not included in the above training set. For the details about the phantom and in vivo imaging experiments, please refer to [28]. Table 1 summarizes the information of the dataset used in this work.
Table 1. The detail information of dataset used in this work.
| Imaging object | Domain A | Domain B |
|---|---|---|
| Circular phantom | 2,258 limited-view photoacoustic images reconstructed by UBP from 8/16/32/64/128 projections | 334 full-view photoacoustic images reconstructed by UBP from 512 projections |
| Vessel phantom | 327 limited-view photoacoustic images reconstructed by UBP from 16/32/64/128 projections | 77 full-view photoacoustic images reconstructed by UBP from 512 projections |
| Mouse | 915 limited-view photoacoustic images reconstructed by UBP from 16/32/64/128/256 projections | 189 full-view photoacoustic images reconstructed by UBP from 512 projections |
2.4. Training
During the training stage, the mini-batch size is set to 4 and the initial learning rate is 6e-4. To make the training effectively and stably converge, the learning rate is kept as the initial learning rate in the first 50 epochs, then is linearly decayed to zero over the last 50 epochs. Adam optimization algorithm is used for training. The training round is set to 100 for each stage. To further improve the performance in extremely sparse data conditions (e.g., 8 projections), we introduce a new two-stage training strategy. In the first stage, the network is trained on various projections data, which can achieve more representative features and get the effective weights of the network. For the second stage, based on the weights obtained by the first stage, the final network is trained only with low projections data to enhance the reconstruction effect of low projection data.
3. Results
3.1. Phantom experimental data
3.1.1. Circle phantom
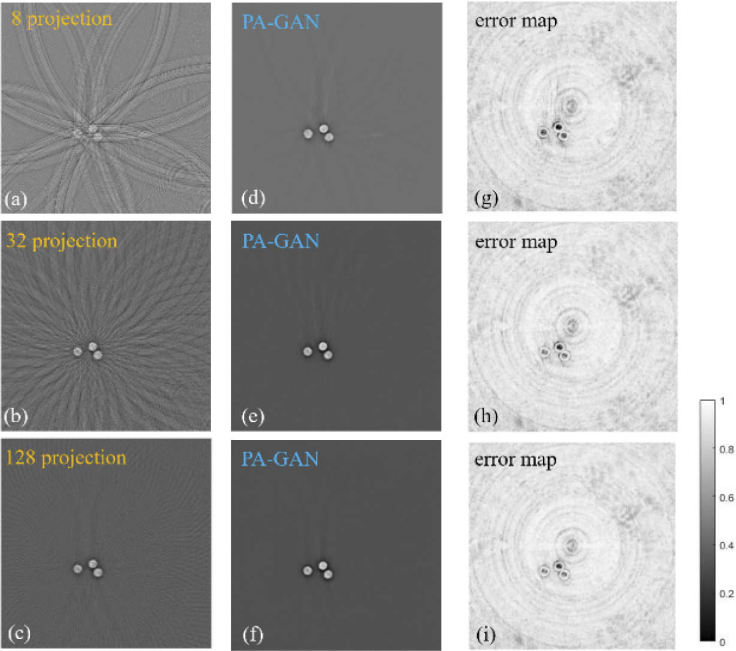
Figure 4 demonstrates the capability of PA-GAN in removing the artifacts that exist in the rreconstructed photoacoustic tomographic images, which are caused by using limited-view measurement data in reconstruction processing. Figures 4(a)-(c) show the reconstructed PAT images from the limited-view measurement data (8, 32, and 128 projections), which are obtained by the UBP method. Comparably, Figs. 4(d)-(f) show the corresponding artifact removal images obtained by PA-GAN. Furthermore, Figs. 4(g)-(i) show the error maps between the full-view PAT images and the recovered PAT by PA-GAN. Here, the full-view PAT images are obtained by UBP with 512 projections.
Fig. 4.
The photoacoustic tomographic results of the circle phantom obtained by PA-GAN in the limited-view measurement data conditions. Note that these test data are not included in the training phase. (a)-(c) The limited-view tomographic images of circle phantom reconstructed by UBP method with 8, 32, and 128 projections. (d)-(f) The recovered images by PA-GAN corresponding to (a)-(c), respectively. (g)-(i) The error maps between the recovered images by PA-GAN and the full-view tomographic images reconstructed by UBP with 512 projections.
The experimental results show that when using the limited-view measurement data, the artifacts exist in the reconstructed PAT images by UBP. Comparably, when using the proposed PA-GAN method, we can observe that there is an obvious improvement in image quality, especially under the extremely sparse measurement data (e.g., 8 and 32 projections) conditions. That means, the unsupervised PA-GAN model provides feasibility of implementing high-quality PAT, even if using highly sparse measurement data.
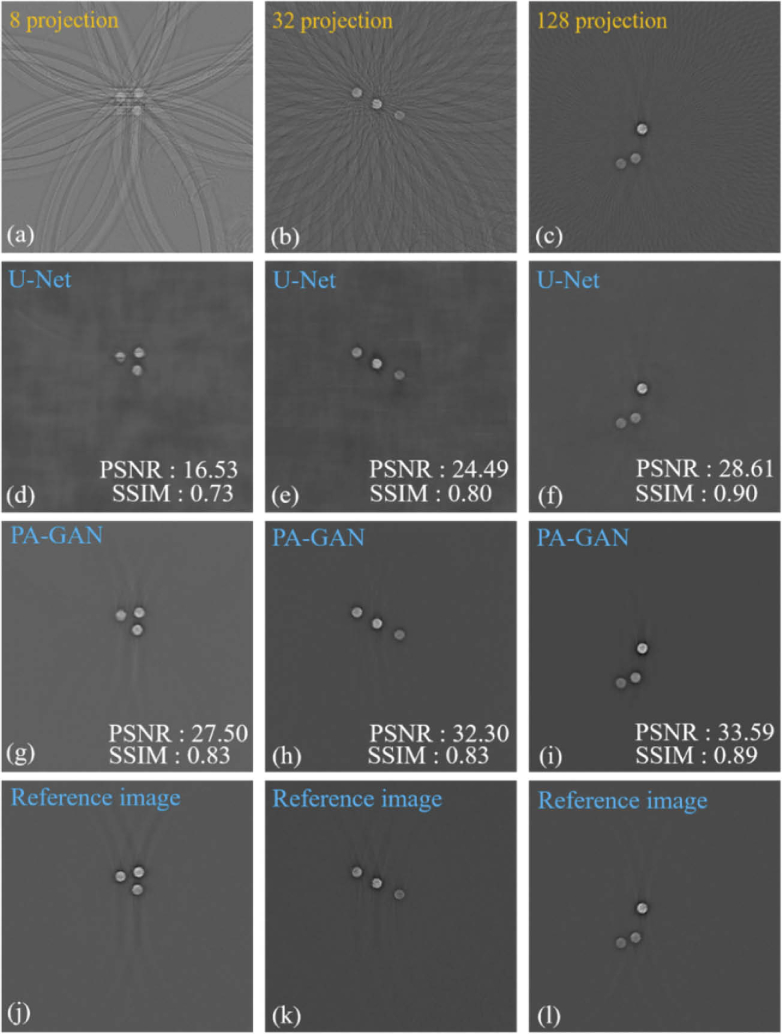
To further demonstrate the performance of the proposed PA-GAN method in removing the artifacts, Fig. 5 compares the photoacoustic tomographic images recovered by PA-GAN and a supervised-learning method (U-Net). The 1st row of Fig. 5 shows the tomographic images reconstructed by UBP with 8, 32, and 128 projections. Comparably, the 2nd and 3rd rows of Fig. 5 show the tomographic images recovered by U-Net and PA-GAN, respectively. The 4th row of Fig. 5 shows the reference images. Here, the full-view photoacoustic images reconstructed by UBP with 512 projections are used as the reference images. In this work, U-Net is implemented by a standard network structure, which can be downloaded from https://github.com/Andy-zhujunwen/UNET-ZOO. U-Net is trained with the same dataset described in Section 2.3. But, these data (totally 3,500) must be paired when performing U-Net. To quantitatively evaluate the performance of PA-GAN, in this work, the structural similarity (SSIM) and peak signal to noise ratio (PSNR) are calculated and the corresponding quantitative results are shown.
Fig. 5.
The comparison results of the photoacoustic tomographic images obtained by the supervised-learning method (U-Net) and the proposed unsupervised-learning method (PA-GAN) in the circle phantom model. (a)-(c) The tomographic images of the circle phantom reconstructed by UBP with 8, 32, and 128 projections. (d)-(f) The recovered PAT images corresponding to (a)-(c) with U-Net. (g)-(i) The recovered PAT images with PA-GAN, respectively. (j)-(l) The reference images obtained by UBP with 512 projections.
The experimental results show that when dealing with the extremely sparse data (e.g., 8 projections) condition, a higher imaging performance can be achieved by PA-GAN, with an improvement of ∼14% in SSIM and ∼66% in PSNR, compared with U-Net. With an increasing number of projections (e.g., 128 projections), PA-GAN and U-Net show the similarity in identifying the structural information, in terms of SSIM. But, PA-GAN provides a higher PSNR ability, with a PSNR of 33.59 dB (PA-GAN) compared to 28.61 dB (U-Net).
3.1.2. Vessel phantom
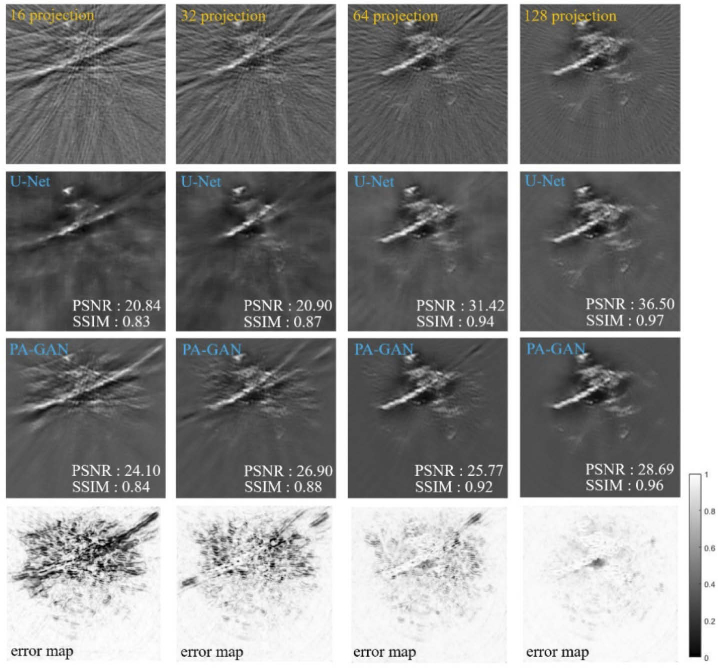
Figure 6 compares the artifact removal capability in imaging the complex vasculature phantom between PA-GAN and U-Net. To demonstrate the flexibility of PA-GAN, the imaging results in different projections are shown. The 1st row of Fig. 6 shows the limited-view tomographic images reconstructed by UBP with 16, 32, 64, and 128 projections, respectively, which are used as the input of the DL methods (PA-GAN and U-Net). The 2nd row of Fig. 6 represents the artifact removal images recovered by U-Net. Comparably, the 3rd row of Fig. 6 shows the artifact removal images recovered by PA-GAN. The last row of Fig. 6 shows the difference between the reference image (photoacoustic tomographic image reconstructed by UBP with 512 projections) and result recovered by PA-GAN.
Fig. 6.
The comparison of the artifact removal capability between U-Net and PA-GAN in the vessel phantom model. The first row shows the limited-view tomographic images of the complex vessel phantom reconstructed by UBP method with the varying number of projections (16, 32, 64, and 128). The 2nd and 3rd rows represent the corresponding artifact removal images obtained by U-Net and PA-GAN, respectively. The last row shows the error map between the recovered images by PA-GAN and the full-view tomographic images reconstructed by UBP with 512 projections. Note that these test images are not included in the training phase.
The experimental results further demonstrate that the unsupervised PA-GAN method can effectively remove the artifacts appeared in the tomographic images, in terms of SSIM and PSNR indicators. Even if under the extremely spare data condition (e.g., 16 projections), high SSIM (0.84) and PSNR (24.1 dB) indicators can also be obtained. With the increasing number of projections (views), the imaging performance can be further improved. But there are still some serious artifacts in PA-GAN image (e.g., artifacts in the bottom of PA-GAN images), which may be caused by the absence of target matching in the unsupervised network training phase. In addition, we can also observe that with an increasing number of projections (e.g., 64 and 128 projections), U-Net provides a slight improvement in artifact removal capability, in terms of SSIM and PSNR indictors.
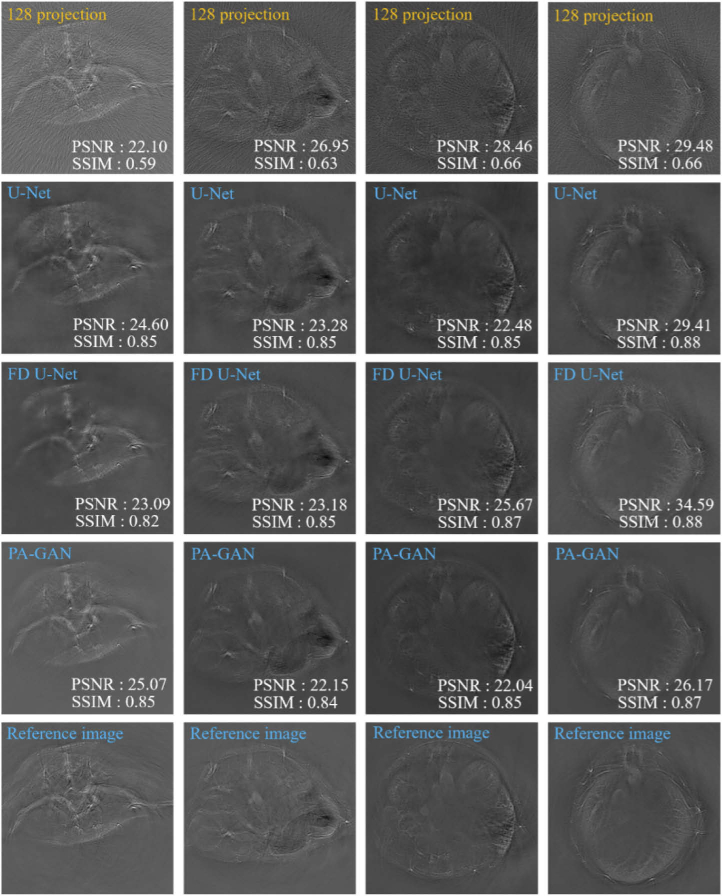
3.2. In vivo experimental data
Figure 7 demonstrates the artifact removal capability of PA-GAN in in vivo mouse experiments. The 1st row of Fig. 7 shows different cross-sectional images from the mouse abdomen reconstructed by UBP with 128 projections. From these images, we can see that the obvious artifacts exist in these reconstructed images. Comparably, the 2nd-4th rows of Fig. 7 show the photoacoustic images recovered by U-Net, FD U-Net, and PA-GAN, respectively. Especially, to further demonstrate the artifact removal capability of PA-GAN, in in vivo mouse experiments, we compare PA-GAN with a new network framework (FD U-Net). Here, FD U-Net is implemented by reproducing network structure described in [30]. Briefly, a series of four-layer dense blocks are added to U-Net instead of a sequence of two 3 × 3 convolution operations to learn feature maps. In each dense block, earlier convolutional layers are connected to all subsequent layers by channel-wise concatenation to increase the representation ability of the network. FD U-Net is trained with the same dataset and hyperparameters as U-Net. Similarly, these training data must be paired.
Fig. 7.
The photoacoustic tomographic results of in vivo mouse recovered by PA-GAN, U-Net, and FD U-Net, respectively. The 1st row shows different cross-sectional photoacoustic images from the mouse abdomen reconstructed by UBP with 128 projections. The 2nd-4th rows show the artifact removal images recovered by U-Net, FD U-Net, and PA-GAN, respectively. The last row shows the reference images obtained by UBP with 512 projections.
The experimental results further confirm the recovering capability of PA-GAN in vivo, where artifact can be effectively removed (see the 4th row of Fig. 7). In addition, we can also observe that under 128-projection condition, U-Net, especially FD U-Net, provide a slight improvement in artifact removal capability, in terms of SSIM and PSNR indicators. On the other hand, it can also be found that the PSNR values calculated from UBP is high in some cases. It is not surprising since PSNR may not be enough in evaluating image quality [53].
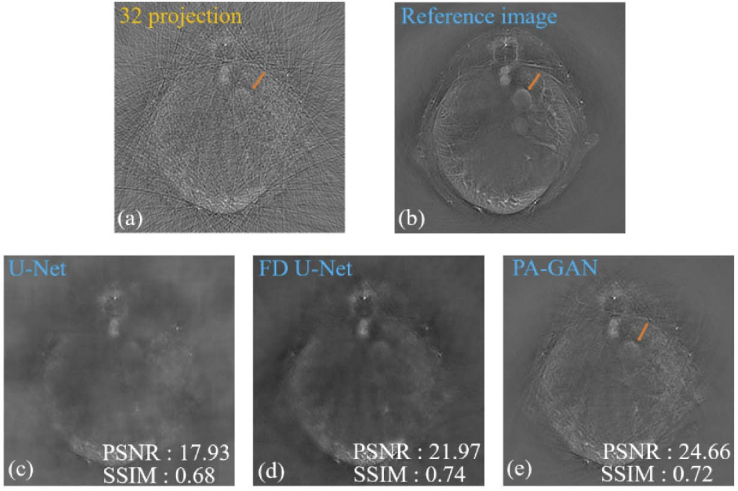
Figure 8 further demonstrates the artifact removal performance among PA-GAN, U-Net, and FD U-Net under the extreme sparse data (32 projections) condition. Figures 8(a) and (b) show the limited-view and full-view photoacoustic tomographic images reconstructed by UBP with 32 and 512 projections, respectively. Figures 8(c)-(e) show the artifact removal photoacoustic images obtained by U-Net, FD U-Net, and PA-GAN, respectively. The experimental results show that comparing to the reconstructed image by UBP (see Fig. 8(a)), after artifact removal by PA-GAN, some internal structures in in vivo mouse abdomen can be resolved (see the orange arrows shown in Figs. 8(a), (b), and (e)), although there are still a few artifacts around it. In addition, compared to U-Net, PA-GAN again shows higher values in SSIM and PSNR in the recovered images, indicating a better capability of removing artifacts. Furthermore, FD U-Net provides the highest SSIM value, where SSIM is increased by 0.02 compared to PA-GAN. However, it should be pointed out that the unpaired data can be used when performing PA-GAN, which cannot be realized by the supervised learning-based methods (U-Net and FD U-Net). It greatly extends the flexibility of PA-GAN in practical applications.
Fig. 8.
The comparisons of the artifact removal capability among U-Net, FD U-Net, and PA-GAN in in vivo mouse experiments. (a) The limited-view cross-sectional image of the mouse abdomen obtained by UBP with 32 projections. (b) The reference image obtained by UBP with 512 projections. (c) and (d) The artifact removal photoacoustic tomographic images recovered by supervised-learning method (U-Net and FD U-Net), respectively. (e) The artifact removal photoacoustic tomographic images recovered by the proposed unsupervised-learning method (PA-GAN). The orange arrows represent the recovered internal structures in the mouse abdomen after artifact removal by PA-GAN.
3.3. Computational time
The computational time is another important aspect that should be considered when evaluating the overall performance of PA-GAN. To effectively calculate computational time, 300 artifact images with the size of 512 × 512 are used, which contain 100 images selected randomly from circle phantom, 100 images selected randomly from vessel phantom, and 100 images selected randomly from in vivo mouse images, respectively. Furthermore, the training times are also compared. In this work, the computation is performed on the same server, equipped with an NVidia Tesla V100 GPU (16 GB RAM), 2 Intel Xeon Gold 6130 (2.1GHZ), and 192 G DDR4 REG ECC.
Table 2 summarizes the computational cost (including implementation time and training time) of U-Net, FD U-Net and PA-GAN. The results indicate that the training time of PA-GAN is higher than that of U-Net and FD U-Net. Once the network is trained, the implementation time is similar.
Table 2. Comparisons of computational time obtained by U-Net, FD U-Net, and PA-GAN, respectively.
| Methods | Implementation time |
Training time | ||
|---|---|---|---|---|
| Circle phantom (512 × 512) | Vessel phantom (512 × 512) | In vivo mouse (512 × 512) | ||
| U-Net | ∼ 60 ms | ∼ 60 ms | ∼ 60 ms | ∼ 15 h |
| FD U-Net | ∼ 70 ms | ∼ 80 ms | ∼ 80 ms | ∼ 18 h |
| PA-GAN | ∼ 50 ms | ∼ 50 ms | ∼ 60 ms | ∼ 35 h |
4. Conclusion
Photoacoustic tomography (PAT) enables image multi-scale objects with a high contrast, high resolution, and deep penetration, which is helpful for clinic diagnosis and evaluation. However, the conventional PAT reconstruction methods are time consuming and depend on the accuracy design of imaging model. The emerging supervised-learning-based methods improve the reconstruction speed and reduce the dependence on imaging model in PAT. Nevertheless, these methods are inflexible for experiments, specifically for clinical applications, because of the requirement of paired data for training. To eliminate the limitation of the supervised methods, this study proposes an unsupervised domain transformation PAT method based on CycleGAN, termed as PA-GAN.
The experimental results from the phantom and in vivo mouse data demonstrate that PA-GAN can effectively remove the artifacts existing in the photoacoustic tomographic images caused by the use of limited-view measurement data in an unsupervised way (see Figs. 4–8). In the circle phantom, when facing to the extremely sparse measurement data (e.g., 8 projections), an improvement of ∼14% in SSIM and ∼66% in PSNR (see Fig. 5) can be obtained by PA-GAN, compared to the supervised-learning method (U-Net). Similar improvements can also be observed in the complex vessel phantom (see Fig. 6) and in vivo mouse experiments (see Fig. 8). With an increasing number of projections (e.g., 128 projections), U-Net, especially FD U-Net, provide a slight improvement in artifact removal capability, in terms of SSIM and PSNR indicators (see Fig. 6 and Fig. 7). But, PA-GAN allows the network model to be effectively trained with the unpaired data, which cannot be realized by the supervised-learning-based methods. In this way, PAT is not limited to the annotated image data anymore, which greatly extends the flexibility of PA-GAN in applications. As a result, PA-GAN opens the door to realize PAT with the unsupervised way, without compromising the imaging performance.
On the other hand, it should be noted that the limited-view photoacoustic tomographic images can be generated from PA-GAN when the full-view (512 projections) PAT images are fed into the trained model. That means PA-GAN provides a way to generate better simulation data. It may be used for further improving the imaging performance of PAT based on data-driven methods. Furthermore, PA-GAN can enjoy the advantages of DL methods, e.g., it does not need parameter tuning and human intervention once the network is trained.
However, it should be noted that in this work, we assume all limited-view data are in one domain, which may affect the artifact removal capability of PA-GAN. In addition, we can also observe that the artifact removal capability of PA-GAN in vessel phantom seems not be as good as that in in vivo mouse images, which may be caused by the differences in training dataset (e.g., the used image quality in domain B). Furthermore, our current work focuses on artifact removal in PAT, and the direct reconstruction is not considered. Moreover, PA-GAN requires longer training time than U-Net and FD U-Net. Finally, the unsupervised network will directly affect the recovered performance of PAT. This work, as a preliminary study, uses a CycleGAN framework. The artifact removal capability may be further improved by using or developing more unsupervised networks [50–52]. These problems will be further explored in our future work.
In conclusion, PA-GAN as an unsupervised learning method makes it possible to implementation of PAT with higher flexibility without compromising the imaging performance, which greatly extends the flexibility of PA-GAN in pre-clinical and clinical applications.
Funding
National Natural Science Foundation of China10.13039/501100001809 (61871263, 11827808, 12034005); Natural Science Foundation of Shanghai10.13039/100007219 (21ZR1405200, 20S31901300); China Postdoctoral Science Foundation10.13039/501100002858 (2021M690709).
Disclosures
The authors declare no conflicts of interest.
Data availability
Data underlying the results presented in this paper are available at [28].
References
- 1.Jathoul A. P., Laufer J., Ogunlade O., Treeby B., Cox B., Zhang E., Johnson P., Pizzey A. R., Philip B., Marafioti T., Lythgoe M. F., Pedley R. B., Pule M. A., Beard P., “Deep in vivo photoacoustic imaging of mammalian tissues using a tyrosinase-based genetic reporter,” Nat. Photonics 9(4), 239–246 (2015). 10.1038/nphoton.2015.22 [DOI] [Google Scholar]
- 2.Yao J., Wang L., Yang J. M., Maslov K. I., Wong T. T. W., Li L., Huang C. H., Zou J., Wang L. V., “High-speed label-free functional photoacoustic microscopy of mouse brain in action,” Nat. Methods 12(5), 407–410 (2015). 10.1038/nmeth.3336 [DOI] [PMC free article] [PubMed] [Google Scholar]
- 3.Attia A. B. E., Balasundaram G., Moothanchery M., Dinish U. S., Bi R., Ntziachristos V., Olivo M., “A review of clinical photoacoustic imaging: current and future trends,” Photoacoustics 16, 100144 (2019). 10.1016/j.pacs.2019.100144 [DOI] [PMC free article] [PubMed] [Google Scholar]
- 4.Lediju Bell M. A., “Photoacoustic imaging for surgical guidance: principles, applications, and outlook,” J. Appl. Phys. 128(6), 060904 (2020). 10.1063/5.0018190 [DOI] [PMC free article] [PubMed] [Google Scholar]
- 5.Knieling F., Neufert C., Hartmann A., Claussen J., Urich A., Egger C., Vetter M., Fischer S., Pfeifer L., Hagel A., Kielisch C., Görtz R. S., Wildner D., Engel M., Röther J., Uter W., Siebler J., Atreya R., Rascher W., Strobel D., Neurath M. F., Waldner M. J., “Multispectral optoacoustic tomography for assessment of crohn’s disease activity,” N. Engl. J. Med. 376(13), 1292–1294 (2017). 10.1056/NEJMc1612455 [DOI] [PubMed] [Google Scholar]
- 6.Upputuri P. K., Pramanik M., “Recent advances toward preclinical and clinical translation of photoacoustic tomography: a review,” J. Biomed. Opt. 22(4), 041006 (2016). 10.1117/1.JBO.22.4.041006 [DOI] [PubMed] [Google Scholar]
- 7.Beard P., “Biomedical photoacoustic imaging,” Interface Focus 1(4), 602–631 (2011). 10.1098/rsfs.2011.0028 [DOI] [PMC free article] [PubMed] [Google Scholar]
- 8.Manohar S., Razansky D., “Photoacoustics: a historical review,” Adv. Opt. Photonics 8(4), 586–617 (2016). 10.1364/AOP.8.000586 [DOI] [Google Scholar]
- 9.Treeby B. E., Zhang E. Z., Cox B. T., “Photoacoustic tomography in absorbing acoustic media using time reversal,” Inverse Probl. 26(11), 115003 (2010). 10.1088/0266-5611/26/11/115003 [DOI] [Google Scholar]
- 10.Xu M., Wang L. V., “Universal back-projection algorithm for photoacoustic computed tomography,” Proc. SPIE 71, 1 (2005). 10.1103/PhysRevE.71.016706 [DOI] [PubMed] [Google Scholar]
- 11.Choi W., Oh D., Kim C., “Practical photoacoustic tomography: realistic limitations and technical solutions,” J. Appl. Phys. 127(23), 230903 (2020). 10.1063/5.0008401 [DOI] [Google Scholar]
- 12.Huang B., Xia J., Maslov K., Wang L. V., “Improving limited-view photoacoustic tomography with an acoustic reflector,” J. Biomed. Opt. 18(11), 110505 (2013). 10.1117/1.JBO.18.11.110505 [DOI] [PMC free article] [PubMed] [Google Scholar]
- 13.Lin L., Hu P., Tong X., Na S., Cao R., Yuan X. Y., Garrett D. C., Shi J. H., Maslov K., Wang L. V., “High-speed three-dimensional photoacoustic computed tomography for preclinical research and clinical translation,” Nat. Commun. 12(1), 882 (2021). 10.1038/s41467-021-21232-1 [DOI] [PMC free article] [PubMed] [Google Scholar]
- 14.Estrada H., Özbek A., Robin J., Shoham S., Razansky D., “Spherical array system for high-precision transcranial ultrasound stimulation and optoacoustic imaging in rodents,” in IEEE Trans. Ultras. Ferroel. and Freq. Control 68(1), 107–115 (2021). 10.1109/TUFFC.2020.2994877 [DOI] [PMC free article] [PubMed] [Google Scholar]
- 15.Xia J., Chatni M. R., Maslov K., Guo Z., Wang K., Anastasio M., Wang L. V., “Whole-body ring-shaped confocal photoacoustic computed tomography of small animals in vivo,” J. Biomed. Opt. 17(5), 050506 (2012). 10.1117/1.JBO.17.5.050506 [DOI] [PMC free article] [PubMed] [Google Scholar]
- 16.Lin L., Hu P., Shi J., Appleton C. M., Maslov K., Li L., Zhang R., Wang L. V., “Single-breath-hold photoacoustic computed tomography of the breast,” Nat. Commun. 9(1), 1–9 (2018). 10.1038/s41467-017-02088-w [DOI] [PMC free article] [PubMed] [Google Scholar]
- 17.Paltauf G., Nuster R., Burgholzer P., “Weight factors for limited angle photoacoustic tomography,” Phys. Med. Biol. 54(11), 3303–3314 (2009). 10.1088/0031-9155/54/11/002 [DOI] [PMC free article] [PubMed] [Google Scholar]
- 18.Liu X., Peng D., Ma X., Guo W., Liu Z., Han D., Yang X., Tian J., “Limited-view photoacoustic imaging based on an iterative adaptive weighted filtered backprojection approach,” Appl. Opt. 52(15), 3477–3483 (2013). 10.1364/AO.52.003477 [DOI] [PubMed] [Google Scholar]
- 19.Provost J., Lesage F., “The application of compressed sensing for photo-acoustic tomography,” IEEE Trans. Med. Imaging 28(4), 585–594 (2009). 10.1109/TMI.2008.2007825 [DOI] [PubMed] [Google Scholar]
- 20.Hauptmann A., Cox B., “Deep learning in photoacoustic tomography: current approaches and future directions,” J. Biomed. Opt. 25(11), 112903 (2020). 10.1117/1.JBO.25.11.112903 [DOI] [Google Scholar]
- 21.Gröhl J., Waibel D., Isensee F., Kirchner T., Maier-Hein K., Maier-Hein L., “Reconstruction of initial pressure from limited view photoacoustic images using deep learning,” Proc. SPIE 10494, 98 (2018). 10.1117/12.2288353 [DOI] [Google Scholar]
- 22.Allman D., Reiter A., Bell M. A. L., “Photoacoustic source detection and reflection artifact removal enabled by deep learning,” IEEE Trans. Med. Imaging 37(6), 1464–1477 (2018). 10.1109/TMI.2018.2829662 [DOI] [PMC free article] [PubMed] [Google Scholar]
- 23.Sahiner B., Pezeshk A., Hadjiiski L. M., Wang X., Drukker K., Cha K. H., Summers R. M., Giger M. L., “Deep learning in medical imaging and radiation therapy,” Med. Phys. 46(1), e1–e36 (2019). 10.1002/mp.13264 [DOI] [PMC free article] [PubMed] [Google Scholar]
- 24.Tong T., Huang W., Wang K., He Z., Yin L., Yang X., Zhang S., Tian J., “Domain transform network for photoacoustic tomography from limited-view and sparsely sampled data,” Photoacoustics 19, 100190 (2020). 10.1016/j.pacs.2020.100190 [DOI] [PMC free article] [PubMed] [Google Scholar]
- 25.Kim M. W., Jeng G. S., Pelivanov I., O’Donnell M., “Deep-learning image reconstruction for real-time photoacoustic system,” IEEE Trans. Med. Imaging 39(11), 3379–3390 (2020). 10.1109/TMI.2020.2993835 [DOI] [PMC free article] [PubMed] [Google Scholar]
- 26.Shan H., Wang G., Yang Y., “Accelerated correction of reflection artifacts by deep neural networks in photo-acoustic tomography,” Appl. Sci. 9(13), 2615 (2019). 10.3390/app9132615 [DOI] [Google Scholar]
- 27.Allman D., Assis F., Chrispin J., Lediju Bell M. A., “Deep neural networks to remove photoacoustic reflection artifacts in ex vivo and in vivo tissue,” in 2018 IEEE International Ultrasonics Symposium (IUS) (2018), pp. 1–4. [Google Scholar]
- 28.Davoudi N., Deán-Ben X. L., Razansky D., “Deep learning optoacoustic tomography with sparse data,” Nat. Mach. Intell. 1(10), 453–460 (2019). 10.1038/s42256-019-0095-3 [DOI] [Google Scholar]
- 29.Kirchner T., Gröhl J., Maier-Hein L., “Context encoding enables machine learning-based quantitative photoacoustics,” J. Biomed. Opt. 23(05), 1–9 (2018). 10.1117/1.JBO.23.5.056008 [DOI] [PMC free article] [PubMed] [Google Scholar]
- 30.Guan S., Khan A. A., Sikdar S., Chitnis P. V., “Fully dense UNet for 2-D sparse photoacoustic tomography artifact removal,” IEEE J. Biomed. Heal. Informatics 24(2), 568–576 (2020). 10.1109/JBHI.2019.2912935 [DOI] [PubMed] [Google Scholar]
- 31.Vu T., Li M., Humayun H., Zhou Y., Yao J., “Feature article: A generative adversarial network for artifact removal in photoacoustic computed tomography with a linear-array transducer,” Exp. Biol. Med. 245(7), 597–605 (2020). 10.1177/1535370220914285 [DOI] [PMC free article] [PubMed] [Google Scholar]
- 32.Gui J., Sun Z., Wen Y., Tao D., Ye J., “A review on generative adversarial networks: algorithms, theory, and applications,” arXiv:2001.06937v1 (2020).
- 33.Isola P., Zhu J. Y., Zhou T., Efros A. A., “Image-to-image translation with conditional adversarial networks,” in 2017 IEEE Conference on Computer Vision and Pattern Recognition (CVPR) (2017), pp. 5967–5976. [Google Scholar]
- 34.Mao X., Li Q., Xie H., Lau R. Y. K., Wang Z., Smolley S. P., “Least squares generative adversarial networks,” in 2017 IEEE International Conference on Computer Vision (ICCV) (2017), pp. 2813–2821. [Google Scholar]
- 35.Yi X., Walia E., Babyn P., “Generative adversarial network in medical imaging: a review,” Med. Image Anal. 58(2), 101552 (2019). 10.1016/j.media.2019.101552 [DOI] [PubMed] [Google Scholar]
- 36.Wolterink J. M., Leiner T., Viergever M. A., Išgum I., “Generative adversarial networks for noise reduction in low-dose CT,” IEEE Trans. Med. Imaging 36(12), 2536–2545 (2017). 10.1109/TMI.2017.2708987 [DOI] [PubMed] [Google Scholar]
- 37.Tanner C., Ozdemir F., Profanter R., Vishnevsky V., Konukoglu E., Goksel O., “Generative adversarial networks for MR-CT deformable image registration,” arXiv:1807.07349 (2018).
- 38.Frid-Adar M., Diamant I., Klang E., Amitai M., Goldberger J., Greenspan H., “GAN-based synthetic medical image augmentation for increased CNN performance in liver lesion classification,” Neurocomputing 321(10), 321–331 (2018). 10.1016/j.neucom.2018.09.013 [DOI] [Google Scholar]
- 39.Kim K. H., Do W. J., Park S. H., “Improving resolution of MR images with an adversarial network incorporating images with different contrast,” Med. Phys. 45(7), 3120–3131 (2018). 10.1002/mp.12945 [DOI] [PubMed] [Google Scholar]
- 40.Wolterink J. M., Dinkla A. M., Savenije M. H. F., Seevinck P. R., van den Berg C. A. T., Išgum I., “Deep MR to CT synthesis using unpaired data,” In International workshop on simulation and synthesis in medical imaging (Springer, 2017), Vol. 10557. [Google Scholar]
- 41.Zhu J. Y., Park T., Isola P., Efros A. A., “Unpaired image-to-image translation using cycle-consistent adversarial networks,” in 2017 IEEE International Conference on Computer Vision (ICCV) (2017), pp. 2242–2251. [Google Scholar]
- 42.Armanious K., Jiang C., Fischer M., Küstner T., Hepp T., Nikolaou K., Gatidis S., Yang B., “MedGAN: medical image translation using GANs,” Comput. Med. Imaging Graph. 79, 101684 (2020). 10.1016/j.compmedimag.2019.101684 [DOI] [PubMed] [Google Scholar]
- 43.Stephens M., Estepar R. S. J., Ruiz-Cabello J., Arganda-Carreras I., Macía I., López-Linares K., “MRI to CTA translation for pulmonary artery evaluation using CycleGANs trained with unpaired data,” In International Workshop on Thoracic Image Analysis (Springer, 2020), Vol. 12502. [Google Scholar]
- 44.Singh N. K., Raza K., “Medical image generation using generative adversarial networks: a review,” in Health Informatics: A Computational Perspective in Healthcare (Springer; 2021), Vol. 932. [Google Scholar]
- 45.Armanious K., Jiang C., Abdulatif S., Küstner T., Gatidis S., Yang B., “Unsupervised medical image translation using Cycle-MeDGAN,” In 27th IEEE European Signal Processing Conference (EUSIPCO) (2019), pp. 1–5. [Google Scholar]
- 46.Zhang J., He Q., Xiao Y., Zheng H., Wang C., Luo J., “Ultrasound image reconstruction from plane wave radio-frequency data by self-supervised deep neural network,” Med. Image Anal. 70, 102018 (2021). 10.1016/j.media.2021.102018 [DOI] [PubMed] [Google Scholar]
- 47.Woo S., Park J., Lee J. Y., Kweon I. S., “CBAM: Convolutional block attention module,” arXiv:1807.06521v2 (2018).
- 48.Szegedy C., Vanhoucke V., Ioffe S., Shlens J., Wojna Z., “Rethinking the inception architecture for computer vision,” in 2016 IEEE Conference on Computer Vision and Pattern Recognition (CVPR) (2016), pp. 2818–2826. [Google Scholar]
- 49.Zhao H., Gallo O., Frosio I., Kautz J., “Loss functions for image restoration with neural networks,” IEEE Trans. Comput. Imaging 3(1), 47–57 (2017). 10.1109/TCI.2016.2644865 [DOI] [Google Scholar]
- 50.Huo Y., Xu Z., Moon H., Bao S., Assad A., Moyo T. K., Savona M. R., Abramson R. G., Landman B. A., “Synseg-net: Synthetic segmentation without target modality ground truth,” IEEE Trans. Med. Imaging 38(4), 1016–1025 (2019). 10.1109/TMI.2018.2876633 [DOI] [PMC free article] [PubMed] [Google Scholar]
- 51.Waldstein S. M., Seeböck P., Donner R., Sadeghipour A., Bogunović H., Osborne A., Schmidt-Erfurth U., “Unbiased identification of novel subclinical imaging biomarkers using unsupervised deep learning,” Sci. Rep. 10(1), 12954–9 (2020). 10.1038/s41598-020-69814-1 [DOI] [PMC free article] [PubMed] [Google Scholar]
- 52.Durairaja D., Agrawal S., Johnstonbaugh K., Chen H., Karric S., Kothapalli S., “Unsupervised deep learning approach for photoacoustic spectral unmixing,” Proc. SPIE 11240, 125 (2020). 10.1117/12.2546964 [DOI] [Google Scholar]
- 53.Yang Q., Yan P., Zhang Y., Yu H., Shi Y., Mou X., Kalra M. K., Zhang Y., Sun L., Wang G., “Low-dose CT image denoising using a generative adversarial network with Wasserstein distance and perceptual loss,” IEEE Trans. Med. Imaging 37(6), 1348–1357 (2018). 10.1109/TMI.2018.2827462 [DOI] [PMC free article] [PubMed] [Google Scholar]
Associated Data
This section collects any data citations, data availability statements, or supplementary materials included in this article.
Data Availability Statement
Data underlying the results presented in this paper are available at [28].


