

Abstract
The intrinsic metabolic clearance rate (Clint) and fraction of chemical unbound in plasma (fup) serve as important parameters for high throughput toxicokinetic models, but experimental data are limited for many chemicals. Open-source quantitative structure-activity relationship (QSAR) models for both parameters were developed to offer reliable in silico predictions for a diverse set of chemicals regulated under U.S. law, including pharmaceuticals, pesticides, and industrial chemicals. As a case study to demonstrate their utility, model predictions served as inputs to the TK component of a risk-based prioritization approach based on Bioactivity: Exposure Ratios (BER), in which a BER < 1 indicates exposures are predicted to exceed a biological activity threshold. When applied to a subset of the Tox21 screening library (6484 chemicals) we found that the proportion of chemicals with BER <1 was similar using either in silico (1137/6484; 17.53%) or in vitro (148/848; 17.45%) parameters. Further, when considering only the chemicals in the Tox21 set with in vitro data, there was a high concordance of chemicals classified with either BER < 1 or > 1 using either in silico or in vitro parameters (768/848, 90.5%). Thus, the presented QSARs may be suitable for prioritizing the risk posed by many chemicals for which measured in vitro TK data are lacking.
Keywords: Metabolic clearance, Fraction unbound in plasma, machine learning, toxicokinetics, QSAR, Chemical risk prioritization
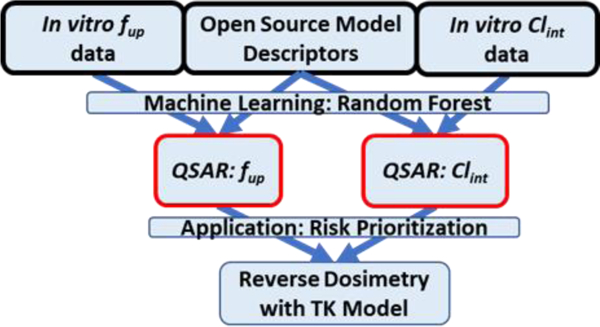
Graphical Abstract
1. INTRODUCTION
Environmental contamination associated with industrial processes and household products results in a complex chemical exposure that can impact public health.1, 2 Regulation of non-pesticidal environmental contaminants within the United States occurs under the Toxic Substances Control Act, as recently re-authorized by the Frank R. Lautenberg Chemical Safety for the 21st Century Act.3, 4 These regulations require the U.S. Environmental Protection Agency to evaluate risks to human health and the environment associated with both new and existing chemicals. With >86,000 chemicals in this domain5, traditional in vivo methods used to assess toxicity for individual chemicals are not feasible.6 Instead, a need exists for high throughput methods, including in vitro assays and in silico models, to prioritize chemicals posing the greatest potential public health risk for further review6–12. High throughput in vitro screening initiatives such as the U.S. Federal Government Toxicology in the 21st Century (Tox21) and Toxicity Forecaster (ToxCast) use batteries of assays to identify potential hazards across curated libraries of chemicals of interest13. A recent publication from the U.S. National Toxicology Program showed the value of such high throughput methods coupled with in silico methods in a risk prioritization framework14.
Toxicokinetic (TK) models that account for chemical absorption, distribution, metabolism, and elimination (ADME properties), sometimes referred to as physiological or physiologically-based toxicokinetic models (PBTK), are widely used to predict a compound’s concentration time-course in selected tissues based on a known or forecast exposure.15–18 With these models, a measured in vitro effect concentration at an assumed relevant tissue can also be related to a corresponding environmental exposure in a process known as reverse dosimetry.19, 20 For most environmental contaminants, in vivo TK information is unavailable, so in vitro measurements and generic TK models are often used.21 The intrinsic hepatic clearance rate (Clint) and fraction of chemical unbound in plasma by proteins (fup) are two key chemical-specific inputs for such modeling efforts. In vitro measured values for these parameters have already proven themselves useful for the risk prioritization of hundreds of non-pharmaceuticals in the ToxCast library.8, 14, 20, 22–24 Currently, however, similar data are unavailable for thousands of other chemicals of concern.14, 20, 25 Fortunately, in silico models can potentially fill this data gap in a fast and cost-effective manner.6, 12, 21, 26
In silico models have shown potential for predicting these toxicokinetic parameters with approaches ranging from simple physicochemical property based equations to quantitative structure-activity relationships (QSAR) to isoenzyme specific binding models.25–36 However, most models have focused exclusively on predicting these parameters for pharmaceuticals,28, 37–40 with prediction outside this domain relatively limited. Additionally, many existing models for Clint and fup are constructed with proprietary data, descriptors, or software, which limits access to the models and evaluation of prediction quality within a desired chemical space.
In the present study, machine learning algorithms were used to construct accessible, open-source QSAR models for fup and Clint with a focus on a broad set of chemical domains including pharmaceuticals, pesticides, and industrial chemicals. These models were then incorporated into an existing TK-based framework to evaluate the utility of the QSARs in high throughput public health risk prioritization.
2. MATERIALS AND METHODS
2.1. Data Collection and Curation
2.1.1. Hepatic Clearance: Clint
In vitro Clint values were collected from two sources. First, ChEMBL (version 21) 41–43 is a “a manually curated database of bioactive molecules with drug-like properties”. Second, the ToxCast screening program44, hereafter known as the “ToxCast dataset” included chemicals from a variety of domains that were reported in the literature.8–10, 24 Assembled values included both hepatic cell assays as well as assays using microsomes, and only included chemicals with 1st order dynamics (See Supplemental Information (S1.1.1) for further details). All values were standardized into units of μL/min/106 cells, with Clint values based on microsomes (2163/2917) converted to units of μL/min/106 cells using an extrapolation factor: 1 mg/ml microsomal protein to 1 × 10⁶ cells45. Lastly, chemical binding by biological substrates such as lipids and proteins can interfere with the calculation of clearance rates calculated via in vitro assays45. To adjust for this, Clint values were divided by an assay specific (hepatic or microsomal) correction factor based on the lipophilicity characteristics of the chemical. See Supplemental Information (S1.1.2) for further details on chemical binding correction factors.
Next, we decided to use a classification approach to model Clint. Hepatic clearance is accomplished through enzymatic activity, carried out largely through an array of cytochrome P450 (CYP450) enzymes. Although targeting CYP450 activity has been a frequent approach for QSAR modeling of Clint40, broadly modeling Clint is challenging because enzymes vary in their activity by chemical group46, and cellular processes such as efflux mechanisms may influence measured Clint rates47. However, a previous general QSAR model for Clint by Kirman et al. (2015)26 fit over a broad domain of chemicals using regression was encouraging (R2=0.39). Because heteroskedastic distributions of model residuals impacted different regions of Clint values (e.g., fast vs. slow), we reasoned that model performance could be improved by recasting clearance prediction as a classification problem. By accepting a lower level of predictive precision imposed by classification bins of clearance rates, we expected to gain an overall increase in accuracy. Furthermore, we sought to broaden the model domain compared to Kirman et al. (2015) (VOCs, ToxCast Phase I and Phase II compounds) by including a nominally equal representation of pharmaceuticals randomly selected from ChEMBL.
Preliminary work showed that assembled in vitro Clint values for chemicals could be grouped by quartiles into 4 bins (See Supplemental Information (S1.1.3)), including “very slow”(< 3.9 μL/min/106cells), “slow” (3.9–9.3 μL/min/106), “fast” (9.3–21.7 μL/min/106cells), and “very fast” (>21.7 μL/min/106cells). In addition, the transition point between the slow and fast rates of metabolism (9.3 μL/min/106cells) is biologically relevant, as the rate of average blood flow to the human liver is similar to this value when converted to units of μL/min/106 cells (8.45)48–50. See Supporting Information (S2.1) for a detailed accounting of this conversion. Because the rate of hepatic clearance cannot exceed the rate of blood flow to the tissue, predicted hepatic clearance becomes increasingly rate-limited by liver blood flow as Clint approaches and then exceeds this transitional range. However, because blood-flow rates vary, it is difficult to ascribe a specific threshold above which Clint equals to blood flow. Thus, in a parallel with the 4-bin classification described above, we created a 3-bin classification in which the “fast” and “very fast” clearing chemicals are combined into a single “fast” bin.
To construct and assess models for Clint, the overall dataset was split into a training set consisting of equal representation of both ToxCast and ChEMBL data (1600), with each bin of the 4-Bin training set explicitly balanced by clearance rate (very slow, slow, fast, very fast) and data source. For the 3-Bin training set, a combined fast bin was constructed by combining the fast and very fast bins of the 4-Bin training set. Two independent validation sets consisting of chemicals from either ToxCast (99) or ChEMBL (2113) were also assembled. The ChEMBL test set was relatively large (e.g., each bin could contain at least 248 chemicals), and it was explicitly balanced by bin. Because the ToxCast test was relatively small, it was not balanced by classification bin. However, each bin made up at least 8% of the dataset. See Supporting Information (S1.1.3) for a detailed description of how training and test sets for Clint were assembled.
2.1.2. Fraction Unbound in Plasma: fup
In vitro values for fup were assembled starting from the dataset of Ingle et al.25, a collection of 1651 (1245 pharmaceuticals and 406 ToxCast) compounds curated from the literature 10, 22, 28, 51 This dataset was predominantly made up of pharmaceuticals, and we sought to train and test models over a broader chemical domain. Thus, this dataset was augmented with additional compounds from the more recent Wambaugh et al.24, and reassembled into training and test sets. The training set consisted of a combined, balanced training set of 1305 chemicals (650 ToxCast, 655 pharmaceuticals), and test sets included 2 pharmaceutical test sets (199, 454), and a third test set consisting of the same 99 ToxCast chemicals used to evaluate the Clint model described above. See the Supporting Information (S1.2) for additional details on the assembly of training and test sets for fup.
The remainder of the Methods and Materials section describe QSAR model development, evaluation, and application. Please see Figure 1 for a visual reference of these details.
Fig 1.
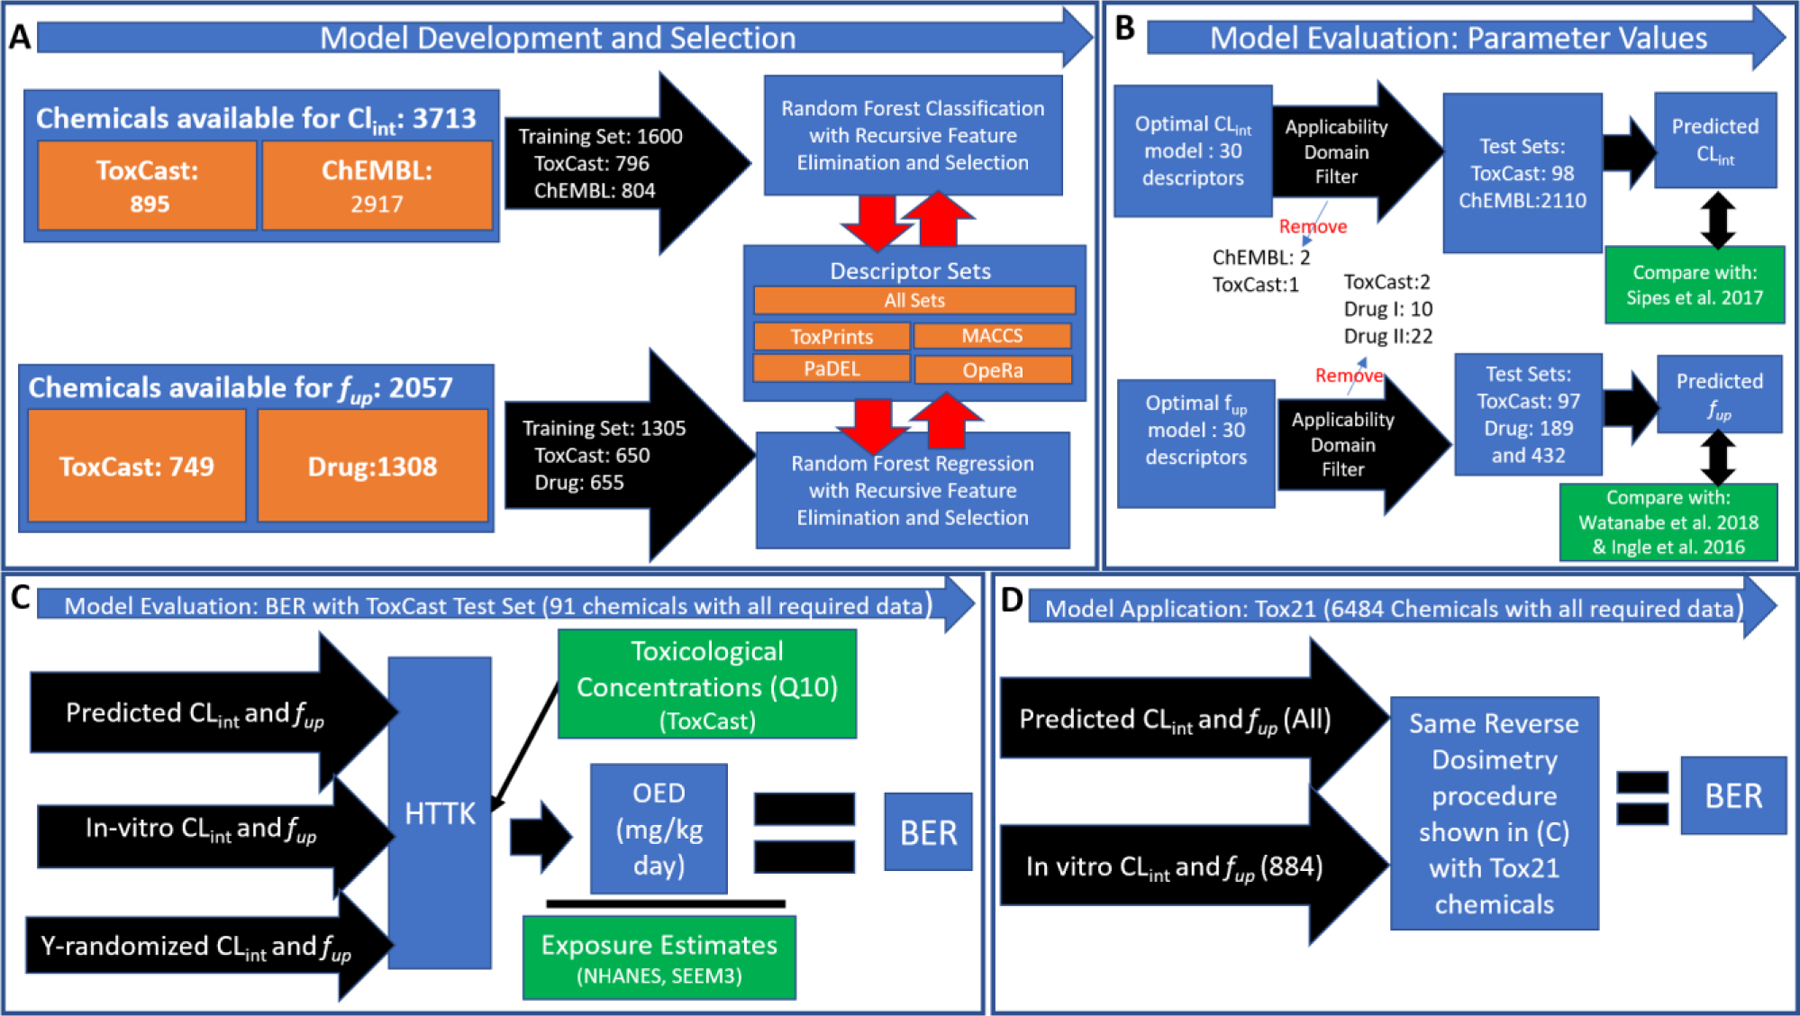
Overall methods workflow of study, with A) Random Forest model development and selection for fup and Clint using assembled training sets; B) Model evaluation of source-specific optimal fup and Clint models against test sets (following removal of chemicals outside applicability domain) and previously published models; C) Generation of bioactivity-exposure ratios (BER) using reverse dosimetry with the httk R package to evaluate model outputs in bioactivity-exposure space with the ToxCast test set D) Generation of BER’s for 6484 chemicals of the Tox21 set using the same methodology as (C), only 884 of which have known values for fup and Clint.
2.2. QSAR Descriptor Calculation and Evaluation
2.2.1. Clint Model Development and Selection
Random Forest (RF) Classification was used to construct a QSAR model of binned values of Clint using descriptors from 4 open-source descriptor sets: PaDEL,52 OPERA,53 ToxPrints, 54, 55 and MACCS.56, 57 Of these descriptors sets, PaDEL, ToxPrints, and MACCS are different systems of describing chemicals through chemical structure fingerprints. In contrast, OPERA represents a collection of physicochemical properties predicted by CDK-structural and PaDEL fingerprints.58 We also combined descriptor sets together into an “All Descriptor sets” set. Following a pruning process to remove uninformative low variance (<5%) and strongly correlated (>95%) descriptors, the final descriptor sets included 710 PaDEL descriptors, 17 OPERA descriptors, 79 ToxPrints, 116 MACCS fingerprints, and 917 descriptors in the “All Descriptors sets” set. All descriptors in each descriptor set were centered and scaled to 1 standard deviation with respect to the training set.
To prevent overfitting while maintaining model generalizability, a recursive feature elimination (incorporating 5-fold cross validation) was used with the descriptors from each source to find the minimum subset of descriptors that allows for similar prediction accuracy as the full set of descriptors for that source. See the Supporting Information (S1.3) for a detailed description of this process. In brief, for each descriptor source a model was fit with the total number of available descriptors. Because this model had the highest accuracy for a set of descriptors, it was the source-specific best model. Next, a series of model subsets with decreasing numbers of descriptors (down to 1 descriptor) were iteratively fit based on the importance values of descriptors in the previous subset; that is, the least important descriptors in one model subset were excluded from next model subset. The source-specific optimal model was then defined as the model with the least number of descriptors that had an average accuracy within the 95% Confidence Interval of the source-specific best model.
The R package randomForest56, 59 was used to fit models for the recursive feature elimination, and average model accuracy was assessed using the caret60, 61 package. Thus, a total of 10 source-specific optimal models were produced using the above described process (5 descriptor source sets * 2 binning sets (3 bins, 4 bins)). Out of all the source/bin-specific optimal models, the one with the highest average accuracy was defined as the best overall QSAR model for Clint. This best overall model was utilized for all downstream in silico Clint predictions. The statistical significance of the accuracy of prediction was assessed against the no-information rate, which equaled the proportion of chemicals in the largest bin to the overall set.60
Following the selection of the best overall model, the applicability domain (AD) of all best source/bin-specific models were determined using a methodology described by Roy et al. 2015.62 This methodology uses the ranges of standardized values of model descriptors for chemicals in the training set to determine whether a novel chemical would be reasonably described by the model. Chemicals from the test sets that were determined to be outside the AD of each model were removed. Then, the accuracy of the overall best model and each of the other source/bin-specific optimal models was calculated using the assembled test sets. In addition to the accuracy, which calculates the overall ability to classify the test, we calculated the multi-class weighted average precision of each model.63–65 This metric takes the proportion of the bin of the test set into account and indicates the average probability of a classified chemical belonging to the assigned bin.
2.2.2. Clint Model Evaluation
Most recently published models for Clint have been structured as regression models instead of classification models14, making direct comparison with the present classification-based QSAR models (producing binned values) problematic. As an alternative, we compared the impact of Clint predictions within a TK model context, as this is a primary application of the new Clint models. The TK model outputs (e.g. steady state plasma concentrations (Css)) that depend on Clint values were evaluated utilizing in vitro data and in silico predictions from the new classification models and a previously published regression model. This analysis was conducted using a simplified TK model (“3compartmentss”) implemented in the high throughput toxicokinetics (httk) R package, version 2.0.1.50 This model also includes passive glomerular filtration as a secondary clearance mechanism, and uses a Monte Carlo approach to simulate a distribution of Css values for chemicals across a population. It assumes an intravenous, continuously administered reference dose of 1 μg/kg/day. See Pearce et al. (2017)50 for complete details of this model. The Css values for in-domain chemicals in the ToxCast test set were determined with this TK model using Clint predictions from the best overall model by substituting the medians of in vitro Clint values within the predicted bin. We repeated this exercise using Clint predictions made by a model by Sipes et al (2017).14 That model focused on modeling cumulative CYP450 enzyme activity, and used proprietary software (ADMET Predictor 7.2, Simulations Plus Inc, Lancaster, CA) to produce log P and pka parameters for 8758 chemicals. For consistency in our comparison, in vitro values for fup available in the ToxCast dataset were utilized to estimate Css values. The two sets of Css predictions were compared against Css values produced using the in vitro Clint data using linear models of log10 transformed data. The coefficient of determination (R2) of each model was used to compare how well the modeling approaches approximated in vitro Clint parameter values within the context of the TK model.
2.2.3. fup Model Development and Selection
Random Forest (RF) Regression was used to construct a QSAR model of fup using the descriptors from the same 4 open-source descriptor sets used for Clint: PaDEL, OPERA, ToxPrints, and MACCS. PaDEL descriptors were incalculable for some compounds (primarily those with large ring structures) resulting in 1305 (from 1310) drug/ToxCast training samples, 99 ToxCast test samples, 199 (from 200) drug test compounds (I), and a second drug test set of 454 (from 458) compounds (II). Pruning of descriptor sets to remove uninformative low variance (<5%) and strongly correlated (>95%) descriptors resulted in 648 PaDEL, 13 OPERA, 120 ToxPrints, and 83 MACCS features to be used as source-specific model descriptors. These descriptors were also compiled together into an “All Descriptors set” containing 864 descriptors. All descriptor sets were centered and scaled by 1 standard deviation with respect to their values in the training set. To account for a skew towards compounds with high protein binding affinity we considered several transformations, including converting experimental fup into pseudo equilibrium constants (ln Ka),25, 66, 67 the logarithmic transformation (log fup),36, 68 or by the square root transformation (√ fup).69 Each transformation was evaluated following model selection (see next section) for best fit. See Supplemental Information (S1.4) for more details of fup transformation.
To determine an overall best model for fup, we used a process similar to that described for Clint, with recursive feature elimination carried out using the caret60, 61 package of R. That is, for each descriptor set we compared models built with all descriptors (the source-specific best model) against models built with decreasing numbers of descriptors to find a subset that produced a model with similar performance (the source-specific optimal model). For fup, source-specific optimal models were selected as the models with the smallest number of descriptors in each descriptor set for which there was no statistical difference with respect to the average root mean squared error (RMSE) compared to the source-specific best model. For comparative purposes, mean absolute error (MAE) was also calculated for all models. Then, from the source-specific optimal models, a best overall QSAR model for fup was selected as the model with the highest overall average coefficient of determination (Q2, from 5-fold CV) produced from the 5 descriptor sets. This model was utilized for all downstream in silico fup predictions. The ADs of all source-specific best models (including the best overall model) were calculated using the same methodology as described in section 2.2.1, and applied to the assembled test sets to remove chemicals outside the model domains. Finally, the fit of the source-specific optimal models, including the best overall QSAR model for fup, was assessed against the AD-filtered test sets.
2.3. Bioactivity: Exposure Ratio (BER)
The Bioactivity: Exposure Ratio (BER) is a metric for risk prioritization that compares a compound’s relative bioactive dose and expected external exposure. A bioactive exposure equivalent of the bioactive dose, expressed as an oral equivalent dose (OED; mg/kg body weight/day), can be determined by reverse dosimetry using TK models and measured in vitro toxicity information. The bioactive exposure equivalent can then be compared to the known or anticipated exposure concentration (also expressed as OED in mg/kg body weight/day) to provide a dimensionless, chemical-specific metric of risk, the BER. Given that TK model information is sparser than toxicity information, we propose expediting TK model development using in silico parameters to estimate BER for new compounds. In this study, BER was defined as:
| [1] |
In equation 1, OEDBioactive Dose is the oral equivalent dose of a bioactive concentration from an in vitro toxicity screening assay, and OEDExpected Exposure is the oral equivalent dose at the highest estimated exposure dose rate. The bioactive dose for a chemical was defined as the lowest 10th percentile (Q10) of the half-maximal activity concentrations (AC50) across the ToxCast screening assays for that chemical.70 The Q10 represents activation of a sufficient number of assays such that a corresponding in vivo effect is plausible. A BER < 1 (or on a log10 scale, < 0) indicates that the highest expected exposure level for a chemical exceeds the bioactive concentration; thus, chemicals with a lower BER may be of higher risk relative to chemicals with higher BER values.
The current study assessed the utility of the developed QSARs in a risk prioritization context by calculating BERs for the ToxCast test set of 99 chemicals according to several different scenarios. These scenarios used measured in vitro data and/or in silico data from the best overall QSAR models, and included: 1) in vitro fup and Clint values, 2) in vitro fup and binned in vitro Clint values ; 3) in silico values for fup and Clint ; 4) in silico fup values and y-randomized Clint values; 5) y-randomized fup values and in silico Clint values, and 6) y-randomized fup and Clint values. Comparisons with y-randomized values employed in vitro fup and/or Clint values that were randomly sorted to assess the relative sensitivity of BER estimation to Clint and fup parameters. First, to evaluate how predicted values from our QSAR models influenced calculated estimates of steady state chemical concentrations in plasma (Css), Css values were calculated using each of the scenarios above for the 99 chemicals in the set using a TK model in the R package httk.50, 71 In this instance, the TK model assumed an OED of 1 mg/kg per day. Then, we regressed Css values calculated using in vitro parameter values data (i.e., scenario 1), against Css values generated using parameter values described in scenarios 2–6 above.
To extend the evaluation of the QSAR’s into bioactivity space, the ToxCast dataset was used to identify the Q10 of plasma concentrations known to cause bioactivity72 for each chemical. These values were then converted into OEDs via reverse dosimetry using the same TK model as above. The TK model utilized the combinations of Clint and fup parameter listed for scenarios 1–6 above. These OED’s were divided by a combination of empirical and modeled exposure estimates50, 73, 74 to produce BER values. Further details on the data sources and methods used to prepare toxicological data and exposure data for this analysis are found in the Supporting Information (S1.5). Following the calculation of BERs, those generated from in vitro parameter values (i.e., scenario 1) and scenarios 2–6 were compared in two ways, including 1) calculating Spearman’s rank correlation coefficients (ρ)75 to assess the general of the order of BERs and 2) calculating RMSE to quantify the difference in BER values. These approaches allowed for the evaluation of both Clint and fup QSAR’s together and separately, and in both a toxicokinetic and bioactivity context.
To evaluate the potential of these QSAR models to provide TK estimates for chemicals for which empirical data are lacking, BERs were calculated for chemicals in the Tox21 dataset.72 The entire dataset is comprised of approximately 10,000 chemicals across a wide domain of applicability, including industrial chemicals, pesticides, and consumer products.13 The evaluated dataset was limited to a subset of 6493 chemicals for which both exposure and toxicological data were available, sufficient physicochemical property information was available to calculate the OED using the toxicokinetic model in httk71, and chemicals were in the AD’s of both QSAR models. For these chemicals, OEDs and corresponding BERs were calculated using QSAR-predicted Clint and fup. For comparison, OEDs and BERs were also calculated for a subset of 848 chemicals (also within the AD of the QSAR models) using available in vitro Clint and fup values.
Lastly, the Organization for Economic Cooperation and Development (OECD) recommends that QSAR models intended for regulatory purposes meet 5 criteria. We discuss how our models meet these criteria.
3. RESULTS AND DISCUSSION
3.1. Random Forest Classification model for Clint
3.1.1. Model description and evaluation
The model selection process determined that the overall best model was the 3-Bin All Descriptor sets model with 30 descriptors (i.e., “3-Bin All Descriptors (30)”). See Supporting Information (S2.2) for the training data set for this model. This model had an average accuracy = 58.5% when applied to the training set. As expected, the accuracies of source-specific 3-Bin optimal models were higher than their corresponding 4-Bin models, with all models being significantly better than random chance (Table 1 (top)). In addition, for each Source/Bin-specific optimal model, the number of descriptors needed to achieve a statistically similar level of predictive ability as the Source/Bin-specific best model was markedly fewer than the total available for the source. See the Supporting Information for graphical depictions of the model selection process (S2.6), and more detailed description of the descriptors included in this model (S2.7).
Table 1.
Source-specific optimal QSAR models for Clint applied to training and test sets
|
|
|||||||||
|---|---|---|---|---|---|---|---|---|---|
| Training Set | |||||||||
|
|
|||||||||
| Model Bins | Descriptor Source | Descriptors Considered | Descriptors Selected | Ratio of selected to considered | Accuracy | 95% CI Boundary | NIR | P-value | |
|
|
|
|
|||||||
| 4 | a | 917 | 30 | 0.033 | 0.511 | 0.024 | 0.25 | <0.001 | |
| 4 | t | 79 | 30 | 0.380 | 0.407 | 0.022 | |||
| 4 | m | 116 | 40 | 0.345 | 0.475 | 0.022 | |||
| 4 | p | 710 | 20 | 0.028 | 0.495 | 0.022 | |||
| 4 | o | 17 | 10 | 0.588 | 0.470 | 0.028 | |||
|
|
|||||||||
| 3 | a | 917 | 30 | 0.033 | 0.585 | 0.025 | 0.5 | <0.001 | |
| 3 | t | 79 | 20 | 0.253 | 0.516 | 0.015 | |||
| 3 | m | 116 | 50 | 0.431 | 0.539 | 0.021 | |||
| 3 | p | 710 | 30 | 0.042 | 0.572 | 0.023 | |||
| 3 | o | 17 | 10 | 0.588 | 0.566 | 0.025 | |||
|
|
|||||||||
| Test Sets | |||||||||
|
| |||||||||
| ChEMBL | ToxCast | ||||||||
|
| |||||||||
| Model Bins | Dataset | Accuracy | NIR | P-value | Average Multiclass Precision | Accuracy | NIR | P-value | Average Multiclass Precision |
| 4 | a | 0.376 | 0.250 | <0.001 | 0.620 | 0.551 | 0.388 | 0.001 | 0.488 |
| 4 | t | 0.335 | <0.001 | 0.405 | 0.465 | 0.384 | 0.062 | 0.434 | |
| 4 | m | 0.314 | <0.001 | 0.509 | 0.535 | 0.384 | 0.002 | 0.501 | |
| 4 | p | 0.336 | <0.001 | 0.537 | 0.541 | 0.388 | 0.002 | 0.507 | |
| 4 | o | 0.341 | <0.001 | 0.434 | 0.537 | 0.389 | 0.003 | 0.546 | |
|
| |||||||||
| 3 | a | 0.489 | 0.330 | <0.001 | 0.620 | 0.694 | 0.531 | 0.001 | 0.714 |
| 3 | t | 0.419 | <0.001 | 0.490 | 0.616 | 0.535 | 0.065 | 0.625 | |
| 3 | m | 0.447 | <0.001 | 0.604 | 0.606 | 0.535 | 0.095 | 0.603 | |
| 3 | p | 0.470 | <0.001 | 0.620 | 0.643 | 0.531 | 0.016 | 0.665 | |
| 3 | o | 0.437 | <0.001 | 0.489 | 0.684 | 0.526 | 0.001 | 0.689 | |
|
| |||||||||
Top Panel: The number descriptors available, number of descriptors selected, accuracy, 95% confidence boundary, and p-value of source-specific optimal models based on the model selection process. Bottom Panel: Source-specific optimal models applied to the ChEMBL and ToxCast Test sets.
NIR=No-information rate; proportion of the class with the largest proportion of cases. Note that the test sets (ChEMBL and ToxCast) only included chemicals that fell into the applicability domain of the corresponding model.
After filtering the test sets with the applicability domain of the model (Supplementary Information (S2.3)), the model had the highest accuracy when applied to the ToxCast (69.4%) test set. The multiclass precision metric was higher for the ChEMBL test set (0.615) but was still lower than the metric for the ToxCast test set (0.714). A closer look at the confusion matrices for this model against the test sets (Supplemental Information S2.8), shows that the apparent worse performance of the model with the ChEMBL test set was likely due to poor performance of chemicals in the “very slow” category (11% accuracy). In contrast, the “very slow” category was predicted reasonably well for the ToxCast test set (55.3%), and both sets predicted chemicals in the combined “fast” and “very fast” category with high accuracy (88.5% in ToxCast, 81.4% in ChEMBL). The imbalance in the ToxCast test set (e.g., the “slow” bin contained only 8% of the set) may have resulted in an accuracy metric that is biased high. However, this concern is offset by the similar values of the multiclass precision metric between the ToxCast and ChEMBL test sets, which takes bin proportion into account. Overall, the evaluation of the model performance suggests that the model is less consistently accurate for more slowly clearing chemicals.
Lastly, an evaluation of the best overall model against a recently published model by Sipes et al.14 showed that in silico inputs from the Sipes model resulted in a linear model with an R2 = 0.249, while in silico Clint values from our model had an R2 = 0.55. Thus, our in silico Clint model is a marked improvement over the Sipes model when applied to the chemicals of the ToxCast test set. See Supporting Information (S2.11) for details on these linear models. Previously published QSAR models constructed specifically for pharmaceuticals have better applicability across a range of Clint rates76, 77. However, many pharmaceuticals are known to be metabolized by a relatively few CYP450 enzymes,40 with some QSAR models designed for chemicals metabolized by specific enzymes46. The Sipes model is somewhat mechanistic as well, with each parameter representing activity by different CYP450 liver enzymes known to influence clearance. By training a mix of pharmaceutical and non-pharmaceuticals against a wide set of descriptors, the Clint model presented here represents a tradeoff in accuracy and precision compared to pharmaceutical models, but still an improvement for general chemical general applicability. In addition, the model presented heres uses open source descriptors, while the Sipes model utilized proprietary descriptors.
3.2. QSAR model for fup
3.2.1. Model description and evaluation.
Using recursive feature elimination with all descriptors, comparison of transformations of experimental fup indicated that the square root transformation provided the best fit (Supplemental Information (S2.14)). Using the √ transformation, the model selection process (see Supplemental Information (S2.9) for a graphic depiction) showed that the best overall model was constructed from all descriptor sources and using 30 descriptors, hereafter referred to as the “All (30)” model. See Supplementary Information (S2.4) for all training data utilized for this model. After filtering the test sets with the applicability domain of this model and applying it to the remaining chemicals (Supplementary Information (S2.5)), the model was further supported as the best overall model (Table 2). The model consisted of mostly PaDEL descriptors (26) but showed a modest benefit from the inclusion of 4 OPERA descriptors (Q2=0.58) relative to the PaDEL-specific model (Q2= 0.56). The top two OPERA descriptors in the All (30) model were associated with water/octanol partitioning and water solubility and ranked, respectively, 1st and 4th in importance. Similarly, 2 of 26 PaDEL descriptors in the All (30) model associated with octanol-water partitioning, CrippenLogP and XLogP, ranked highly (2 & 5). Models based on MACCS or ToxPrints were less predictive and did not contribute among the top 30 descriptors with Q2 of 0.403 and 0.437, respectively. The All (30) model outperformed the other source-specific models for the ToxCast and Drug I and II test sets (Table 2). All descriptors used in the model and their ranks are shown in the Supporting Information (S.2.10). The All (30) model was used in all subsequent BER analysis and Tox21 predictions.
Table 2.
Random Forest Performance Metrics for fup Predictions
| DataSet | Metric | All (30) 30 of 864 | PaDEL (30) 30 of 648 | MACCS (30) 30 of 120 | ToxPrint(30) 30 of 83 | OPERA (11) 11 of 13 |
|---|---|---|---|---|---|---|
| Traininga | MAE | 0.131 | 0.139 | 0.171 | 0.166 | 0.146 |
| RMSE | 0.206 | 0.213 | 0.249 | 0.242 | 0.223 | |
| Q2 | 0.584 | 0.556 | 0.403 | 0.427 | 0.520 | |
| N | 1305 | 1305 | 1305 | 1305 | 1305 | |
|
| ||||||
| Drug I | MAE | 0.164 | 0.166 | 0.203 | 0.211 | 0.186 |
| RMSE | 0.228 | 0.233 | 0.274 | 0.293 | 0.262 | |
| R2 | 0.560 | 0.549 | 0.423 | 0.342 | 0.464 | |
| N | 189 | 189 | 199 | 199 | 198 | |
|
| ||||||
| Drug II | MAE | 0.157 | 0.158 | 0.201 | 0.204 | 0.189 |
| RMSE | 0.219 | 0.222 | 0.269 | 0.279 | 0.259 | |
| R2 | 0.613 | 0.599 | 0.438 | 0.387 | 0.475 | |
| N | 432 | 431 | 454 | 454 | 451 | |
|
| ||||||
| ToxCast | MAE | 0.112 | 0.118 | 0.154 | 0.141 | 0.130 |
| RMSE | 0.187 | 0.191 | 0.241 | 0.218 | 0.203 | |
| R2 | 0.591 | 0.562 | 0.283 | 0.463 | 0.495 | |
| N | 97 | 97 | 99 | 99 | 97 | |
Training set metrics are the mean values across the 5 testing sets from 5-fold CV; mean absolute error (MAE) and root-mean-square error (RMSE) for random forest are shown. b Q2 is the cross-validated R2 as per Golbraikh and Tropsha (2002). 78 Column headers indicate descriptor set and number of best descriptors employed. Samples sizes (N) for test sets (Drug I, Drug II, and ToxCast) indicate number of chemicals included in the applicability domain as per Roy et al.(2015).62
3.2.2. Comparison of fup QSAR model to recently published models.
Several QSAR models of plasma protein binding and fup published in recent years were either trained on pharmaceuticals, involved the use of proprietary predictors, or both.28, 36, 69, 79, 80 Ghafourian and Amin (2013)79 employed proprietary software and descriptors to construct QSAR models for fup on a moderately sized pharmaceutical dataset (662 training set , 132 test set), and reported R2 values ranging from 0.58–0.72 (training) and 0.58–0.65 (test) for different methods including random forest regression. Toma et al. (2019)69 also employed proprietary software and descriptors to model fup on a set of 670 pharmaceuticals, and reported a Q2 of 0.6. Like our study, these authors observed superior fits for the √fup transformation compared with other assessed transformations (Supplemental Information (S2.14)). In this study, we expanded the chemical training domain employed by Ingle et al. (2016) and used similar test sets (Drug I test set was equivalent between the two studies). While our model (R2=0.59) performed better than Ingle et al.25(R2=0.39 and 0.56) for ToxCast-based testing data, Ingle et al. (2016)25 (R2 =0.62) performed better for the Drug I test set(this paper, R2=0.56). This likely reflects the predominant influence of pharmaceutical compounds in Ingle et al. (2016)25 training data relative to the more balanced ToxCast dataset utilized here. In addition, the model given by Ingle et al. (2016)25 was constructed using a proprietary prediction software (MOE), while our model utilizes only open-source descriptors. Similarly, the model provided by Watanabe et. al. (2019),36 was also constructed using open-source descriptors (including PaDEL), however, we did not observe a benefit from applying the log(fup) transformation as they report. While our best model for fup had slightly a lower R2 than the best log-based open-source models of Watanabe et al. (2018)36 (R2=0.691), the training set used here encompasses a more diverse chemical space of both pharmaceutical and environmental chemicals.
3.2.3. Compliance with OECD guidelines and model interpretation
Our models generally meet the guidelines suggested by the Organization for Economic Cooperation and Development (OECD) for the development of QSAR models used for regulatory purposes (Table 3). Although a mechanistic interpretation of the model (criteria 5), is less straightforward here than using methods such as multiple linear regression35 due to the lack of directionality and the large number of descriptors, general inferences can be made about the relative importance of particular mechanisms as suggested by high-ranking descriptors53. For Clint, 4 of the top 10 descriptors (including 3 of the top 5) are measures of lipophilicity, while 5 are electronic and/or topological descriptors (See Supplemental Information S2.7). Lipophilicity measures are likely important here because they influence the transport of chemicals through cell membranes,46 and because they are indicators of differences in substrate affinities for particular CYP450 enzymes.81 Likewise, electronic and topological descriptors may capture binding affinities on active residues of CYP450 enzymes. In the fup QSAR, lipophilicity descriptors (QSAR-predicted LogP, and PaDEL descriptors CrippenLogP, and XLogP) and water solubility made up the top four descriptors, with electronic/topographical descriptors making up the remaining 5 of the top 10 descriptors. Lipophilicity influences the partitioning of chemicals between the aqueous and protein components of plasma, and is known to be a primary driver of plasma protein binding.67 Concurrently, electronic/topographical descriptors reflect the influence of molecular structure and charge interactions on plasma protein binding.67 Thus, the QSAR model appears to have captured critical aspects governing fup.
Table 3:
OECD Guidelines for QSAR models to be used in regulatory contexts
| Number | OECD Guidelines | Met? | Explanation |
|---|---|---|---|
| 1 | A defined endpoint | Yes | Models explicitly predict Clint and fup |
| 2 | An unambiguous algorithm | Yes | Algorithms are publicly available and published in R packages |
| 3 | A defined domain of applicability3 | Yes | Used method by Roy et al. (2015)62 |
| 4 | Appropriate measures of goodness-of–fit, robustness and predictivity | Yes | 5-fold cross validation were used to construct models (robustness), accuracy and RSME metrics were applied to models (goodness of fit), independent test sets used to evaluate models (predictivity) |
| 5 | A mechanistic interpretation, if possible | Yes | Highly ranked descriptors with mechanistic interpretations; see text for specific details |
Organization for Economic Cooperation and Development (OECD) guidelines for QSAR models to be used for regulatory purposes, along with if and how each are met by the models presented here.
3.3. Risk-Based Prioritization Approach
3.3.1. Evaluation of QSAR model produced Css values.
Linear regression analysis (in log10 space) was used to evaluate QSAR-produced predictions translated to a TK context (See section 2.3 for details). First, Css values produced using in vitro parameters were generally well represented when in vitro values of Clint were binned (R2 = 0.615). Thus, if reasonably accurate values for Clint (via medians of bin) can be predicted from structure, it would be possible to make reasonable predictions of Css. Next, Css values produced using in vitro parameters was predicted with low-to-moderate success using in silico parameters (R2=0.195). Lastly, when either fup (R2=0.006), Clint (R2 = 0.127) or both parameters (R2=0.038) were supplied with y-randomized values, predicted Css were much less predictive of in-in vitro data. Complete details on the linear models discussed here are presented in the Supplemental Information (S2.11).
3.3.2. Evaluation of Bioactivity-Exposure Relationship using the ToxCast Test Set
For scenarios 2–6 described in 2.3, BERs were calculated and assessed against BERs calculated with continuous in vitro parameters (i.e., scenario 1) using correlation (Spearman’s ρ) and RMSE with the ToxCast test set (See Supplementary Information S2.12). The highest correlation/lowest RMSE (ρ=0.938, RMSE=17704) was when the in vitro data were binned. A slightly lower correlation/moderately higher RMSE occurred (ρ=0.852, RMSE=44115) when the QSAR models supplied the parameter values. Of the 91 chemicals in the ToxCast test set with active assay data, 16 had exposure estimates that exceeded the Q10 of the estimated oral equivalent dose (OED) when continuous in vitro parameters were used, and thus were negative on a log10 scale (Fig 2A). When Clint and fup were replaced with QSAR supplied values, negative log10 BER values were predicted for all but 3 chemicals (that is, an 18.75% false negative rate). Meanwhile, negative log10 BER values (that is, false positives) were predicted for only 7 additional chemicals (corresponding to a false positive rate of 9.3 %) (Fig 2B).
Fig 2.

Bioactivity-Exposure Ratios (BERs) for 91 of the chemicals of the ToxCast test set. BER = Q10 toxicological values / Highest Expected Exposure Scenarios. Values transformed to a log10 scale; values < 0 have exposure values that exceed Q10 values. Scenarios (1–6) varied by composition of the Clint and fup parameter inputs into the steady state concentration calculations in the httk package. Scenarios shown here include (A) Continuous in vitro parameter values (Scenario 1), (B) QSAR-predicted (Clint: 3-Bin All Descriptors (30); fup: All (30)) parameter values (Scenario 3), and (C) y-randomized parameter values (Scenario 6). See Section 2.3 for list all 6 scenarios. A list of chemicals and data used to construct these plots is included in the Supporting Information (S2.12).
Interestingly, only modest reductions in correlation occurred when either Clint (ρ = 0.68), fup (ρ = 0.765), or both (ρ = 0.72) were y-randomized (Fig 2C). The replacement of Clint with y-randomized values resulted in 3 false negatives (18.75% false negative rate), while the replacement of fup or both with y-randomized values resulted in 5 false negatives (31.25% false negative rate). In addition, replacing either or both with y-randomized values resulted in 8–13 false positives (corresponding to 10–17.3% false positive rate). In contrast, while the y-randomization of fup (RMSE=48866) or both fup and Clint (RMSE=39752) resulted in RMSEs of similar magnitude to the completely QSAR supplied model, the RMSE was an order of magnitude when Clint (RMSE=234798) alone was y-randomized. Overall, these results demonstrate that if values for fup and Clint are chosen that simply lie within the range of biological plausibility (i.e., y-randomized points were selected at random from in vitro values), a reasonable ordering of chemicals by bioactivity and subsequent risk may be made. However, parameter values provided by the QSAR models resulted in a better relative ordering of chemicals by BER, fewer wrongly classified BER estimates (either < or > 0), and estimates that were closer to those produced using measured in vitro values, particular for Clint. Thus, the QSAR models presented can significantly contribute toward chemical prioritization.
3.3.3. Bioactivity-Exposure Relationship Risk Prioritization Applied to Tox21 Dataset
Lastly, a significant portion of the Tox21 dataset used here (see Supplemental Information S.13) is currently missing either in vitro Clint or fup values (5636/6484, 87.4%). However, the proportions of chemicals with httk-calculated BER values < 1 (that is, where expected exposures exceed bioactive doses) was similar between the subset of chemicals using available in vitro parameter values (148/848; 17.45%)(Fig 3A) and when all chemicals used in silico parameter values (1137/6484; 17.53%)(Fig 3B). In addition, for the chemicals for which in vitro data were available, the overall concordance in BER classification (i.e., either > or < 1) between the in vitro and in silico predicted values was high (90.5%). Fifty-five chemicals (6.48% of in vitro dataset) chemicals that were predicted to have BERs < 1 when in vitro data are used were predicted to have BERs > 1 when in silico values are used. This corresponded to a false negative rate of 37.16%. Conversely, 25 chemicals (3.0% of in vitro dataset) predicted by in vitro data to have BERs > 1 where predicted to have BERS < 1 when in silico parameter values were used. This corresponded to a false positive rate of 3.6%. A closer look at the false negatives showed that 20% had in silico predicted BERs of between 1–2, while about 28% of false positives had in vitro predicted BERs between 1–2; thus, these were near misses. Increasing the precision of future classifications may be important for better risk prioritization of some chemicals. On the other hand, very rapid in vitro Clint estimates may greatly exceed reasonable expectations for liver blood flow rates which provide an upper limit on possible hepatic clearance and therefore reduce the impact of changes in accuracy of predictions at the upper extreme. Overall, however, the relatively low proportion of false negatives and positives may indicate that the current precision of the Clint QSAR model adequately provided predictions in bioactivity space.
Fig 3.

Expected exposure concentrations (blue) versus bioactivity concentrations (red) for 6484 chemicals of the Tox21 dataset. The source of Clint and fup values provided as inputs into CSS in the httk package differed, representing (A) continuous in vitro parameter values and (B) QSAR-predicted parameter values. Chemicals in both (A) and (B) are ordered by increasing bioactivity-exposure ratio (BER)as predicted in (B) (that is, for all 6484 chemicals). White points in (A) are drawn as placeholders for all the chemicals without available toxicokinetic data (5636) with which to estimate bioactivity concentrations. These points are positioned at concentrations 25% greater than the highest exposure concentration estimated for that chemical. Black and yellow points mark 10th quantile toxicological values (Q10) calculated using in vitro (A) or QSAR-predicted (B) parameter values. Black points indicate chemicals for which Q10 values ARE NOT exceeded by maximum exposures. Yellow points indicate chemicals for which Q10 values ARE exceeded by maximum exposure values. Note: for figure clarity, chemicals with exposure values < 10−7 (9) or bioactivity concentrations > 107 (17 A, 77 B) were excluded from the figures. A list of chemicals and data used to construct these plots is available in Supplemental Information section S2.13.
BERs of concern are driven by either high predicted exposure or potent bioactivity. In both cases, there can be significant uncertainty, as indicated by wide distributions in both bioactivity and exposure for many chemicals in the Tox21 dataset (Fig 3). This uncertainty in large part derives from the lack of empirical data used in model-based approaches of estimating exposure and bioactivity. In the case of bioactivity, raw Clint and fup values in databases, themselves produced from experimentally variable assays, were processed into comparable values suitable for modeling using several simplifying assumptions (see Section 2.1). Further, the underlying suite of parameter values employed in the reverse-dosimetry TK modeling methodology are often modeled estimates themselves, and thus subject to their own uncertainty. In the case of exposure, uncertainty is derived from the empirical data and methodology available from which exposure estimates are made. As described in the Supporting Information (S1.5.2), some estimates of exposure (~10%) were derived from empirical data (The National Health and Nutrition Examination Survey(NHANES)74), but the majority of exposure predictions for the chemicals in the ToxCast test set (as well as the Tox21 set) chemicals were derived from a consensus-based modeling approach using the Systematic Empirical Evaluation Model (SEEM) Framework.73 When considering the Tox21 set, only about ~1.3% of the 6484 chemicals included in the BER analysis had empirical exposure data included in NHANES. Thus, while there is variation in range and quality of bioactivity ranges for individual chemicals, uncertainty in the aggregate is also driven by a lack of empirical exposure data.
Several factors compensate for uncertainty in the values of Clint and fup used to construct models and the assumptions used to calculate bioactivity and exposure. First, by employing several independent test sets to evaluate Clint and fup, and explicitly comparing the use of in vitro versus in silico parameter values within the TK model, we were able to quantify individual and combined model performance in both TK and risk prioritization contexts. Next, the TK model used for all Css and reverse dosimetry calculations (httk) uses a Monte Carlo approach to estimate probabilistic distributions of OEDs, allowing us to be conservative in the values we choose for inclusion in the BER. Finally, these models are intended to inform risk prioritization rather than risk assessment. That is, while there in insufficient confidence in BER’s estimated here to warrant regulatory activity, a larger magnitude of exceedance of exposure to bioactivity may warrant prioritization for risk assessment attention.
Finally, limited human data, the high cost of in vivo animal studies, and large knowledge gaps for current and emerging pollutants makes even risk prioritization of environmental contaminants challenging. When used in conjunction with human exposure estimates and in vitro toxicity data, TK models can be employed to evaluate risk across large chemical inventories as part of a strategy to focus limited in vivo testing resources.8, 12, 14 The models provided by the httk package of program R is an example of a TK modeling platform that aims to make reasonable estimates of in vivo chemical concentrations with minimal information. At a minimum, httk requires only values for Clint and fup to estimate steady-state dynamics. By combining this with available environmental exposure and toxicological estimates, chemical risk prioritization capability is within reach for an increasing number of chemicals. Unfortunately, in vitro Clint and fup values are still not available for a significant number of chemicals, as evidenced by the 88% of the Tox21 dataset used in this study without available data. The Tox21 library is itself a subset of the larger Toxic Substances Chemical Control Inventory3–5 chemical list that must be prioritized to identify chemicals of concern.13 Until TK data are available for these chemicals it is critical that reliable in silico-based estimations are available. These QSAR models meet this need in a way that in both transparent and publicly accessible. While the limitations of these models are currently unsuitable for setting regulatory limits, they are well suited to help inform regulatory processes, including the implementation of safety standards mandated through the Toxic Substances Control Act.82
Supplementary Material
SYNOPSIS:
Open source QSAR models that produce in silico parameters for toxicokinetic models can contribute to transparent, high throughput risk prioritization of chemicals over a broad chemical domain.
ACKNOWLEDGEMENT
Many thanks go out to Brandon Veber for help with development of this project, Woody Setzer for thoughtful discussions, and Cecilia Tan and Barbara Wetmore for providing feedback on the manuscript during the internal review process.
FUNDING SOURCES
The U.S. Environmental Protection Agency through its Office of Research and Development funded and managed the research described here.
Footnotes
SUPPORTING INFORMATION
Additional details used in the methods are found in the Microsoft Document files “S1_Dawson et al._Supporting_Information.docx”. Additional information, including datasets and graphical results are found in the Microsoft Excel file “S2_Dawson et al. Supporting Information.xlsx”. This is an MS Excel file with the following sheets: S2.1 illustrates Clint hepatic flow calculations, S2.2 – 5 include training and test data sets; S2.6–7 include figures illustrating Clint model selection criteria and assemblages of model descriptors; S2.8 includes confusion matrices for evaluation Clint model, S2.9–10 include figures illustrating fup model selection criteria and assemblages of model descriptors (with ranges); S2.11 includes tables of model assessments of the Clint test set, S2.12 includes information relevant to BER calculations for the ToxCast test set, S2.13 includes information relevant to BER calculations for Tox21 chemicals, and S2.14 provides information on different transformations for fup.
DECLARATION OF INTEREST
This publication was subjected to an administrative review and approved for submission by the U.S. Environmental Protection Agency. The research presented here are the work of the author and does not necessarily represent Agency policy or opinion. The authors declare no competing financial interests.
REFERENCES
- 1.Egeghy PP; Judson R; Gangwal S; Mosher S; Smith D; Vail J; Hubal EAC, The Exposure Data Landscape for Manufactured Chemicals. Sci. Total Environ 2012, 414, 159–166. [DOI] [PubMed] [Google Scholar]
- 2.Muir DCG; Howard PH, Are There Other Persistent Organic Pollutants? A Challenge for Environmental Chemists. Environ. Sci. Technol 2006, 40, (23), 7157–7166. [DOI] [PubMed] [Google Scholar]
- 3.“Toxic Substances Control Act”(Tsca). Public Law 94–469, October 11, 1976. In Congress, U. S., Ed. 1976. [Google Scholar]
- 4.Frank R Lautenberg Chemical Safety for the 21st Century Act. Public Law. 114–182 June, 22, 2016. In Congress, U. S., Ed. [Google Scholar]
- 5.Tsca Chemical Substance Inventory In US Environmental Protection Agency,: 2021. [Google Scholar]
- 6.Wambaugh JF; Wetmore BA; Pearce R; Strope C; Goldsmith R; Sluka JP; Sedykh A; Tropsha A; Bosgra S; Shah I; Judson R; Thomas RS; Setzer RW, Toxicokinetic Triage for Environmental Chemicals. Toxicol Sci 2015, 147, (1), 55–67. [DOI] [PMC free article] [PubMed] [Google Scholar]
- 7.Phillips MB; Leonard JA; Grulke CM; Chang DT; Edwards SW; Brooks R; Goldsmith MR; El-Masri H; Tan YM, A Workflow to Investigate Exposure and Pharmacokinetic Influences on High-Throughput in Vitro Chemical Screening Based on Adverse Outcome Pathways. Environ. Health Perspect 2016, 124, (1), 53–60. [DOI] [PMC free article] [PubMed] [Google Scholar]
- 8.Rotroff DM; Wetmore BA; Dix DJ; Ferguson SS; Clewell HJ; Houck KA; LeCluyse EL; Andersen ME; Judson RS; Smith CM; Sochaski MA; Kavlock RJ; Boellmann F; Martin MT; Reif DM; Wambaugh JF; Thomas RS, Incorporating Human Dosimetry and Exposure into High-Throughput in Vitro Toxicity Screening. Toxicol Sci 2010, 117, (2), 348–358. [DOI] [PMC free article] [PubMed] [Google Scholar]
- 9.Wetmore BA; Wambaugh JF; Ferguson SS; Sochaski MA; Rotroff DM; Freeman K; Clewell HJ; Dix DJ; Andersen ME; Houck KA; Allen B; Judson RS; Singh R; Kavlock RJ; Richard AM; Thomas RS, Integration of Dosimetry, Exposure, and High-Throughput Screening Data in Chemical Toxicity Assessment. Toxicol Sci 2012, 125, (1), 157–174. [DOI] [PubMed] [Google Scholar]
- 10.Wetmore BA; Wambaugh JF; Allen B; Ferguson SS; Sochaski MA; Setzer RW; Houck KA; Strope CL; Cantwell K; Judson RS; LeCluyse E; Clewell HJ; Thomas RS; Andersen ME, Incorporating High-Throughput Exposure Predictions with Dosimetry-Adjusted in Vitro Bioactivity to Inform Chemical Toxicity Testing. Toxicol Sci 2015, 148, (1), 121–136. [DOI] [PMC free article] [PubMed] [Google Scholar]
- 11.Knaak JB; Dary CC; Zhang XF; Gerlach RW; Tornero-Velez R; Chang DT; Goldsmith R; Blancato JN, Parameters for Pyrethroid Insecticide Qsar and Pbpk/Pd Models for Human Risk Assessment. Rev Environ Contam T 2012, 219, 1–114. [DOI] [PubMed] [Google Scholar]
- 12.Thomas RS; Philbert MA; Auerbach SS; Wetmore BA; Devito MJ; Cote I; Rowlands JC; Whelan MP; Hays SM; Andersen ME; Meek ME; Reiter LW; Lambert JC; Clewell HJ; Stephens ML; Zhao QJ; Wesselkamper SC; Flowers L; Carney EW; Pastoor TP; Petersen DD; Yauk CL; Nong A, Incorporating New Technologies into Toxicity Testing and Risk Assessment: Moving from 21st Century Vision to a Data-Driven Framework. Toxicol Sci 2013, 136, (1), 4–18. [DOI] [PMC free article] [PubMed] [Google Scholar]
- 13.Tice RR; Austin CP; Kavlock RJ; Bucher JR, Improving the Human Hazard Characterization of Chemicals: A Tox21 Update. Environ Health Perspect 2013, 121, (7), 756–65. [DOI] [PMC free article] [PubMed] [Google Scholar]
- 14.Sipes NS; Wambaugh JF; Pearce R; Auerbach SS; Wetmore BA; Hsieh JH; Shapiro AJ; Svoboda D; DeVito MJ; Ferguson SS, An Intuitive Approach for Predicting Potential Human Health Risk with the Tox21 10k Library. Environ. Sci. Technol 2017, 51, (18), 10786–10796. [DOI] [PMC free article] [PubMed] [Google Scholar]
- 15.Espie P; Tytgat D; Sargentini-Maier ML; Poggesi I; Watelet JB, Physiologically Based Pharmacokinetics (Pbpk). Drug Metab. Rev 2009, 41, (3), 391–407. [DOI] [PubMed] [Google Scholar]
- 16.Coecke S; Pelkonen O; Leite SB; Bernauer U; Bessems JG; Bois FY; Gundert-Remy U; Loizou G; Testai E; Zaldívar J-M, Toxicokinetics as a Key to the Integrated Toxicity Risk Assessment Based Primarily on Non-Animal Approaches. Toxicol. Vitro 2013, 27, (5), 1570–1577. [DOI] [PubMed] [Google Scholar]
- 17.McLanahan ED; El-Masri HA; Sweeney LM; Kopylev LY; Clewell HJ; Wambaugh JF; Schlosser PM, Physiologically Based Pharmacokinetic Model Use in Risk Assessment-Why Being Published Is Not Enough. Toxicol Sci 2012, 126, (1), 5–15. [DOI] [PubMed] [Google Scholar]
- 18.O’ Flaherty E, J., Toxicants and Drugs: Kinetics and Dynamics John Wiley & Sons. : 1981. [Google Scholar]
- 19.Tan Y-M; Liao KH; Clewell HJ, Reverse Dosimetry: Interpreting Trihalomethanes Biomonitoring Data Using Physiologically Based Pharmacokinetic Modeling. Journal of exposure science & environmental epidemiology 2007, 17, (7), 591–603. [DOI] [PubMed] [Google Scholar]
- 20.Wetmore BA; Wambaugh JF; Allen B; Ferguson SS; Sochaski MA; Setzer RW; Houck KA; Strope CL; Cantwell K; Judson RS; LeCluyse E; Clewell HJ; Thomas RS; Andersen ME, Incorporating High-Throughput Exposure Predictions with Dosimetry-Adjusted in Vitro Bioactivity to Inform Chemical Toxicity Testing. Toxicol Sci 2015, 148, (1), 121–36. [DOI] [PMC free article] [PubMed] [Google Scholar]
- 21.Bell SM; Chang X; Wambaugh JF; Allen DG; Bartels M; Brouwer KLR; Casey WM; Choksi N; Ferguson SS; Fraczkiewicz G; Jarabek AM; Ke A; Lumen A; Lynn SG; Paini A; Price PS; Ring C; Simon TW; Sipes NS; Sprankle CS; Strickland J; Troutman J; Wetmore BA; Kleinstreuer NC, In Vitro to in Vivo Extrapolation for High Throughput Prioritization and Decision Making. Toxicol. Vitro 2018, 47, 213–227. [DOI] [PMC free article] [PubMed] [Google Scholar]
- 22.Wetmore BA; Wambaugh JF; Ferguson SS; Sochaski MA; Rotroff DM; Freeman K; Clewell HJ 3rd; Dix DJ; Andersen ME; Houck KA; Allen B; Judson RS; Singh R; Kavlock RJ; Richard AM; Thomas RS, Integration of Dosimetry, Exposure, and High-Throughput Screening Data in Chemical Toxicity Assessment. Toxicol Sci 2012, 125, (1), 157–74. [DOI] [PubMed] [Google Scholar]
- 23.Tonnelier A; Coecke S; Zaldívar J-M, Screening of Chemicals for Human Bioaccumulative Potential with a Physiologically Based Toxicokinetic Model. Arch. Toxicol 2012, 86, (3), 393–403. [DOI] [PMC free article] [PubMed] [Google Scholar]
- 24.Wambaugh JF; Wetmore BA; Ring CL; Nicolas CI; Pearce R; Honda G; Dinallo R; Angus D; Gilbert J; Sierra T; Badrinarayanan A; Snodgrass B; Brockman A; Strock C; Setzer W; Thomas RS, Assessing Toxicokinetic Uncertainty and Variability in Risk Prioritization In 2019. [DOI] [PMC free article] [PubMed]
- 25.Ingle BL; Veber BC; Nichols JW; Tornero-Velez R, Informing the Human Plasma Protein Binding of Environmental Chemicals by Machine Learning in the Pharmaceutical Space: Applicability Domain and Limits of Predictability. J Chem Inf Model 2016, 56, (11), 2243–2252. [DOI] [PubMed] [Google Scholar]
- 26.Kirman CR; Aylward LL; Wetmore BA; Thomas RS; Sochaski M; Ferguson SS; Csiszar SA; Jolliet O, Quantitative Property–Property Relationship for Screening-Level Prediction of Intrinsic Clearance: A Tool for Exposure Modeling for High-Throughput Toxicity Screening Data. Applied In Vitro Toxicology 2015, 1, (2), 140–146. [Google Scholar]
- 27.Votano JR; Parham M; Hall LM; Hall LH; Kier LB; Oloff S; Tropsha A, Qsar Modeling of Human Serum Protein Binding with Several Modeling Techniques Utilizing Structure-Information Representation. J. Med. Chem 2006, 49, (24), 7169–7181. [DOI] [PubMed] [Google Scholar]
- 28.Zhu XW; Sedykh A; Zhu H; Liu SS; Tropsha A, The Use of Pseudo-Equilibrium Constant Affords Improved Qsar Models of Human Plasma Protein Binding. Pharm Res-Dordr 2013, 30, (7), 1790–1798. [DOI] [PMC free article] [PubMed] [Google Scholar]
- 29.Hallifax D; Foster JA; Houston JB, Prediction of Human Metabolic Clearance from in Vitro Systems: Retrospective Analysis and Prospective View. Pharm Res-Dordr 2010, 27, (10), 2150–2161. [DOI] [PubMed] [Google Scholar]
- 30.Poulin P; Haddad S, Toward a New Paradigm for the Efficient in Vitro-in Vivo Extrapolation of Metabolic Clearance in Humans from Hepatocyte Data. J. Pharm. Sci 2013, 102, (9), 3239–3251. [DOI] [PubMed] [Google Scholar]
- 31.Varma MV; Steyn SJ; Allerton C; El-Kattan AF, Predicting Clearance Mechanism in Drug Discovery: Extended Clearance Classification System (Eccs). Pharm Res-Dordr 2015, 32, (12), 3785–3802. [DOI] [PubMed] [Google Scholar]
- 32.Long A; Walker JD, Quantitative Structure-Activity Relationships for Predicting Metabolism and Modeling Cytochrome P450 Enzyme Activities. Environmental toxicology and chemistry 2003, 22, (8), 1894–1899. [DOI] [PubMed] [Google Scholar]
- 33.Peyret T; Krishnan K, Quantitative Property-Property Relationship for Screening-Level Prediction of Intrinsic Clearance of Volatile Organic Chemicals in Rats and Its Integration within Pbpk Models to Predict Inhalation Pharmacokinetics in Humans. J Toxicol 2012, 2012, 286079. [DOI] [PMC free article] [PubMed] [Google Scholar]
- 34.Liu R; Schyman P; Wallqvist A, Critically Assessing the Predictive Power of Qsar Models for Human Liver Microsomal Stability. J Chem Inf Model 2015, 55, (8), 1566–75. [DOI] [PubMed] [Google Scholar]
- 35.Pirovano A; Brandmaier S; Huijbregts MA; Ragas AM; Veltman K; Hendriks AJ, Qsars for Estimating Intrinsic Hepatic Clearance of Organic Chemicals in Humans. Environ Toxicol Pharmacol 2016, 42, 190–7. [DOI] [PubMed] [Google Scholar]
- 36.Watanabe R; Esaki T; Kawashima H; Natsume-Kitatani Y; Nagao C; Ohashi R; Mizuguchi K, Predicting Fraction Unbound in Human Plasma from Chemical Structure: Improved Accuracy in the Low Value Ranges. Mol Pharm 2018, 15, (11), 5302–5311. [DOI] [PubMed] [Google Scholar]
- 37.de Groot MJ, Designing Better Drugs: Predicting Cytochrome P450 Metabolism. Drug Discovery Today 2006, 11, (13), 601–606. [DOI] [PubMed] [Google Scholar]
- 38.Kirchmair J; Göller AH; Lang D; Kunze J; Testa B; Wilson ID; Glen RC; Schneider G, Predicting Drug Metabolism: Experiment and/or Computation? Nature Reviews Drug Discovery 2015, 14, (6), 387–404. [DOI] [PubMed] [Google Scholar]
- 39.Valerio LG, In Silico Toxicology for the Pharmaceutical Sciences. Toxicol. Appl. Pharmacol 2009, 241, (3), 356–370. [DOI] [PubMed] [Google Scholar]
- 40.Kazmi SR; Jun R; Yu MS; Jung C; Na D, In Silico Approaches and Tools for the Prediction of Drug Metabolism and Fate: A Review. Comput Biol Med 2019, 106, 54–64. [DOI] [PubMed] [Google Scholar]
- 41.Bento AP; Gaulton A; Hersey A; Bellis LJ; Chambers J; Davies M; Kruger FA; Light Y; Mak L; McGlinchey S; Nowotka M; Papadatos G; Santos R; Overington JP, The Chembl Bioactivity Database: An Update. Nucleic Acids Res 2014, 42, (Database issue), D1083–90. [DOI] [PMC free article] [PubMed] [Google Scholar]
- 42.Gaulton A; Bellis LJ; Bento AP; Chambers J; Davies M; Hersey A; Light Y; McGlinchey S; Michalovich D; Al-Lazikani B; Overington JP, Chembl: A Large-Scale Bioactivity Database for Drug Discovery. Nucleic Acids Res 2012, 40, (Database issue), D1100–7. [DOI] [PMC free article] [PubMed] [Google Scholar]
- 43.Gaulton A; Hersey A; Nowotka M; Bento AP; Chambers J; Mendez D; Mutowo P; Atkinson F; Bellis LJ; Cibrian-Uhalte E; Davies M; Dedman N; Karlsson A; Magarinos MP; Overington JP; Papadatos G; Smit I; Leach AR, The Chembl Database in 2017. Nucleic Acids Res 2017, 45, (D1), D945–D954. [DOI] [PMC free article] [PubMed] [Google Scholar]
- 44.Richard AM; Judson RS; Houck KA; Grulke CM; Volarath P; Thillainadarajah I; Yang C; Rathman J; Martin MT; Wambaugh JF, Toxcast Chemical Landscape: Paving the Road to 21st Century Toxicology. Chem. Res. Toxicol 2016, 29, (8), 1225–1251. [DOI] [PubMed] [Google Scholar]
- 45.Kilford PJ; Gertz M; Houston JB; Galetin A, Hepatocellular Binding of Drugs: Correction for Unbound Fraction in Hepatocyte Incubations Using Microsomal Binding or Drug Lipophilicity Data. Drug Metab Dispos 2008, 36, (7), 1194–7. [DOI] [PubMed] [Google Scholar]
- 46.Lewis DFV; Dickens M, Factors Influencing Rates and Clearance in P450-Mediated Reactions: Qsars for Substrates of the Xenobiotic-Metabolizing Hepatic Microsomal P450s. Toxicology 2002, 170, 45–53. [DOI] [PubMed] [Google Scholar]
- 47.Keefer C; Chang G; Carlo A; Novak JJ; Banker M; Carey J; Cianfrogna J; Eng H; Jagla C; Johnson N; Jones R; Jordan S; Lazzaro S; Liu J; Scott Obach R; Riccardi K; Tess D; Umland J; Racich J; Varma M; Visswanathan R; Di L, Mechanistic Insights on Clearance and Inhibition Discordance between Liver Microsomes and Hepatocytes When Clearance in Liver Microsomes Is Higher Than in Hepatocytes. Eur J Pharm Sci 2020, 155, 105541. [DOI] [PubMed] [Google Scholar]
- 48.Brown RP; Delp MD; Lindstedt SL; Rhomberg LR; Beliles RP, Physiological Parameter Values for Physiologically Based Pharmacokinetic Models. Toxicol Ind Health 1997, 13, (4), 407–84. [DOI] [PubMed] [Google Scholar]
- 49.Ito K; Houston JB, Comparison of the Use of Liver Models for Predicting Drug Clearance Using in Vitro Kinetic Data from Hepatic Microsomes and Isolated Hepatocytes. Pharm Res-Dordr 2004, 21, (5), 785–792. [DOI] [PubMed] [Google Scholar]
- 50.Pearce RG; Setzer RW; Strope CL; Wambaugh JF; Sipes NS, Httk: R Package for High-Throughput Toxicokinetics. J Stat Softw 2017, 79, (4), 1–26. [DOI] [PMC free article] [PubMed] [Google Scholar]
- 51.Obach RS; Lombardo F; Waters NJ, Trend Analysis of a Database of Intravenous Pharmacokinetic Parameters in Humans for 670 Drug Compounds. Drug Metab. Dispos 2008, 36, (7), 1385–1405. [DOI] [PubMed] [Google Scholar]
- 52.Yap CW, Padel-Descriptor: An Open Source Software to Calculate Molecular Descriptors and Fingerprints. J Comput Chem 2011, 32, (7), 1466–74. [DOI] [PubMed] [Google Scholar]
- 53.Mansouri K; Grulke CM; Judson RS; Williams AJ, Opera Models for Predicting Physicochemical Properties and Environmental Fate Endpoints. J Cheminform 2018, 10, (1), 10. [DOI] [PMC free article] [PubMed] [Google Scholar]
- 54.Wang J; Hallinger DR; Murr AS; Buckalew AR; Lougee RR; Richard AM; Laws SC; Stoker TE, High-Throughput Screening and Chemotype-Enrichment Analysis of Toxcast Phase Ii Chemicals Evaluated for Human Sodium-Iodide Symporter (Nis) Inhibition. Environ. Int 2019, 126, 377–386. [DOI] [PMC free article] [PubMed] [Google Scholar]
- 55.Yang C; Tarkhov A; Marusczyk J; Bienfait B; Gasteiger J; Kleinoeder T; Magdziarz T; Sacher O; Schwab CH; Schwoebel J; Terfloth L; Arvidson K; Richard A; Worth A; Rathman J, New Publicly Available Chemical Query Language, Csrml, to Support Chemotype Representations for Application to Data Mining and Modeling. J Chem Inf Model 2015, 55, (3), 510–28. [DOI] [PubMed] [Google Scholar]
- 56.Guha R, Chemical Informatics Functionality in R. Journal of Statistical Software 2007, 6, (18). [Google Scholar]
- 57.MDL Information Systems Inc. Maccs Keys , 14600 Catalina Street, San Leandro, CA: 94577. [Google Scholar]
- 58.Willighagen EL; Mayfield JW; Alvarsson J; Berg A; Carlsson L; Jeliazkova N; Kuhn S; Pluskal T; Rojas-Cherto M; Spjuth O; Torrance G; Evelo CT; Guha R; Steinbeck C, The Chemistry Development Kit (Cdk) V2.0: Atom Typing, Depiction, Molecular Formulas, and Substructure Searching. J Cheminform 2017, 9, (1), 33. [DOI] [PMC free article] [PubMed] [Google Scholar]
- 59.Liaw A; Wiener M, Classification and Regression by Randomforest. R News 2002, 2, (3), 18–22. [Google Scholar]
- 60.Kuhn M Caret: Classification and Regression Training, 2019.
- 61.Kuhn M, Caret: Classification and Regression Training. R Package Version 6.0–85 In R Project, https://CRAN.R-project.org/package=caret: 2020. [Google Scholar]
- 62.Roy K; Kar S; Ambure P, On a Simple Approach for Determining Applicability Domain of Qsar Models. Chemometrics and Intelligent Laboratory Systems 2015, 145, 22–29. [Google Scholar]
- 63.Kuhn M; Vaughan D Yardstick: Tidy Characterizations of Model Performance: R Package Version 0.0.7, CRAN: 2020. [Google Scholar]
- 64.Buckland M; Gey F, The Relationship between Recall and Precision. Journal of the American Society for Information Science 1994, 45, (`), 12–19. [Google Scholar]
- 65.Powers D Evaluation: From Precision, Recall and F Factor to Roc, Informedness, Markedness and Correlation; Flinders University: 2007. [Google Scholar]
- 66.Zhu XW; Sedykh A; Zhu H; Liu SS; Tropsha A, The Use of Pseudo-Equilibrium Constant Affords Improved Qsar Models of Human Plasma Protein Binding. Pharm Res 2013, 30, (7), 1790–8. [DOI] [PMC free article] [PubMed] [Google Scholar]
- 67.Lambrinidis G; Vallianatou T; Tsantili-Kakoulidou A, In Vitro, in Silico and Integrated Strategies for the Estimation of Plasma Protein Binding. A Review. Adv Drug Deliv Rev 2015, 86, 27–45. [DOI] [PubMed] [Google Scholar]
- 68.Yun YE; Tornero-Velez R; Purucker ST; Chang DT; Edginton AN, Evaluation of Quantitative Structure Property Relationship Algorithms for Predicting Plasma Protein Binding in Humans. Computational Toxicology 2021, 17, 100142. [DOI] [PMC free article] [PubMed] [Google Scholar]
- 69.Toma C; Gadaleta D; Roncaglioni A; Toropov A; Toropova A; Marzo M; Benfenati E, Qsar Development for Plasma Protein Binding: Influence of the Ionization State. Pharm Res 2019, 36, (2), 28. [DOI] [PMC free article] [PubMed] [Google Scholar]
- 70.Filer DL; Kothiya P; Setzer RW; Judson RS; Martin MT, Tcpl: The Toxcast Pipeline for High-Throughput Screening Data. Bioinformatics 2017, 33, (4), 618–620. [DOI] [PubMed] [Google Scholar]
- 71.Pearce RG; Setzer RW; Strope CL; Sipes NS; Wambaugh JF, Httk: R Package for High-Throughput Toxicokinetics. Journal of Statistical Software 2017, 79, (4). [DOI] [PMC free article] [PubMed] [Google Scholar]
- 72.U.S. EPA Toxcast & Tox21 Data Spreadsheet for in-Vitro Dbv3.2 https://www.epa.gov/chemical-research/toxicity-forecaster-toxcasttm-data (02/October/2020),
- 73.Ring CL; Arnot JA; Bennett DH; Egeghy PP; Fantke P; Huang L; Isaacs KK; Jolliet O; Phillips KA; Price PS; Shin HM; Westgate JN; Setzer RW; Wambaugh JF, Consensus Modeling of Median Chemical Intake for the U.S. Population Based on Predictions of Exposure Pathways. Environ Sci Technol 2019, 53, (2), 719–732. [DOI] [PMC free article] [PubMed] [Google Scholar]
- 74.Centers for Disease Control and Prevention (CDC). National Center for Health Statistics (NCHS), National Health and Nutrition Examination Survey Data In U.S. Department of Health and Human Services, Centers for Disease Control and Prevention: Hyattsville, MD., 2009–2010. [Google Scholar]
- 75.Hollander M; Wolfe DA; Chicken E, Nonparametric Statistical Methods John Wiley & Sons: 2013; Vol. 751. [Google Scholar]
- 76.Paixao P; Gouveia LF; Morais JA, Prediction of the in Vitro Intrinsic Clearance Determined in Suspensions of Human Hepatocytes by Using Artificial Neural Networks. Eur J Pharm Sci 2010, 39, (5), 310–21. [DOI] [PubMed] [Google Scholar]
- 77.Nikolic K; Agababa D, Prediction of Hepatic Microsomal Intrinsic Clearance and Human Clearance Values for Drugs. J Mol Graph Model 2009, 28, (3), 245–52. [DOI] [PubMed] [Google Scholar]
- 78.Golbraikh A; Tropsha A, Predictive Qsar Modeling Based on Diversity Sampling of Experimental Datasets for the Training and Test Set Selection. Molecular Diversity 2002, 5, 231–243. [DOI] [PubMed] [Google Scholar]
- 79.Ghafourian T; Amin Z, Qsar Models for the Prediction of Plasma Protein Binding. Bioimpacts 2013, 3, (1), 21–7. [DOI] [PMC free article] [PubMed] [Google Scholar]
- 80.Kosugi Y; Hosea N, Prediction of Oral Pharmacokinetics Using a Combination of in Silico Descriptors and in Vitro Adme Properties. Mol Pharm 2021. [DOI] [PubMed]
- 81.Lewis DFV, On the Recognition of Mammalian Microsomal Cytochrome P450 Substrates and Their Characteristics. Biochem. Pharmacol 2000, 60, 293–306. [DOI] [PubMed] [Google Scholar]
- 82.Zeeman M; Auer CM; Clements RG; Nabholz JV; Boethling RS, Epa US Regulator Perspectives on the Use of Qsar for New and Existing Chemicla Evaluations. SAR QSAR Environ. Res 1995, 3, (3), 179–201. [DOI] [PubMed] [Google Scholar]
Associated Data
This section collects any data citations, data availability statements, or supplementary materials included in this article.