

Abstract
People who have Alzheimer's disease neuropathologic change (ADNC) typically associated with dementia but not the associated cognitive decline can be considered to be “resilient” to the effects of ADNC. We have previously reported lower neocortical levels of hyperphosphorylated tau (pTau) and less limbic‐predominant age‐related TDP‐43 encephalopathy neuropathologic change (LATE‐NC) in the resilient participants compared to those with dementia and similar ADNC as determined by current NIA‐AA recommendations using traditional semi‐quantitative assessments of amyloid β and pathological tau burden. To better understand differences between AD‐dementia and resilient participants, we developed and applied a deep learning approach to analyze the neuropathology of 14 brain donors from the Adult Changes in Thought study, including seven stringently defined resilient participants and seven age‐matched AD‐dementia controls. We created two novel, fully automated deep learning algorithms to quantify the level of phosphorylated TDP‐43 (pTDP‐43) and pTau in whole slide imaging. The models performed better than traditional techniques for quantifying pTDP‐43 and pTau. The second model was able to segment lesions staining for pTau into neurofibrillary tangles (NFTs) and tau neurites (neuronal processes positive for pTau). Both groups had similar quantities of pTau localizing to neurites, but the pTau burden associated with NFTs in the resilient group was significantly lower compared to the group with dementia. These results validate use of deep learning approaches to quantify clinically relevant microscopic characteristics from neuropathology workups. These results also suggest that the burden of NFTs is more strongly associated with cognitive impairment than the more diffuse neuritic tau commonly seen with tangle pathology and suggest that additional factors may underlie resilience mechanisms defined by traditional means.
Keywords: Adult Changes in Thought (ACT), Alzheimer's disease, deep learning, neuropathology, phosphorylated tau, resilience, resistance, TDP‐43
To better understand the neuropathology of individuals with Alzheimer's disease (AD) dementia and "resilient" individuals who have AD pathology but are cognitively normal, we developed deep learning algorithms to quantify the level of phosphorylated TDP‐43 and pTau in whole slide imaging. The models performed better than traditional techniques for quantifying pTDP‐43 and pTau, and the pTau model was able to segment pTau lesions into neurofibrillary tangles (NFTs) and tau neurites (neuronal processes positive for pTau). While both groups had similar quantities of pTau localizing to neurites, the resilient group had significantly less pTau burden associated with NFTs compared to the group with dementia.
1. INTRODUCTION
Alzheimer's disease (AD) is a complex disorder defined by characteristic clinical manifestations and specific neuropathologic changes. It is the most common cause of dementia, affecting over 44 million people worldwide. Despite the increasing impact of AD on society, effective disease‐modifying treatment or prevention strategies still do not exist. Nevertheless, our understanding of the neuropathological changes associated with AD has expanded over time. Current National Institute on Aging and Alzheimer's Association (NIA‐AA) guidelines for the assessment of AD neuropathologic change (ADNC) combine amyloid β (Aβ) plaque distribution (Thal phase), neurofibrillary tangle (NFT) distribution (Braak stage), and neuritic plaque density (Consortium to Establish a Registry for Alzheimer's Disease [CERAD] score) to generate an overall ADNC assessment and interpretation (1). Further, the current NIA‐AA standards for assessment of neurodegenerative disease include evaluating for other, often comorbid pathologies associated with neuronal loss and cognitive decline including Lewy body disease (LBD), vascular brain injury (VBI) including both microvascular lesions and large and small vessel infarcts, TDP‐43 pathology, and hippocampal sclerosis (HS), highlighting the complexity of the neuropathology of AD and related dementias and the need for better understanding of how neuropathology findings influence the clinical phenotype (1).
Of special interest is the distinction between onset and progression of neurodegenerative disease and associated cognitive impairment; alternatively stated, the factors that influence differences between onset of pathological changes in the tissue and functional impairment. Perhaps the most important research cohort in this area is the subset of people, referred to as “cognitively resilient,” who have sufficient ADNC burden to expect associated dementia, but lack the clinical manifestations of dementia during their lifetime (2). Resilience to ADNC is an important area of interest in AD research, and understanding this phenomenon may help to uncover potentially modifiable risk factors or targetable pathophysiological pathways. Research in these populations is beginning to uncover clues. Studies have shown a clear association between the presence of NFTs and cognitive decline, while the association between neuritic plaques and cognition is less well understood (3). Studies in resilient populations have found that although increased neuritic plaque (NP) density is a common finding in this group, high levels (Braak stage V or VI) of NFTs are a much less frequent occurrence in people with cognitive resilience (2, 4).
The Adult Changes in Thought (ACT) study is a prospective, population‐based observation cohort of participants ≥65 years who enroll with normal cognitive status and are followed until the development of AD and related dementia (5). The longitudinal nature of this study and the substantial proportion of participants who consent to autopsy have enabled investigators to link extensive postmortem neuropathological findings to well‐characterized cognitive assessments. Using these data, our group has previously reported quantitatively lower neocortical levels of phosphorylated Tau (pTau) and less limbic‐predominant age‐related TDP‐43 encephalopathy neuropathologic change (LATE‐NC) in the resilient cohort, stringently defined to limit confounders, compared to ACT participants with dementia and similar levels of ADNC (6). This current approach is limited to the assessment of distribution, but not density, of neurofibrillary tangles and pathological TDP‐43 deposits; thus rigorous quantitative methods may provide additional insights to further scientific understanding of the neuropathology findings contributing to resilience and dementia.
One promising new research tool to aid in deepening scientific understanding of neuropathology and dementia is deep learning, a type of machine learning in which artificial neural networks are created to analyze complex data. Deep learning has been transformative in the field of medical imaging, and in many cases, deep learning approaches have been able to extract previously unrecognized features in imaging data that are associated with clinical disease (7, 8). These approaches are becoming more common in AD research with the increase in available multimodal neuroimaging data to classify AD and predict progression from mild cognitive impairment (MCI) to AD (9). In neuropathology, deep learning has been recently used to classify and quantify tau pathology (10) as well as Aβ plaques and cerebral Aβ angiopathy (11, 12).
To further clarify the relationship between pTau and TDP‐43, AD, and AD‐resilience, we trained deep learning models to segment and quantify pTau and TDP‐43 pathology. We report results of the performance of these models when applied to analyze the neuropathology of AD‐resilient ACT participants and age‐matched AD‐dementia controls, and compare these approaches to traditional quantification methods.
2. METHODS
2.1. Study population
Data came from the ACT study participants who had been prospectively evaluated, and who died between 1996 and 2016 and donated their brains for research to the University of Washington (UW) BioRepository and Integrated Neuropathology (BRaIN) laboratory (Seattle WA). ACT is an ongoing, longitudinal, population‐based cohort study that enrolls participants aged ≥65 and free of dementia from Kaiser Permanente Washington (KPW) (5, 13). Participants were examined biennially either at home or clinic with a standard protocol, including administration of the Cognitive Abilities Screening Instrument (CASI) (14). Participants who fell below a threshold cognitive score at subsequent visits, or for whom caregivers or clinicians were concerned for cognitive decline, progressed to evaluation with a comprehensive neuropsychological battery and a clinical examination along with medical records and imaging reviews. All of these data were reviewed at a consensus conference to diagnose and categorize incident dementia. Dementia diagnoses were determined at consensus conferences using the Diagnostic and Statistical Manual of Mental Disorders, 4th Edition (DSM‐IV) criteria (15), and probable and possible AD diagnoses were determined using the National Institute of Neurological and Communicative Disorders and Stroke‐Alzheimer's Disease and Related Disorders Association (NINCDS‐ADRDA) criteria (16). If, at consensus, the participant was felt not to have dementia, they reentered the cohort for regular study visits, while those with a dementia diagnosis were followed by telephone. The cohort is maintained at approximately 2000 participants and approximately 30% consent for autopsy, permitting important interpretation of factors that contribute to decisions for brain donation through inverse probability weight processes (17, 18). This study was approved by the KPW and University of Washington (UW) institutional review boards.
2.2. Neuropathologic features
Brain autopsy is performed on ACT participants with appropriate consent. At least 22 brain regions are routinely sampled after appropriate fixation. Brain tissue is processed, and histologic sections are prepared with appropriate histochemical and immunohistochemical stains meeting or exceeding NIA‐AA guidelines (19). The brain and histologic sections are evaluated by a board‐certified neuropathologist who assesses diverse ADRD‐related neuropathologic features in every case, including neurofibrillary tangle distribution measured by Braak stage (20), NP density quantified by the CERAD level (21), Lewy body disease distribution (21, 22), TDP‐43 pathology distribution (LATE stage) (23), hippocampal sclerosis (presence or absence), and cortical and subcortical (deep cerebral) microinfarcts evaluated as described in the Honolulu Asia Aging Study (HAAS) (24). Detailed methods have been previously described (25, 26). Briefly, from each case a 5‐μm thick section was cut from a formalin‐fixed, paraffin‐embedded tissue block of middle frontal cortex and immunostained for paired helical filament tau (PHF‐tau; clone AT8, 1:1000 dilution, MN1020, Thermo Fisher Scientific, Waltham, MA) and a 5‐μm thick section was cut from a formalin‐fixed, paraffin‐embedded tissue block of amygdala and immunostained for phosphorylated TDP‐43 (pTDP‐43; clone 1D3, 1:1000 dilution, MABN14, Millipore). For all slides, immunohistochemistry was performed using previously optimized protocols and a Leica BOND‐MAX Fully Automated IHC and ISH staining system (Leica Biosystems, Buffalo Grove, IL). Positive controls were performed and all stains were reviewed by a board‐certified neuropathologist blinded to dementia diagnosis and original ADNC classification.
2.3. Cognitive resilience versus dementia population
In an evaluation of 684 brains from the ACT autopsy cohort, seven resilient study participants were identified using stringent criteria including assessment as cognitively normal (CASI results available within 2 years of death, and CASI score over the screening threshold for dementia) and the highest categorical scores for ADNC (Braak stage VI, CERAD frequent) (6). As we have previously published, although these participants had extensive NFTs, they had lower neocortical levels of pTau compared to study participants with similar brain pathology and dementia. They also exhibited less LATE‐NC compared to non‐resilient study participants (19% vs. 62%, p = 0.002). Seven age‐ and sex‐matched study participants with dementia were chosen for the comparative analyses. Brain tissue from all 14 participants underwent standard staining processes as described above.
2.4. Digitization of slides, traditional quantification methods
As previously described (6), an Aperio ScanScope AT2 (Leica Biosystems Pathology Imaging, Vista, CA) at 20x (0.5 microns/pixel) was used to scan the sections immunostained for pTau and phosphorylated TDP‐43 (pTDP‐43). Regions of interest (ROI) on each tissue section were highlighted for analysis using Aperio ImageScope software (Leica Biosystems Pathology Imaging, Vista, CA), and quantitative image analysis of the annotated ROIs was performed (Aperio Brightfield Image Analysis Toolbox software [Leica Biosystems Pathology Imaging, Vista, CA]). The calibrated red‐green‐blue (RGB) color vectors for the immunohistochemical stain components were measured and input as parameters into the Color Deconvolution Area Analysis algorithm (pTau+ and pTDP‐43+ stained slides) and Immunohistochemistry (IHC) Nuclear Quantification algorithm (pTDP‐43+ stained slides) (Figure 1).
FIGURE 1.
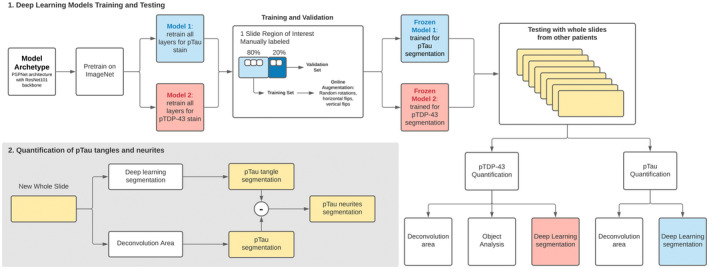
Flow chart of traditional and deep learning methods for quantification of phosphorylated Tau (pTau) and phosphorylated TDP‐43 (pTDP‐43)
2.4.1. pTDP‐43 quantification method
The object analysis method using the IHC Nuclear Quantification algorithm was applied, which finds objects (groups of neighboring pixels) with staining in the positive color channel exceeding an intensity threshold, and filters the found objects using size, shape, and minimum‐positive intensity threshold parameters. The algorithm was calibrated to count the number of pTDP‐43+ inclusions per annotated area. The algorithm was configured to use only the positive DAB chromogen in the segmentation step. Cumulative frequencies were used to calculate the final output metric (objects per mm2) at each possible threshold cut point based on histogram data of the number of objects per intensity unit. Based on the performance of the algorithm in both the positive and negative slides, the positive threshold was selected at the point where the number of objects per mm2 reached a maximum on the positive slides while remained minimum on the negative slides (99th percentile of objects in positive slides and 60th percentile in negative slides). The quantitative analysis data for each ROI included total numbers of pTDP‐43+ objects per mm2.
Next, the color deconvolution area analysis method was applied. The Color Deconvolution Area Analysis algorithm counts the number of pixels that exceed an upper intensity threshold in the DAB stain channel. The algorithm was calibrated to measure the total amount of staining present in the pTDP‐43 ROIs using a similar method as the IHC Nuclear Quantification algorithm. The product of average positive optical density (OD) was multiplied by percent of ROI with positive staining (OD*%Positive). Optical density is a measurement of absorbance and is linearly related to the amount of staining present (27). OD*%Positive is a weighted metric previously used in digitally quantifying immunohistochemical staining (28, 29, 30).
2.4.2. pTau quantification method
For the pTau stained slides, only the color deconvolution area analysis method was performed. The object analysis method used by the IHC Nuclear Quantification algorithm was unable to detect small and faint pTau regions reliably without also counting non‐specific background staining, so instead only a pixel area analysis was performed using the Color Deconvolution Area Analysis algorithm. To quantify pTau, the product of average positive optical density (OD) was multiplied by percent of ROI with positive staining (OD*%Positive).
2.5. Deep learning algorithms
We used deep learning models based on the PSPNet architecture (31) with a ResNet‐101 (32) backbone. We pretrained each model with ImageNet (33) and we retrained all layers for each stain. For each stain (pTau and pTDP‐43), we independently trained separate models using stochastic gradient descent with the Adam optimizer (34) and an initial learning rate of 0.001. (Figure 1) We used 200 epochs with a batch‐size of 25 and froze the weights of the lowest validation to use for the test set. We used a combined pixel‐wise and class binary cross entropy loss. During training, we performed image augmentation with random rotations, horizontal flips, vertical flips, and cropping to create 256 × 256 × 3 input tensors for training and inference. For training and validation, we partitioned the annotations of the regions of interest spatially so that 20% of the annotated area came from a contiguously segregated area of the slide. For training, the image resolutions were continuously sampled at 384 × 384 so that the online augmentations would generate 256 × 256 without missing data at the edges. For validation, the images were sampled at 256 × 256 in a non‐overlapping fashion and no augmentation was applied. After training two deep learning models, we used the frozen models and ran inference on whole slides from different individuals without any manual preprocessing. None of the training data were used for the comparison with the traditional techniques. We used the intersection over union of pTau and pTDP‐43 as a metric to compare traditional quantification techniques and deep learning algorithms. The quantification of neurites for pTau was performed by binary subtraction of the color deconvolution area mask against the deep learning binary mask segmentation.
3. RESULTS
Seven resilient and seven age, sex, year of death, and ADNC‐matched ACT participants with AD dementia were identified using ACT neuropathology and consensus diagnostic criteria and included in the study (35). The mean age at death was 85.2 ± 6.1 years for the resilient study participants and 86.7 ± 3.5 years for the matched controls. There were five female study participants and two male study participants in each group (Table 1).
TABLE 1.
Demographic and baseline clinical characteristics of resilient and demented participants
| Resilient (N = 7) | Dementia (N = 7) | p‐value | |
|---|---|---|---|
| Mean age of death (SD) | 85.2 (6.1) | 86.7 (3.5) | 0.31 |
| Age at final study visit (years) mean (SD) | 83.9 (5.6) | 79.7 (5.5) | 0.05* |
| Female, n (%) | 5 (71.4) | 5 (71.4) | 1.00 |
| Education (years) mean (SD) | 15.9 (2.7) | 15.4 (3.7) | 0.67 |
| CASI to death (years) mean (SD) | 0.9 (0.5) | 7.0 (3.4) | 0.03* |
| APOE ε4, n (%) | 2 (28.6) | 4 (66.7) | 0.50 |
| Charlson Comorbidity Index (cumulative) mean (SD) | 3.4 (2.6) | 1.1 (1.3) | 0.06 |
Patient demographic information obtained from previous research by Latimar et al (35). The Charlson Comorbidity Index is a weighted measure that considers the number of comorbid diseases and their severity (45).
Abbreviations; CASI, cognitive abilities screening instrument; SD, standard deviation.
Statistical significance.
Two separate PSPNet deep learning models (31) were trained to perform segmentation on pTau and pTDP‐43‐stained regions of interest from a single slide each. For TDP, 12 840 tiles and 7245 tiles were continuously sampled for training and validation, respectively. For Tau, 2653 tiles and 1472 tiles were continuously sampled for training and validation, respectively. The training curves are shown in Figures S1 and S2, with the lowest validation points marking the point in training that was frozen and carried forward for the quantification of the slides from the other patients.
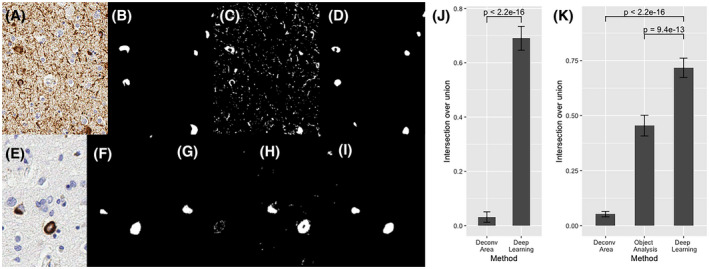
For pTau tangle detection, the object analysis method used by the IHC Nuclear Quantification algorithm failed to identify tangles without decreased specificity. The small size and irregular shapes made the tangles difficult to positively identify among other brown‐staining regions with the IHC Nuclear Algorithm's object segmentation parameters. We performed area‐based stain analysis. Compared to the results from the color deconvolution area analysis method, which is the traditional staining quantification technique, deep learning was superior in identifying pTau tangles based on intersection over union by 66% (0.03% vs. 0.69%; p‐value <2.2 × 10⁻¹⁶) (Figure 2J). Deep learning was superior to either of the traditional quantification methods in detecting pTDP‐43. Compared to both color deconvolution area analysis and object analysis methods, deep learning algorithms were better at detecting pTDP‐43 by 66% and 26%, respectively, using intersection over union as our metric (p‐values <2.2 × 10⁻¹⁶, 9.4 × 10⁻¹³) (Figure 2K).
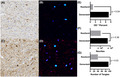
FIGURE 2.
Deep learning (DL) quantification of phosphorylated Tau (pTau) tangles (A) and phosphorylated TDP‐43 (pTDP‐43) inclusions (E). Expert pathologist segmented pTau tangles (B) and pTDP‐43(F). Color deconvolution area analysis, a traditional stain quantification technique, was applied (C) and compared to the DL semantic segmentation (D) of pTau tangles. Color deconvolution area analysis (G), Immunohistochemistry Nuclear Quantification object analysis method (H), and DL methods (I) were utilized for quantification of pTDP‐43. DL approaches were statistically significantly superior to traditional approaches in detecting both pTau (J) and TDP‐43 (K)
The analysis of seven matched pairs of demented and resilient participants using the OD × %positive approach showed that the matched participants with AD dementia had a higher level of pTau than the resilient group (7.10 vs. 0.99; p = 0.04); however this method, unlike deep learning, was unable to differentiate between neuritic and neurofibrillary tangle pathology. No significant difference was found in the number of pTau neurites identified by the deep learning algorithm between the two groups (34 383 in demented vs. 20 540 in resilient group; p‐value 0.38) while the number of tangles was significantly higher in participants with AD dementia compared with resilient participants (93.29 vs. 39.14; p = 0.03) (Figure 3).
FIGURE 3.
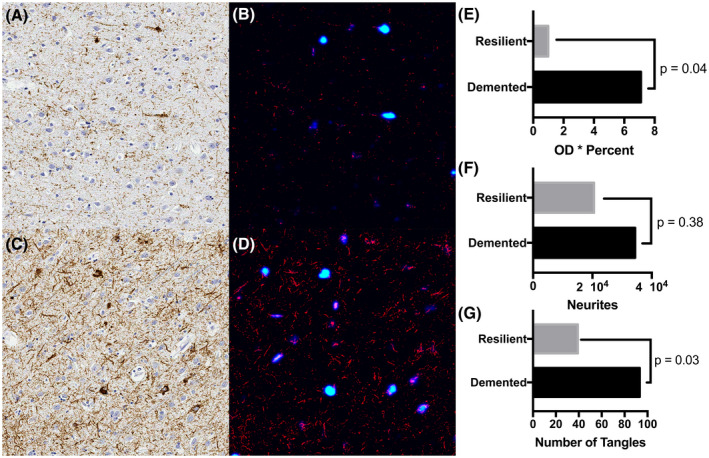
Deep learning (DL) semantic segmentation results of phosphorylated Tau (pTau) stained resilient (A) and demented (C) cases. DL annotation of pTau staining is shown in panels B and D for the resilient and demented cases, respectively. pTau tangles are identified in blue with dark blue representing areas of low confidence and light blue representing tangles of high confidence, and neurites are shown in red. Fourteen cases, seven matched pairs of demented and resilient cases, were quantified using a traditional approach, optical density * percent staining method (E). Deep learning annotated neurites (F) and tangles (G) show that the number of pTau tangles are statistically significantly lower in the resilient compared to the demented cases
4. DISCUSSION
In this study, we present two novel, fully automated, deep learning algorithms to quantify the level of pTau and pTDP‐43 in whole slide imaging. Using this approach, we were able to partition the effect of pTau into neurites (neurons containing diffuse neuritic pTau) versus neurofibrillary tangles (aggregates of pTau). We found that the resilient and dementia groups had similar quantities of pTau localizing to neurites, but the pTau burden of the resilient group was significantly lower in NFTs compared to the group with dementia.
Previous studies have applied machine‐learning techniques to classify and segment the characteristic lesions associated with AD. A recent study trained a convolutional neural network to identify Aβ pathology on digitized immunohistochemically stained slides from the temporal gyrus region of 43 normal and diseased brains. The network was able to distinguish three types of Aβ pathology (cored plaques, diffuse plaques, and cerebral amyloid angiopathy) with high area under the receiver operating characteristics (AUROC) of 0.993 and fair precision recall curve (0.743). In addition, the total Aβ burden on whole slide images (WSIs) was quantified and compared to the manual CERAD‐like scoring system and showed varying correlation by amyloid pathology types (11). Another study used histopathology slides from 22 brains of study participants with tau‐related neurodegenerative diseases (AD, primary age‐related tauopathy, progressive supranuclear palsy, and chronic traumatic encephalopathy) to train a machine‐learning algorithm to quantify NFTs and qualitatively assess the types of NFTs on WSIs (10). The sensitivity and positive predictive value of the algorithm output ranged from 0.72 to 0.92 but, unlike this study, qualitative results were not provided. Both of these studies differed from our approach in that the training slides were first divided into smaller patches containing the region of interest centrally followed by experts’ annotations, which could have artificially inflated estimates of the performance of the model. In contrast, we first annotated the WSIs, and the slides were then divided randomly. These steps likely increase the model's generalizability and performance in a routine diagnostic setting without the need for any preprocessing of the images.
NFTs are one of the hallmarks of AD (along with Aβ plaques); pTau is a key component of NFT and thus in the pathophysiology of AD (36). Although both pTau and Aβ pathology are necessary for the development of AD dementia, pTau is more closely associated with neurodegeneration and cognitive decline than Aβ (37). Phosphorylated TDP‐43 is a prominent component of the aggregates seen in most forms of amyotrophic lateral sclerosis (ALS) and approximately half of frontotemporal lobar degeneration (FTLD) cases; but pTDP‐43 has also been seen in Huntington's disease, chronic traumatic encephalopathy (CTE), and is associated with more rapid cognitive decline in people with AD (38). Neither pTau nor pTDP‐43 proteinopathy is specific to AD, yet both are associated with cognitive decline. The term “pathologic synergy” has been used to describe how misfolding proteins can trigger related protein accumulation and accelerate damage to the surrounding tissue (39). The absence of pTDP‐43 seems to be a notable feature of the brains of AD resilient participants and may be a key to understanding their unique clinical presentation.
While pTau and pTDP‐43 are clearly important factors in AD and related dementias, we currently lack a standard method of quantifying their tissue involvement beyond categorical or semi‐quantitative measures. In assessing the severity of NFT, the widely accepted Braak score only allows six categories to define the extent of NFT distribution, without a continuous linear quantification of the disease burden, although novel methods such as Histelide have shown promise for the quantification of pTau in formalin‐fixed tissue sections (40). Assessing the severity of pTDP‐43 lesions can also be challenging due to general low levels of tissue burden even in advanced cases. Reliable detection of these low levels of tissue burden requires sensitive approaches for quantitation. As we have shown, traditional quantification methods were significantly inferior to deep learning algorithms in identifying and quantifying pTDP‐43 lesions. The importance of pTDP‐43 lesions in dementia and resilient populations is becoming more recognized (6, 23, 41) and deep learning approaches similar to ours may be required for quantification to help us better understand the role of TDP‐43 in aging and cognitive decline.
The deep learning model described here was able to subclassify and quantitate pTau burden into neurites and tangles, demonstrating significantly less NFTs tangles, but not pTau neurites, in a small cohort of resilient participants compared to those with AD‐dementia. pTau neurites indicate the presence of neurons containing diffuse pTau within their processes. pTau neurites are often located around amyloid plaques, as the initial microtubule disruption is thought to be Aβ‐induced and followed by misfolding and aggregation of hyperphosphorylated tau (42). Modeling suggests the misfolded pTau no longer provides necessary structural support to axonal microtubules and eventually aggregates into pretangle lesions and NFTs in the soma of the neuron (43). Although we found that resilient individuals show similar amounts of diffuse intracellular pTau (neurites) as patients with dementia, our results suggest that pTau pathology in the resilient population does not appear to manifest as NFTs to the same degree. The role of TDP‐43 in this process adds an additional layer of complexity; TDP‐43 pathology is strongly associated with dementia, but the relationship between pTau and TDP‐43 in the pathogenesis and clinical manifestations of AD, including causal relationships and direct versus indirect interactions is not clearly elucidated. A simple possibility is that TDP‐43 pathology influences the formation of NFTs, or vice versa, in AD.
Sonnen et al. reported that, although 47% of cognitively normal (CN) individuals in their clinicopathologic correlation study of non‐demented elderly brain donors had CERAD moderate or frequent neuritic plaque scores, only 6% of the CN participants had severe (stage V or VI) Braak stage, supporting the finding from multiple studies that NFT pathology, rather than NPs, is the primary predictor of cognitive impairment (2). The Honolulu‐Asia Aging Study (HAAS) cohort study reported that participants who only had neocortical NP lesions did not have higher Braak stage or worse cognitive function than the group with neither NPs nor NFTs. Those with both pathologies showed a higher frequency of dementia, suggesting that the combination of NPs and NFTs may be the major contributor to cognitive dysfunction (44). Another study of the ACT population reported several factors associated with resilience such as college education, higher brain weight, and fewer neuropathologic findings—specifically microinfarcts, the absence of Braak stages V and VI, and hippocampal sclerosis. After adjusting for these factors, the amount of NPs was not predictive of cognitive resilience. However, this study's definition of resilience was less strict than what we used in our study, and subjects with intermediate AD pathology defined as Braak stages III–V and CERAD scores of moderate were included in the resilient group in that previous report (4).
Our study is consistent with the prior literature which has shown that in AD, NFTs correlate best with cognitive decline. This suggests that while there may be significant phosphorylation of tau occurring in the brain as an early change in AD, prior to the onset of cognitive decline, it is the progression of the phosphorylated tau to tangles that is associated inversely with resilience. It should be kept in mind, however, that these are only associative studies and alternative hypotheses exist, including that fewer NFTs are identified due to a greater loss of neurons. There are still many unanswered questions with respect to the relationship between neuritic and NFT tau, tau progression, and potential regression, and the influence of TDP‐43 and Aβ on pTau formation and progression within cells and their processes. However, these results demonstrate that machine‐learning approaches have the potential to better quantify and differentiate pathology across regions of the brain, and between individuals, to more accurately characterize pathological burden and AD stage than traditional methods.
Several limitations exist in our study. Our study had a small sample size and the training data originated from the ACT autopsy cohort. All of our histopathology evaluations used the same staining protocols but they were stained in different batches at varying times using standard negative and positive controls, supporting the generalizability of our algorithm to other archival and prospective cohort studies. In addition, all the slides were scanned using the same platform. A previous study showed that the level of staining background may interfere with the performance of deep learning models (10); therefore additional research studies with larger datasets and different staining protocols for pTau are needed to improve our model generalizability. In addition, although we did not compare the deep learning tau quantification results to grading by expert neuropathologists, we aimed to demonstrate that the deep learning approach could be used to quantify AD neuropathologic lesions that have previously required human expert grading and are difficult to quantify. Finally, deep learning models are known to be sensitive to subtle artifacts that human experts are not. A qualitative assessment of the deep learning segmentations did not show sensitivity to local tissue distortions on the slide (Figure S3).
In summary, we successfully trained deep learning models to quantify pTau and pTDP‐43 burden in the brain in a case control cohort focused on cognitive resilience to ADNC. We report that NFTs, but not pTau neurites, differentiate resilient from AD‐dementia research participants, highlighting potential differences in AD pathologic progression and accentuating the potential utility of whole slide image analysis and deep learning to more accurately classify disease progression in tissue‐based studies. Finally, this study adds evidence supporting the value of deep learning approaches for discovery of novel pathological patterns, and hence insights into pathogenesis, in AD and related dementias.
CONFLICT OF INTEREST
Dr. A. Lee reports support from the US Food and Drug Administration, grants from Santen, Carl Zeiss Meditec, and Novartis, personal fees from Genentech, Topcon, and Verana Health, outside of the submitted work; this article does not reflect the opinions of the Food and Drug Administration. Dr. Larson receives royalty funds from UpToDate. No conflicting relationship exists for the rest of the authors.
AUTHOR CONTRIBUTIONS
Cecilia S. Lee, and Aaron Y. Lee had full access to all the data in the study and take responsibility for the integrity of the data and the accuracy of the data analysis. Jonathan C. Henriksen, Caitlin S. Latimer, and C. Dirk Keene acquired the data, and all authors contributed to data analysis and interpretation. Cecilia S. Lee, Caitlin S. Latimer, and Marian Blazes drafted the manuscript and all authors reviewed and revised the manuscript.
Supporting information
Supplementary Material
FIGURE S1 Training curves of deep learning algorithms to detect phosphorylated Tau (pTau) lesions. x‐axis, number of epochs used in training; y‐axis, training and validation loss. Training was stopped at the lowest validation point and carried forward for the quantification of the slides
FIGURE S2 Training curves of deep learning algorithms to detect phosphorylated TDP‐43 (pTDP‐43) lesions. x‐axis, number of epochs used in training; y‐axis, training and validation loss
FIGURE S3 Qualitative assessment of artifacts. A low magnification view of an area with a vertical shear tissue distortion is shown on the left with the corresponding deep learning segmentation on the right
Funding information
This research has been funded by National Institutes of Health Grants K23EY029246, K08AG065426, R01AG060942, U01AG006781, P50AG05136, P30AG066509, the Nancy and Buster Alvord endowment, and by an unrestricted grant from Research to Prevent Blindness. The sponsors or funding organizations had no role in the design or conduct of this research
DATA AVAILABILITY STATEMENT
The data that support the findings of this study are available on request from the corresponding author. The data are not publicly available due to privacy or ethical restrictions.
REFERENCES
- 1. Montine TJ, Phelps CH, Beach TG, Bigio EH, Cairns NJ, Dickson DW, et al. National Institute on Aging‐Alzheimer’s Association guidelines for the neuropathologic assessment of Alzheimer's disease: a practical approach. Acta Neuropathol. 2012;123(1):1–11. [DOI] [PMC free article] [PubMed] [Google Scholar]
- 2. Sonnen JA, Santa Cruz K, Hemmy LS, Woltjer R, Leverenz JB, Montine KS, et al. Ecology of the aging human brain. Arch Neurol. 2011;68(8):1049–56. [DOI] [PMC free article] [PubMed] [Google Scholar]
- 3. Nelson PT, Alafuzoff I, Bigio EH, Bouras C, Braak H, Cairns NJ, et al. Correlation of Alzheimer disease neuropathologic changes with cognitive status: a review of the literature. J Neuropathol Exp Neurol. 2012;71(5):362–81. [DOI] [PMC free article] [PubMed] [Google Scholar]
- 4. Aiello Bowles EJ, Crane PK, Walker RL, Chubak J, LaCroix AZ, Anderson ML, et al. Cognitive resilience to Alzheimer’s disease pathology in the human brain. J Alzheimers Dis. 2019;68(3):1071–83. [DOI] [PMC free article] [PubMed] [Google Scholar]
- 5. Larson EB, Wang L, Bowen JD, McCormick WC, Teri L, Crane P, et al. Exercise is associated with reduced risk for incident dementia among persons 65 years of age and older. Ann Intern Med. 2006;144(2):73–81. [DOI] [PubMed] [Google Scholar]
- 6. Latimer CS, Burke BT, Liachko NF, Currey HN, Kilgore MD, Gibbons LE, et al. Resistance and resilience to Alzheimer’s disease pathology are associated with reduced cortical pTau and absence of limbic‐predominant age‐related TDP‐43 encephalopathy in a community‐based cohort. Acta Neuropathol Commun. 2019;7(1):91. [DOI] [PMC free article] [PubMed] [Google Scholar]
- 7. Lee CS, Tyring AJ, Wu Y, Xiao S, Rokem AS, DeRuyter NP, et al. Generating retinal flow maps from structural optical coherence tomography with artificial intelligence. Sci Rep. 2019;9(1):5694. [DOI] [PMC free article] [PubMed] [Google Scholar]
- 8. Kihara Y, Heeren TFC, Lee CS, Wu Y, Xiao S, Tzaridis S, et al. Estimating retinal sensitivity using optical coherence tomography with deep‐learning algorithms in macular telangiectasia type 2. JAMA Netw Open. 2019;2(2):e188029. [DOI] [PMC free article] [PubMed] [Google Scholar]
- 9. Jo T, Nho K, Saykin AJ. Deep learning in Alzheimer’s disease: diagnostic classification and prognostic prediction using neuroimaging data. Front Aging Neurosci. 2019;20(11):220. [DOI] [PMC free article] [PubMed] [Google Scholar]
- 10. Signaevsky M, Prastawa M, Farrell K, Tabish N, Baldwin E, Han N, et al. Artificial intelligence in neuropathology: deep learning‐based assessment of tauopathy. Lab Invest. 2019;99(7):1019–29. [DOI] [PMC free article] [PubMed] [Google Scholar]
- 11. Tang Z, Chuang KV, DeCarli C, Jin L‐W, Beckett L, Keiser MJ, et al. Interpretable classification of Alzheimer’s disease pathologies with a convolutional neural network pipeline. Nat Commun. 2019;10(1):2173. [DOI] [PMC free article] [PubMed] [Google Scholar]
- 12. Vizcarra JC, Gearing M, Keiser MJ, Glass JD, Dugger BN, Gutman DA. Validation of machine learning models to detect amyloid pathologies across institutions. Acta Neuropathol Commun. 2020;8(1):59. [DOI] [PMC free article] [PubMed] [Google Scholar]
- 13. Kukull WA, Higdon R, Bowen JD, McCormick WC, Teri L, Schellenberg GD, et al. Dementia and Alzheimer disease incidence. Arch Neurol. 2002;59(11):1737. [DOI] [PubMed] [Google Scholar]
- 14. Teng EL, Hasegawa K, Homma A, Imai Y, Larson E, Graves A, et al. The Cognitive Abilities Screening Instrument (CASI): a practical test for cross‐cultural epidemiological studies of dementia. Int Psychogeriatr. 1994;6(1):45–58; discussion 62. [DOI] [PubMed] [Google Scholar]
- 15. American Psychiatric Association , Task Force on DSM‐IV . Diagnostic and statistical manual of mental disorders: DSM‐IV. 1994. [Google Scholar]
- 16. McKhann G, Drachman D, Folstein M, Katzman R, Price D, Stadlan EM. Clinical diagnosis of Alzheimer’s disease: report of the NINCDS‐ADRDA Work Group* under the auspices of Department of Health and Human Services Task Force on Alzheimer's Disease. Neurology. 1984;34(7):939. [DOI] [PubMed] [Google Scholar]
- 17. Sonnen JA, Larson EB, Crane PK, Haneuse S, Li G, Schellenberg GD, et al. Pathological correlates of dementia in a longitudinal, population‐based sample of aging. Ann Neurol. 2007;62(4):406–13. [DOI] [PubMed] [Google Scholar]
- 18. Haneuse S, Schildcrout J, Crane P, Sonnen J, Breitner J, Larson E. Adjustment for selection bias in observational studies with application to the analysis of autopsy data. Neuroepidemiology. 2009;32(3):229–39. [DOI] [PMC free article] [PubMed] [Google Scholar]
- 19. Sonnen JA, Larson EB, Haneuse S, Woltjer R, Li G, Crane PK, et al. Neuropathology in the adult changes in thought study: a review. J Alzheimers Dis. 2009;18(3):703–11. [DOI] [PMC free article] [PubMed] [Google Scholar]
- 20. Braak H, Alafuzoff I, Arzberger T, Kretzschmar H, Del Tredici K. Staging of Alzheimer disease‐associated neurofibrillary pathology using paraffin sections and immunocytochemistry. Acta Neuropathol. 2006;112(4):389–404. [DOI] [PMC free article] [PubMed] [Google Scholar]
- 21. Mirra SS, Heyman A, McKeel D, Sumi SM, Crain BJ, Brownlee LM, et al. The Consortium to Establish a Registry for Alzheimer’s Disease (CERAD). Part II. Standardization of the neuropathologic assessment of Alzheimer's disease. Neurology. 1991;41(4):479–86. [DOI] [PubMed] [Google Scholar]
- 22. McKeith IG, Dickson DW, Lowe J, Emre M, O’Brien JT, Feldman H, et al. Diagnosis and management of dementia with Lewy bodies: third report of the DLB Consortium. Neurology. 2005;65(12):1863–72. [DOI] [PubMed] [Google Scholar]
- 23. Nelson PT, Dickson DW, Trojanowski JQ, Jack CR, Boyle PA, Arfanakis K, et al. Limbic‐predominant age‐related TDP‐43 encephalopathy (LATE): consensus working group report. Brain. 2019;142(6):1503–27. [DOI] [PMC free article] [PubMed] [Google Scholar]
- 24. White L, Petrovitch H, Hardman J, Nelson J, Davis DG, Ross GW, et al. Cerebrovascular pathology and dementia in autopsied Honolulu‐Asia Aging Study participants. Ann N Y Acad Sci. 2002;977:9–23. [DOI] [PubMed] [Google Scholar]
- 25. Sonnen JA, Larson EB, Crane PK, Haneuse S, Li G, Schellenberg GD, et al. Pathological correlates of dementia in a longitudinal, population‐based sample of aging. Ann Neurol. 2007;62(4):406–13. [DOI] [PubMed] [Google Scholar]
- 26. Sonnen JA, Larson EB, Walker RL, Haneuse S, Crane PK, Gray SL, et al. Nonsteroidal anti‐inflammatory drugs are associated with increased neuritic plaques. Neurology. 2010;75(13):1203–10. 10.1212/wnl.0b013e3181f52db1 [DOI] [PMC free article] [PubMed] [Google Scholar]
- 27. Krajewska M, Smith LH, Rong J, Huang X, Hyer ML, Zeps N, et al. Image analysis algorithms for immunohistochemical assessment of cell death events and fibrosis in tissue sections. J Histochem Cytochem. 2009;57(7):649–63. 10.1369/jhc.2009.952812 [DOI] [PMC free article] [PubMed] [Google Scholar]
- 28. Borgatti A, Koopmeiners JS, Sarver AL, Winter AL, Stuebner K, Todhunter D, et al. Safe and effective sarcoma therapy through bispecific targeting of EGFR and uPAR. Mol Cancer Ther. 2017;16(5):956–65. [DOI] [PMC free article] [PubMed] [Google Scholar]
- 29. Rizzardi AE, Johnson AT, Vogel RI, Pambuccian SE, Henriksen J, Skubitz AP, et al. Quantitative comparison of immunohistochemical staining measured by digital image analysis versus pathologist visual scoring. Diagn Pathol. 2012;20(7):42. [DOI] [PMC free article] [PubMed] [Google Scholar]
- 30. Rizzardi AE, Zhang X, Vogel RI, Kolb S, Geybels MS, Leung Y‐K, et al. Quantitative comparison and reproducibility of pathologist scoring and digital image analysis of estrogen receptor β2 immunohistochemistry in prostate cancer. Diagn Pathol. 2016;11(1):63. [DOI] [PMC free article] [PubMed] [Google Scholar]
- 31. Zhao H, Shi J, Qi X, Wang X, Jia J. Pyramid scene parsing network. arXiv [cs.CV]. 2016. http://arxiv.org/abs/1612.01105. [Google Scholar]
- 32. He K, Zhang X, Ren S, Sun J. Deep residual learning for image recognition. arXiv [cs.CV]. 2015. http://arxiv.org/abs/1512.03385. [Google Scholar]
- 33. Deng J, Dong W, Socher R, Li L, Li K, Li FF. ImageNet: a large‐scale hierarchical image database. In: 2009 IEEE Conference on Computer Vision and Pattern Recognition. ieeexplore.ieee.org; 2009. p. 248–55.
- 34. Kingma DP, Adam BJ. A method for stochastic optimization. arXiv [cs.LG]. 2014. http://arxiv.org/abs/1412.6980 [Google Scholar]
- 35. Latimer CS, Burke BT, Liachko NF, Currey HN, Kilgore MD, Gibbons LE, et al. Resistance and resilience to Alzheimer’s disease pathology are associated with reduced cortical pTau and absence of limbic‐predominant age‐related TDP‐43 encephalopathy in a community‐based cohort. Acta neuropathologica communications. 2019;7(1):9. [DOI] [PMC free article] [PubMed] [Google Scholar]
- 36. DeTure MA, Dickson DW. The neuropathological diagnosis of Alzheimer’s disease. Mol Neurodegener. 2019;14(1):32. [DOI] [PMC free article] [PubMed] [Google Scholar]
- 37. van der Kant R, van der Kant R, Goldstein LSB, Ossenkoppele R. Amyloid‐β‐independent regulators of tau pathology in Alzheimer disease. Nat Rev Neurosci. 2020;21(1):21–35. 10.1038/s41583-019-0240-3 [DOI] [PubMed] [Google Scholar]
- 38. James BD, Wilson RS, Boyle PA, Trojanowski JQ, Bennett DA, Schneider JA. TDP‐43 stage, mixed pathologies, and clinical Alzheimer’s‐type dementia. Brain. 2016;139(11):2983–93. 10.1093/brain/aww224 [DOI] [PMC free article] [PubMed] [Google Scholar]
- 39. Chornenkyy Y, Fardo DW, Nelson PT. Tau and TDP‐43 proteinopathies: kindred pathologic cascades and genetic pleiotropy. Lab Invest. 2019;99(7):993–1007. [DOI] [PMC free article] [PubMed] [Google Scholar]
- 40. Postupna N, Rose SE, Bird TD, Gonzalez‐Cuyar LF, Sonnen JA, Larson EB, et al. Novel antibody capture assay for paraffin‐embedded tissue detects wide‐ranging amyloid beta and paired helical filament‐tau accumulation in cognitively normal older adults. Brain Pathol. 2012;22(4):472–84. [DOI] [PMC free article] [PubMed] [Google Scholar]
- 41. Zhang L, Chen Y, Liu M, Wang Y, Peng G. TDP‐43 and limbic‐predominant age‐related TDP‐43 encephalopathy. Front Aging Neurosci. 2019;11:376. [DOI] [PMC free article] [PubMed] [Google Scholar]
- 42. Sadleir KR, Kandalepas PC, Buggia‐Prévot V, Nicholson DA, Thinakaran G, Vassar R. Presynaptic dystrophic neurites surrounding amyloid plaques are sites of microtubule disruption, BACE1 elevation, and increased Aβ generation in Alzheimer’s disease. Acta Neuropathologica. 2016;132(2):235–56. 10.1007/s00401-016-1558-9 [DOI] [PMC free article] [PubMed] [Google Scholar]
- 43. Serrano‐Pozo A, Frosch MP, Masliah E, Hyman BT. Neuropathological alterations in Alzheimer disease. Cold Spring Harb Perspect Med. 2011;1(1):a006189. [DOI] [PMC free article] [PubMed] [Google Scholar]
- 44. Petrovitch H, Ross GW, He Q, Uyehara‐Lock J, Markesbery W, Davis D, et al. Characterization of Japanese‐American men with a single neocortical AD lesion type. Neurobiol Aging. 2008;29(10):1448–55. [DOI] [PMC free article] [PubMed] [Google Scholar]
- 45. Charlson ME, Pompei P, Ales KL, MacKenzie CR. A new method of classifying prognostic comorbidity in longitudinal studies: development and validation. J Chronic Dis. 1987;40(5):373–83. [DOI] [PubMed] [Google Scholar]
Associated Data
This section collects any data citations, data availability statements, or supplementary materials included in this article.
Supplementary Materials
Supplementary Material
FIGURE S1 Training curves of deep learning algorithms to detect phosphorylated Tau (pTau) lesions. x‐axis, number of epochs used in training; y‐axis, training and validation loss. Training was stopped at the lowest validation point and carried forward for the quantification of the slides
FIGURE S2 Training curves of deep learning algorithms to detect phosphorylated TDP‐43 (pTDP‐43) lesions. x‐axis, number of epochs used in training; y‐axis, training and validation loss
FIGURE S3 Qualitative assessment of artifacts. A low magnification view of an area with a vertical shear tissue distortion is shown on the left with the corresponding deep learning segmentation on the right
Data Availability Statement
The data that support the findings of this study are available on request from the corresponding author. The data are not publicly available due to privacy or ethical restrictions.