

Abstract
Population genomics of bulk malaria infections is unable to examine intrahost evolution, so most work has focused on the role of recombination in generating genetic variation. We used single cell sequencing protocol for low parasitemia infections to generate 406 near complete single Plasmodium vivax genomes from 11 patients sampled during sequential febrile episodes. Parasite genomes contained hundreds of de novo mutations, showing strong signatures of selection, which are enriched in the ApiAP2 family of transcription factors, known targets of adaptation. Comparing 315 P. falciparum single cell genomes from 15 patients with our P. vivax data we find broad complementary patterns of de novo mutation at the gene and pathway level, revealing the importance of within host evolution during malaria infections.
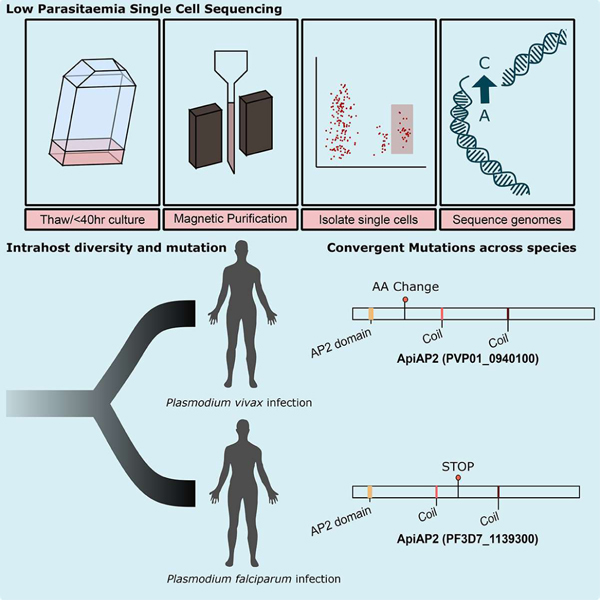
Graphical Abstract
eTOC
Dia et al develop a single cell sequencing protocol to capture the genetic diversity of low parasitaemia malaria infections. Application of this approach to recurrent Plasmodium vivax infection captures intrahost relatedness and signatures of selection. Comparison with published P. falciparum data identifies gene homologues recurrently mutated in both species.
The ability to characterize the mutation burden of individual cells has revealed extensive somatic variation in humans (Martincorena et al., 2018), and identified drivers of cancer evolution and chemotherapeutic resistance (Martincorena et al., 2017; Wang et al., 2014). The development of methods to identify de novo mutations within malaria infections will be critical to understanding the emergence of drug resistance, and escape of vaccine mediated or natural immune responses. The rate and spectrum of de novo mutation (Bopp et al., 2013; Claessens et al., 2014; McDew-White et al., 2019), and its impact on drug resistance (Cowell et al., 2018) has been studied in vitro in the malaria parasite Plasmodium falciparum. However, the lack of sustainable in vitro culture for P. vivax and a lack of tools to characterize mutations arising in vivo in either malaria parasite species strictly limits our understanding of how mutation shapes parasite populations and disease outcome.
P. vivax is a globally distributed malaria parasite causing an estimated 14.3 million cases per year (Battle et al., 2019). Unlike P. falciparum, P. vivax can form dormant liver stages which may reactivate and generate subsequent episodes. This means a recurrent episode of vivax malaria may be caused by either relapse from liver-resident hypnozoites, recrudescence from the blood or a novel infection from a mosquito bite. Analysis of microsatellite markers (Imwong et al., 2007) and genome sequencing (Bright et al., 2014; Popovici et al., 2018) of recurrent vivax infections finds secondary infections are often related to the primary infection, and that genetically diverse infections generally contain related parasites (Auburn et al., 2018; Auburn et al., 2019; Pearson et al., 2016). This supports either relapse or recrudescence, rather than mosquito inoculation, as the dominant cause of secondary infections. The resolution with which bulk analysis is able to resolve relatedness when multiple parasite genotypes are present in the bloodstream is quite limited (Nkhoma et al., 2020), and the identification of de novo mutation is beyond this approach. To understand relatedness, diversity and mutation within recurrent P. vivax infection we developed a single cell genomics approach amenable to low parasitaemia infections, and applied this to recurrent infections.
Development of a low parasitaemia single cell sequencing approach for P. vivax
We have previously applied single cell sequencing (SCS) to P. falciparum malaria infections to quantify relatedness within infections from a high transmission region (Nair et al., 2014; Nkhoma et al., 2020; Trevino et al., 2017), and to track de novo mutations arising in cultured parasite lines (Jett et al., 2020). These approaches required near-complete coverage of single parasite genomes, a technical improvement we achieved by targeting parasites which have undergone multiple rounds of DNA replication within a single cell (Trevino et al., 2017). Infection with P. vivax results in a lower parasitaemia than P. falciparum due to the strong preference of P. vivax for immature, reticulocyte stage red blood cells. To allow for interrogation of low parasitaemia infections we modified our SCS protocol to enrich for late stage parasites by magnetic purification (Ribaut et al., 2008) prior to staining and FACS sorting (Fig. 1A, Supplementary Fig. 1). We call this method low parasitaemia single cell sequencing (LPSCS). Using this approach we generated SCS data from 11 patients with paired samples, each pair representing a sample of a febrile episode occurring between 29 and 342 days apart and designated time point (TP) 1 and TP2. The parasitaemia of infections ranged from 0.2–1.0% (Supplementary Table 1). We targeted 24 individual cells from each of the paired samples, successfully generating sequencing libraries for at least 18/24 (75%) cells from 17/22 (77.2%) samples (Supplementary Table 1). In addition, we sequenced bulk DNA directly after parasites were thawed (Bulk Cultured; BC), and from ~5,000 cells sorted from an inclusive parasite positive gate (Bulk Sorted; BS). For 8/22 time points we were unable to generate sequencing data for either the BC or BS sample, and in one case both. In total we generated sequencing libraries for 441 genomes, 406 of which were from single cells (Supplementary Table 1).
Figure 1. Development of a low parasitaemia single cell sequencing (LPSCS) protocol.
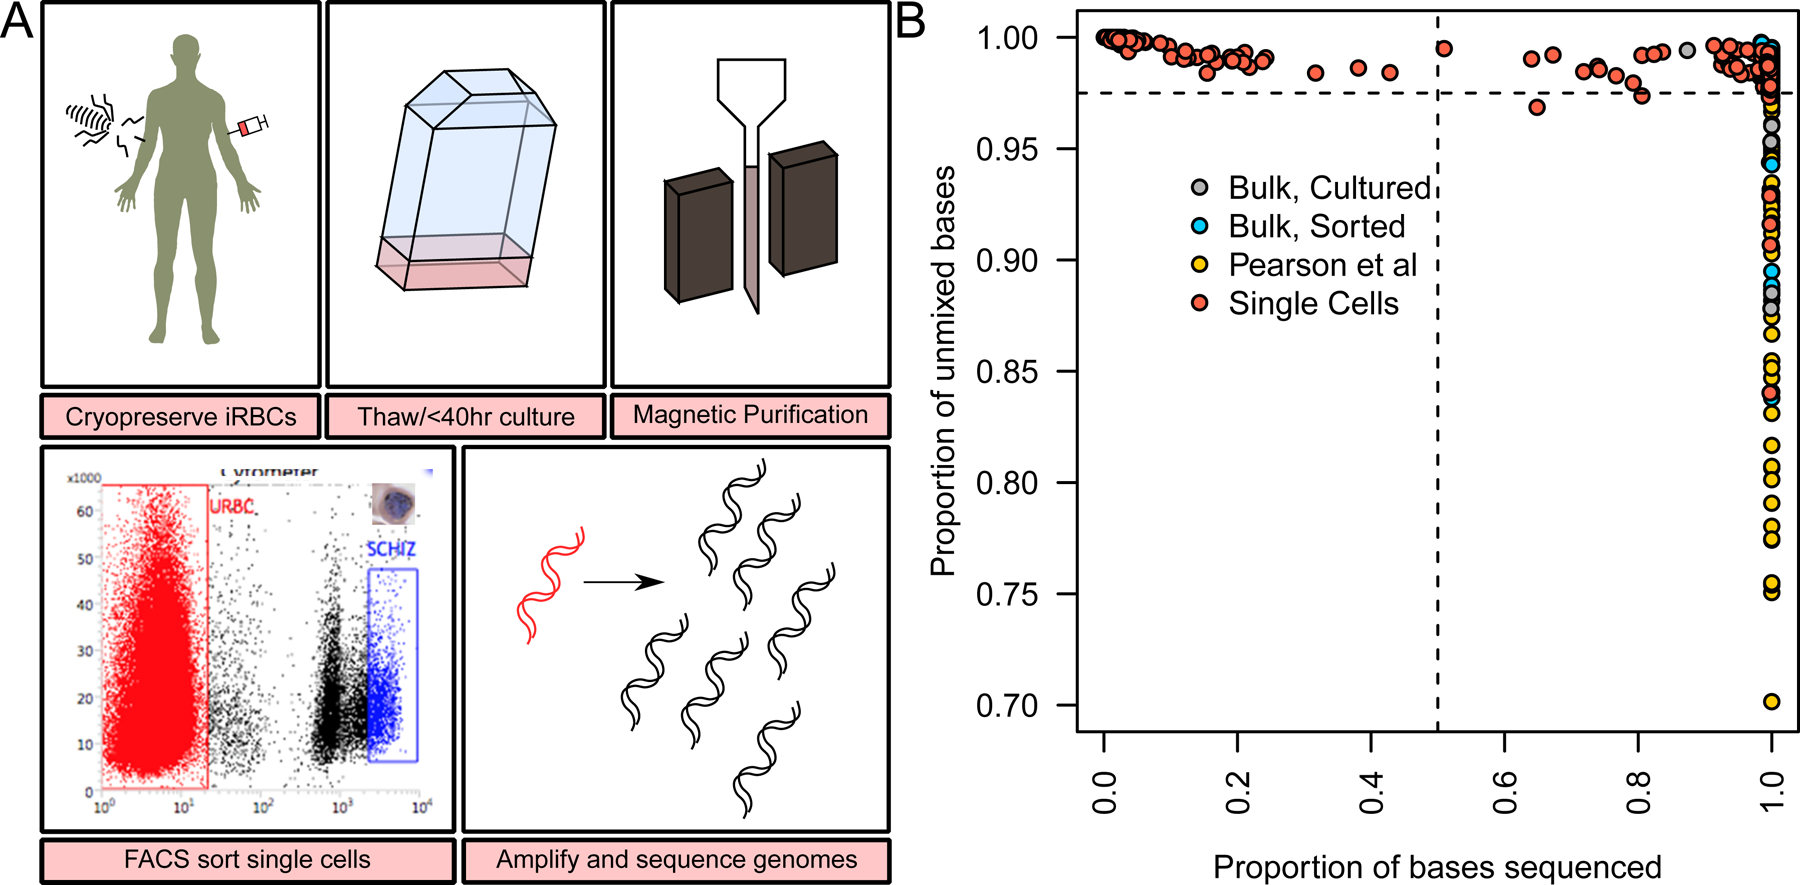
(A) The LPSCS protocol. Cryopreserved parasites are thawed and grown ex vivo for <40 hours, after which late stage parasites are enriched in the culture by magnetic purification. Following magnetic enrichment parasites are stained with a live cell dye and late stage parasites are identified by their high DNA content. Magnetic enrichment does not eliminate all uninfected RBCs (blue box) or early stage parasites, these still contribute to the composition of the sample. Correspondingly late stage parasites are targeted for isolation by gating high DNA content cell (red box). After isolation of single cells WGA is performed under highly sterile conditions, and libraries prepared for genome sequencing. (B) The success rate of single cell DNA amplification. The x-axis shows the coverage obtained for each single cell library, the y-axis shows the purity of each sequence. These show the majority of single cells are both clonal, and high coverage (top right corner), while bulk sequences and samples from a published study (Pearson et al., 2016) show a wider distribution of clonality.
We identified 521,225 variants across our dataset of 441 genome sequences. After filtering for high quality biallelic SNPs present in the core genome (Pearson et al., 2016) with less than 20% missing genotypes we retained 88,076 sites. We integrated this dataset with high quality biallelic SNPs from a population survey of SE Asia which overlaps at 72,435 common, biallelic SNPs (Auburn et al., 2018; Pearson et al., 2016). We have previously validated our single cell sequencing approach has a very low rate of environmental and cross-cell contamination (Nair et al., 2014; Trevino et al., 2017). To test whether magnetic purification introduced detectable differences in the purity of data we examined the genome-wide distribution of unfixed sites (Fig. 1B). Based on this distribution we excluded samples which showed evidence of >1 genotype being present (n=6) or which lacked sequencing data for >50% of the filtered genotypes (n=86). Missing data was biased toward a small number of infections with 4 infection time points accounting for 50% of the missing data, and 70% of samples missing less than 1/3rd of their sequences (Supplementary Table 1).
Infections are predominantly composed of related parasites
We used the proportion of alleles shared between pairs of parasites to estimate the number of independent clones in each infection. Here, parasites which are identical at ≥99% of polymorphic sites are deemed to be identical clones. Within individual TPs we found a mean of 1.2 (range 1–2) clones at TP1 and 1.7 clones at TP2 (range 1–3), and a mean of 2 clones (1–4) when combining TPs from single patients, with 67% of infection TPs being monoclonal to our depth of sequencing. The percentage of monoclonal infections from microsatellite markers at the Thai-Myanmar border is estimated to be 50%, with an average multiplicity of infection of 1.65 (Thanapongpichat et al., 2013). Given the depth of cells we have sequenced in each infection there is a possibility we may classify some mixed clone infections as monoclonal. To test the conditions under which this is likely we simulated a scenario where a minor clone is at 5% frequency and randomly sampled 24 cells. In 75% of 1,000 random samples both genotypes are identified. For a scenario where two genotypes are at equal frequency, both genotypes are captured in every sample of 24 cells.
The number of clones alone does not provide complete information on the intensity of transmission as multiple related parasites can be inoculated by a single mosquito bite (Volkman et al., 2012). To gain insight into relatedness in polyclonal infections we used pairwise identity by descent (IBD). We have previously used IBD to identify related parasites within P. falciparum infections (Nair et al., 2014; Nkhoma et al., 2020; Trevino et al., 2017). This approach is robust in this setting, as close relatives share long unbroken segments of their genome IBD, while distant relatives share fewer and shorter fragments (Browning and Browning, 2012; Huff et al., 2011). We used the integrated dataset to infer the presence of large blocks of IBD. We limited analysis to 10,304 sites with a population level minor allele frequency of >5%. We found the average length of IBD present within an infection to be 1.39Mb (within TP1), 1.31Mb (within TP2) and 0.71Mb (between TPs), with an average of total shared IBD to be 19.7Mb (within TP1), 18.2Mb (within TP2) and 10.2Mb (between TPs) between parasites of the same infection (Fig. 2 A,B). IBD sharing between TPs was significantly shorter than TP1 (p=0.008, t=3.41, t-test), and TP2 (p=0.016, t=2.96, t-test), and covered a significantly smaller part of the genome for both TP1 (p=0.015, t=3.15, t-test) and TP2 (p=0.0311, t=2.60, t-test). No significant difference was observed comparing the IBD distribution within TP1 to the IBD distribution within TP2. In contrast, we found the average length of IBD present between parasites from different infections to be 0.2Mb (average total shared IBD = 2.3Mb) which was significantly shorter than all the within infection comparisons (t=175.87, p<2.2x10⁻¹⁶,t-test).
Figure 2. IBD Sharing within and between infections.
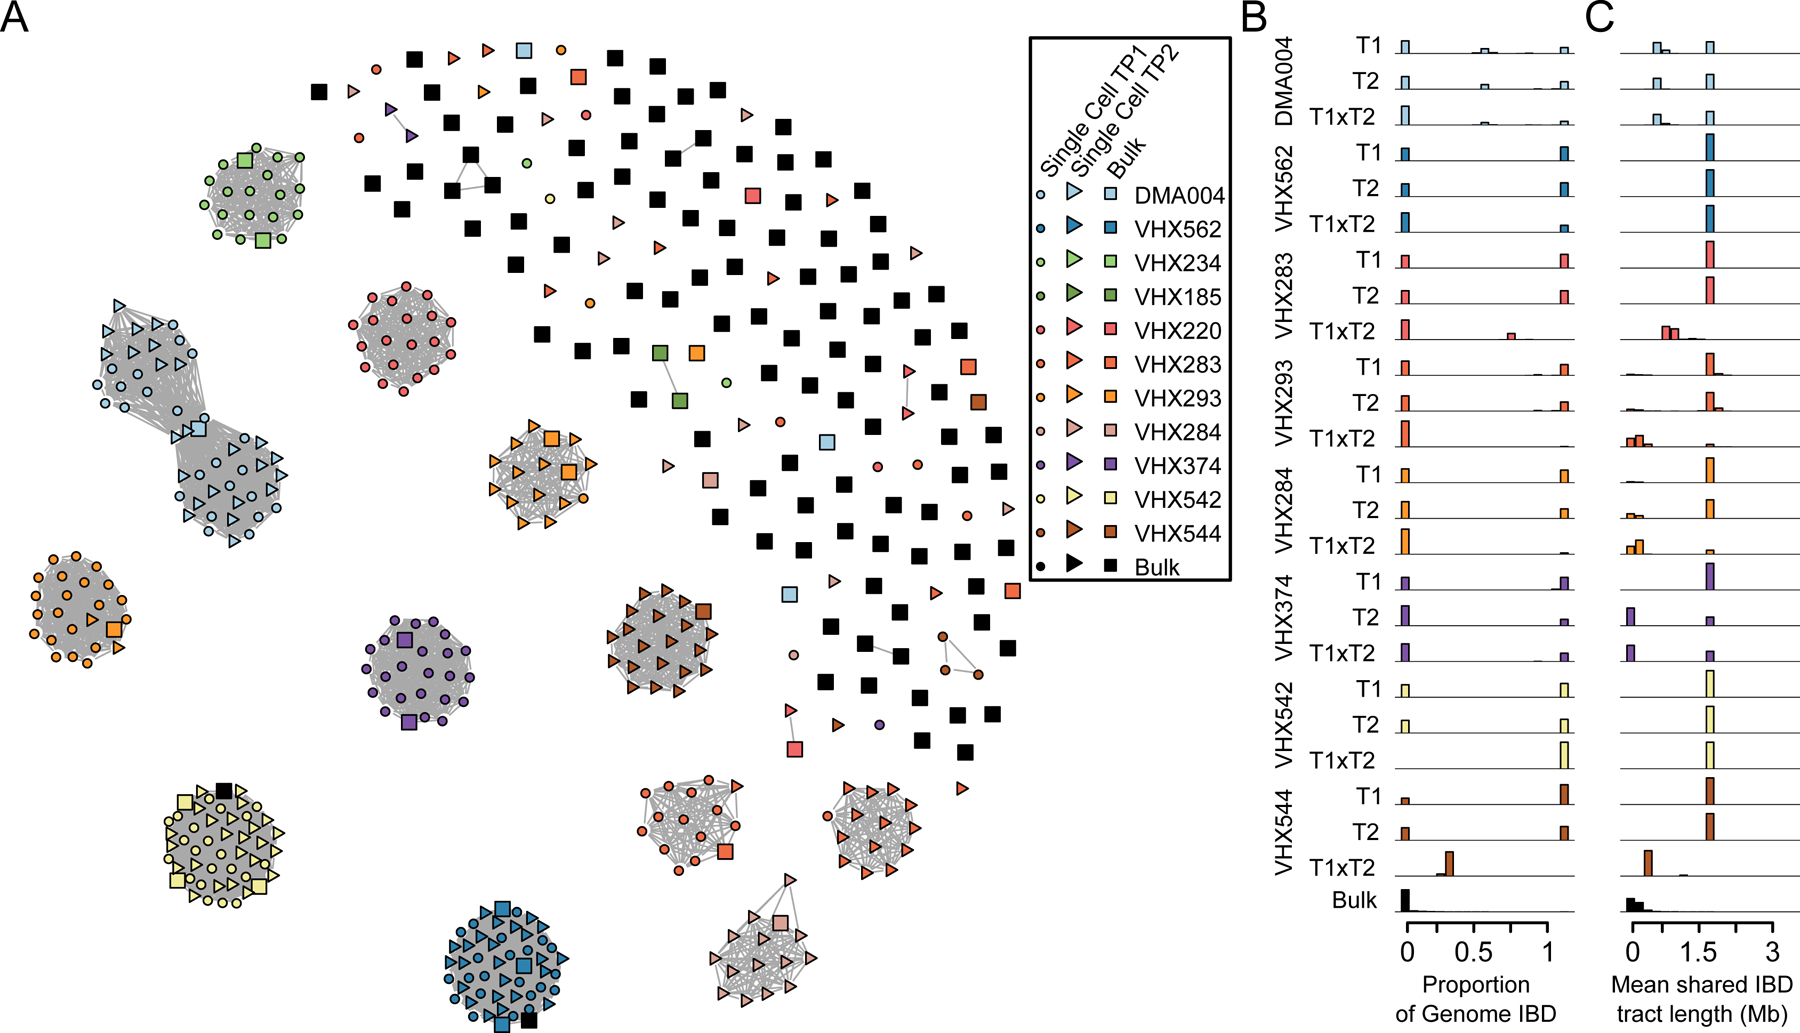
(A) A network representation of pairwise IBD. Nodes are individual samples (either bulk or single cell), and are joined by edges when they share >75% of their genomes IBD. Nodes are colored by infection and time point, circles are single cell data and squares bulk data. Data from 82 bulk infections is also included. At this threshold there are few bulk infections which share sufficient IBD for edges to be generated. A range of IBD sharing thresholds is shown in Supplementary Fig. 2. We see that parasites from within infections and across time points form tight clusters indicative of recently ancestry. (B) The distribution of proportion of total shared IBD within infection time points. (C) The distribution of mean IBD tract length in Mb within infection time points. For each infection we see parasites which are more related to one another than the population background.
We visualized the extent of IBD sharing within and between infections at the Thai-Myanmar border (Fig. 2A). At a permissive threshold of IBD sharing (i.e. >0.05), both population samples and within infection data share IBD, with only 7/82 (8.53%) of population samples not sharing IBD with any other isolate. IBD sharing among population samples rapidly declines as the minimum threshold for IBD sharing increases (Supplementary Figure 2), though 9/82 (11.0%) related samples remain even when genome-wide IBD sharing thresholds reach 0.75 (Fig. 2A). Single cell samples from the same infection remain highly connected over a range of IBD thresholds. With more stringent thresholds it is possible to identify related, non-clonal clusters of parasites. Infection DMA004 is composed of two related haplotypes, both sharing high relatedness to the bulk sample, though do not form direct links between haplotypes in Figure 2A. In summary, our data support that relapse is present in every patient we have sampled. In addition, we see either reinfection or emergence of a senescent genotype contributing additional genetic diversity in 4 of the 9 patients with sufficient data.
Identifying putative de novo mutations
The identification of de novo mutations from human cancer (Kim et al., 2018; Navin et al., 2011; Wang et al., 2014) and somatic single-cell sequencing data (Lodato et al., 2018; Lodato et al., 2015) has revealed the extent of adaptation within an individual. In bacterial and viral host-pathogen systems, within-patient evolution has been observed (Feder et al., 2017; Lieberman et al., 2014; Lieberman et al., 2011; Lieberman et al., 2016; Theys et al., 2018). To evaluate intrahost evolution in P. vivax, we identified de novo mutations arising within single infections. We used our estimates of IBD to group cells from the same ancestor. IBD clones share >99% of their genome IBD, though retain a small number of putative de novo mutations. We identified putative de novo mutations (PDMNs) as sites where alternative SNPs were present within clonally identical groups. A major hurdle in categorizing de novo mutation from single cell sequencing data is an excess of C:G>T:A mutations which arise from spontaneous cytosine deamination during cell lysis (Dong et al., 2017). We saw limited evidence of this artifact in our data (p=0.78, X=7.59, X2 test; Supplementary Figure 4). As our protocol relies on amplification from multiple templates (Trevino et al., 2017) we effectively filter out this artifact as mutations which are not fixed in a single cell similarly to linked read calling in humans (Bohrson et al., 2019). We identified a total of 1,373 PDMNs arising within infections (Supplementary Figure 4). We performed visual inspection of all genotypes, filtering out 893 of 1,373 sites (65.0%) as sequencing and amplification errors. We outline the criteria used for manual inspection of SNPs in Supplementary Figure 5. Most filtered sites were excluded due to evidence of misaligned reads, and clustered in msp3 and sera gene families. Notably, we did not detect an excess of misaligned reads in other multigene families in the core parasite genome such as the msp7 gene family. This is likely driven by the high levels of genetic variation in the msp3 (1 SNP/12bp) and sera (1 SNP/23bp) compared to the msp7 gene family (1 SNP per 60bp).
Patterns of recurrent inbreeding in P. vivax infections
Recurrent inbreeding has been previously observed in P. falciparum infections (Nkhoma et al., 2020; Zhu et al., 2019). In addition to high levels of IBD sharing between infection time points we examined parasites for short stretches of variation which may be indicative of recurrent inbreeding, though not captured by hmmIBD. We expect mutation derived from recurrent inbreeding to contain variation present in the population in general, for variation to be clustered in short chunks of the genome and for cells containing such stretches to have a substantially higher number of PDMNs than other cells in the same infection. We examined the proximity of PDMNs, the burden per cell, and the population level allele frequency (PLAF) of each PDMN (Fig. 3, Supplementary Figure 6). We identified 9 cells where either mutations specific to a cell were present in the general population (PLAF>0) or a high number of mutations were seen in a single cell (>30 PDNMs). In addition, we identified 6 variants in a single infection (VHX542) which completely separate infection time points (Fig. 3A,C,E), with 3 of these variants lying in a single intergenic region. The median distance between PDNMs in the 9 cells where recurrent inbreeding was suspected was, 43.3kb, significantly closer to one another than those in other cells (215.8kb, p=3.6x10⁻¹⁵, t=8.4, t-test) supporting the origin of these mutations. Following the exclusion of 9 cells where variation is likely driven by inbreeding, and the splitting of VHX543 into two haplotypes we retained 298 PDNMs which had strong evidence of having arisen de novo in the current infection.
Figure 3. Extreme inbreeding can explain clusters of putative mutations.
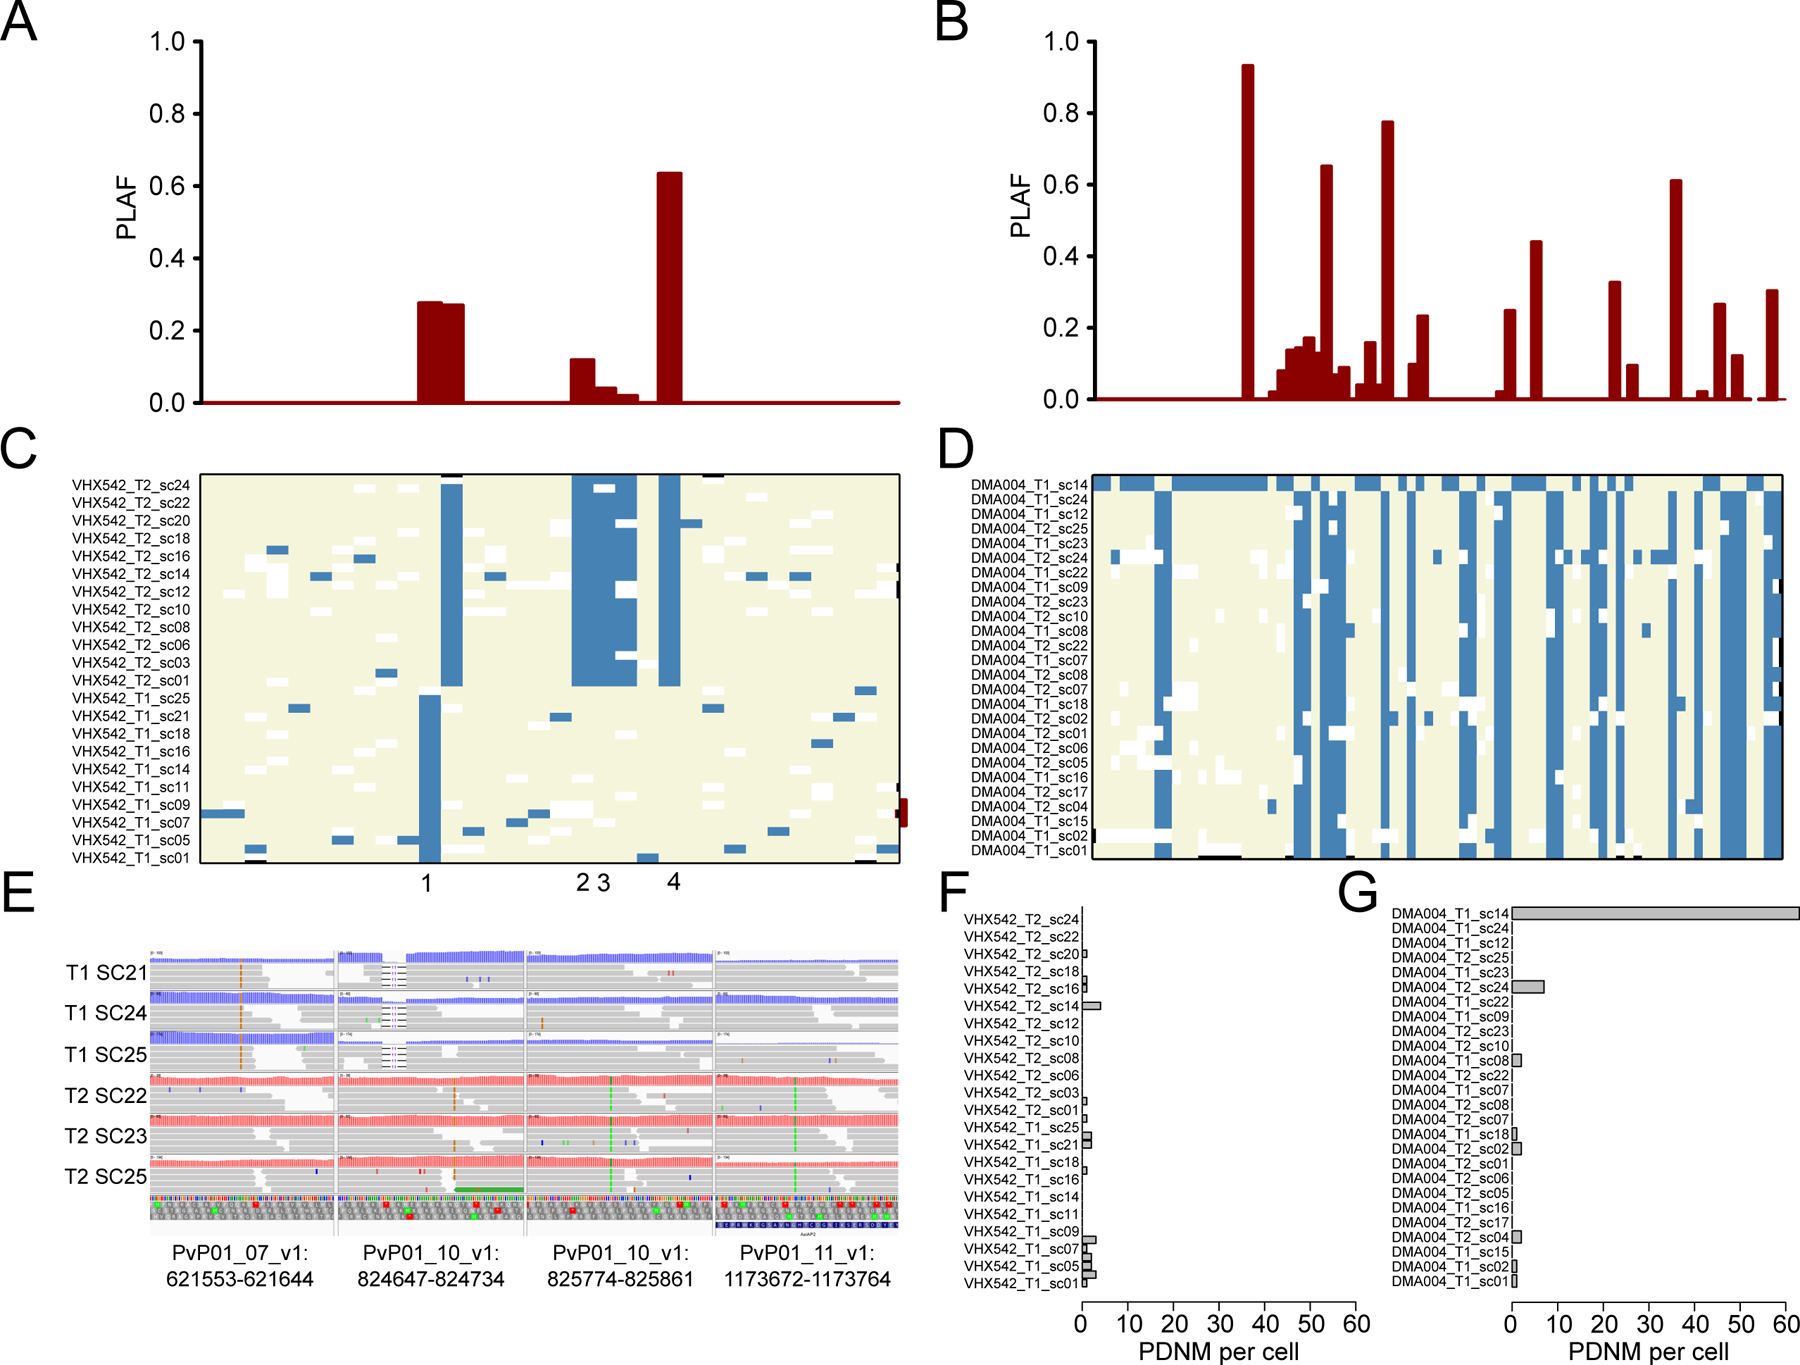
Population level allele frequencies (PLAF) for each putative de novo mutation (PDNM) for VHX542 (A) and DMA004 haplotype 1 (B). PDNMs are ordered by chromosomal location. For VHX542 all high frequency differences are present in the population and are unlikely to be from de novo mutation. Genotypes for each PDNM in VHX542 (C) and DMA004 haplotype 1 (D). Reference alleles are in beige and alternative alleles are in blue. The order of PDNMs is the same as in (A) and (B). A single cell in (D) contains most variation in the sample (~60 PDNMs), most of these PDNMs are variable in the population. Read pile-ups for PDNMs from regions of inbreeding (E), three cells are shown from each time point. The distance between each PDNM in DMA004 haplotype 1. For each pile-up read depth is >40X and the mutation is supported by >99% of the reads. The number of unique PDMNs observed in each cell is shown for VHX542 (F) and DMA004 haplotype 1 (G).
Most de novo mutations arise during the blood stage
The hypnozoite stage is thought to lay dormant in the liver and give rise to relapse infection. However, hypnozoites are transcriptionally active to some degree (Voorberg-van der Wel et al., 2017) and may contribute to the mutational burden within a single infection. In our data eight of the clonal groups identified above span multiple time points. These allow us to test if hypnozoite stages contribute substantially to intrahost variation. We found no excess of mutations in TP2 compared to TP1, either comparing all cells at each TP (p=0.84, t=0.21, t-test) or across paired TPs (p=0.17, t=−1.7, paired t-test). We additionally explored if the number of mutations accrued in TP2 samples correlated with the interval between episodes (Fig. 4A–B). We found no significant correlation between mutation burden and interval between episodes (p=0.24, r=−0.08, t=−0.22). Finally, we searched for mutations which distinguish TP1 from TP2 within clonal groups. No mutations were found which distinguish sampling time points. We find no support for an appreciable mutation rate during the hypnozoite stage, suggesting most mutations detected in this study arose during blood stage growth.
Figure 4. Identification of mutations defining recurrences in VHX542.
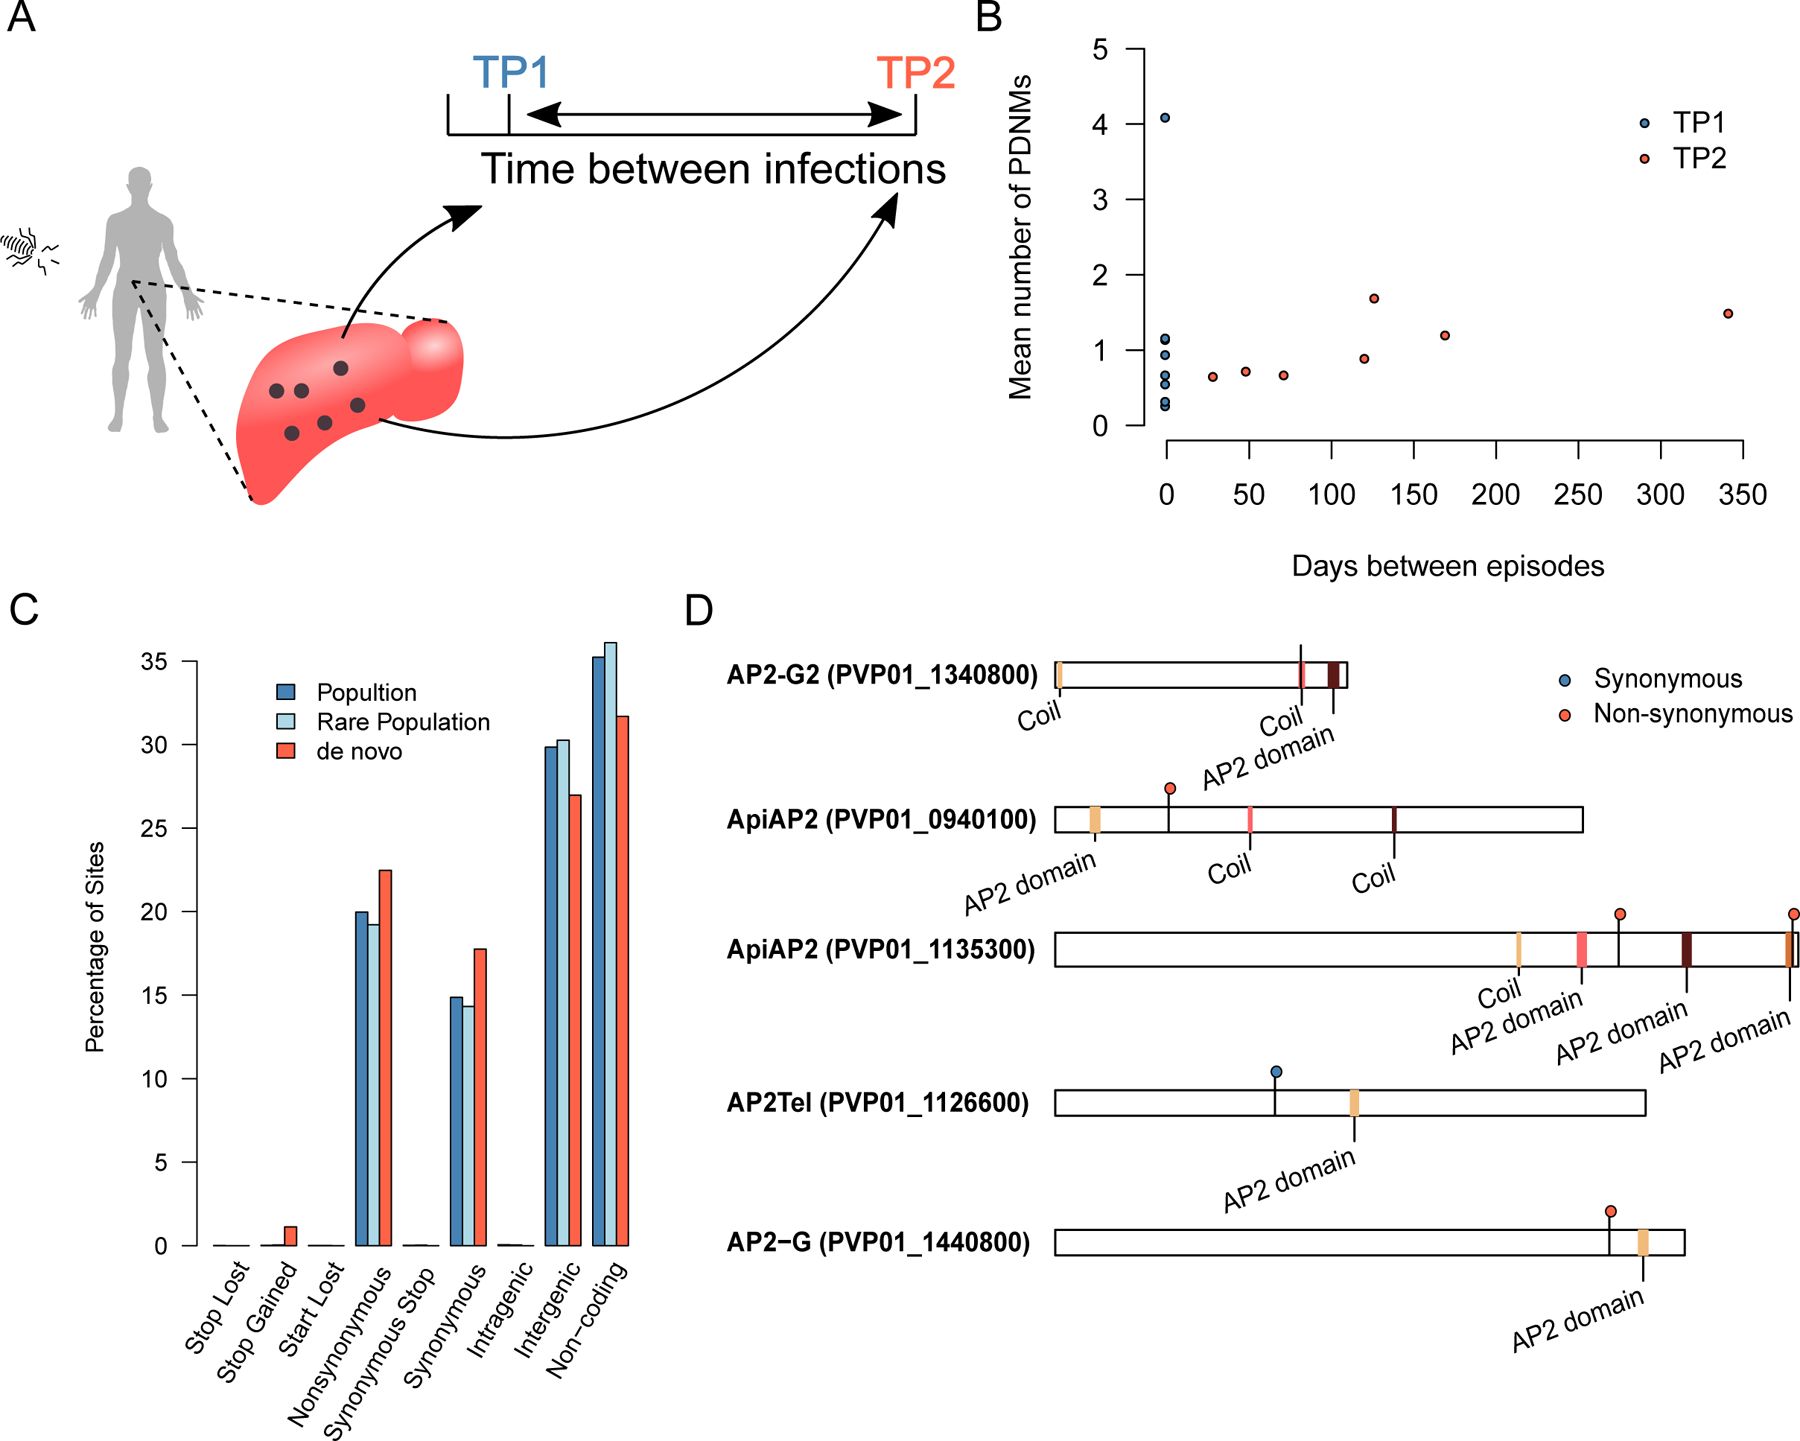
(A) Hypnozoite stage parasites reside in the liver, and periodically reactivate, causing a recurrence. (B) There is no correlation between the time interval between recurrences and the mean number of mutations accrued by a cell. (C) The proportion of mutations in the P. vivax genome categorized by functional impact. Population denotes all mutations detected in Thailand from Pearson et al, Rare Population is a subset of these mutations present at <1% frequency. (D) The domain structure of the five P. vivax ApiAP2 genes showing mutations in this study.
Intrahost clonal dynamics support rapid expansion from the liver
Each hypnozoite is derived from a single sporozoite. After hypnozoite activation the parasite rapidly proliferates and emerges from the liver reaching a density of ~1010 parasites in the blood stream. In such large parasite populations multiple beneficial mutations likely arise within an individual patient, and their dynamics may be determined by intrahost selection (Fogle et al., 2008). We have previously used single cell sequencing to characterize the emergence of clonal interference in small populations of laboratory cultured malaria parasites, revealing the presence of multiple competing lineages within 70 generations (Jett et al., 2020). We examined our data to find high frequency mutations indicative of the expansion of a clonal lineage. We only identified singleton mutations. Rapid clonal expansion, as is seen during the early stages of parasite growth, typically results in an excess of rare mutations such as this.
Recurrent mutation impacts genes under selection
We tested if PDNMs are enriched for functional variants by comparing the predicted impact of variants polymorphic in the population to our curated PDNMs. There was an excess of mutations in coding regions in PDNMs (observed=159, expected=102.18) and in mutations generating premature stop codons (observed=4, expected=0.06, χ2 test, χ=343.6, p=2.1x10−69, Figure 4C, Supplementary Table 2). Within our data 159 of 298 (53.4%) mutations arise in 90 genes, with 5 of these genes (5.5%) affected by multiple mutations (Fig. 4C). Analysis of gene ontology (GO) terms on all 159 genes impacted by mutation show an enrichment for “sequence specific DNA binding”. (FDR corrected p=0.0439). The enrichment for sequence specific DNA binding is driven by mutations in 4 of the 25 (16%) members of the ApiAP2 gene family (Fig. 4D). Previous P. vivax genome sequencing efforts have revealed strong selection acting upon this gene family (Auburn et al., 2018; Auburn et al., 2019; Dharia et al., 2010; Parobek et al., 2016).
Signatures of selection in P. falciparum infections
We have previously performed single cell sequencing of a population of P. falciparum parasites derived from symptomatic malaria cases in Chikhwawa, Malawi (Nkhoma et al., 2020) (Supplementary Figure 3). To test if convergent signals of selection were present in these patients we applied out de novo mutation identification framework to this data. We identified 674 PDNMs in the core parasite genome (Miles et al., 2016), and verified 246 of these through visual inspection (Supplementary Table 3) though did not find evidence of cryptic relatedness in these samples. We find strong evidence that PDNMs are under selection in P. falciparum (Figure 5D–E). Of the 246 PDNMs, 203 were coding mutations of which 150 were non-synonymous coding mutations (73.9%), 41 were synonymous mutations (20.2%), and 12 were premature stop codons (5.9%). This represents a significant enrichment in putatively functional mutations compared to standing variation in the population (NS: observed=150, expected=99.4, Stop: observed=12, expected, 2.5, χ2 test, χ=99.8, p=2.7x10⁻¹⁹). It closely mirrors the proportions of SNP mutations found in the core parasite genome in large scale chemogenomics experiments (Cowell et al., 2018) (82% of coding mutations nonsynonymous, 11.7% synonymous, 5% premature stop codons), with the ratio of non-synonymous to synonymous mutations 3.65:1. We found mutations impacted 181 genes, with 11 genes subject to recurrent mutation (6.1%), a similar proportion to P. vivax. Likewise, we identified multiple members of the ApiAP2 gene family were impacted by mutations including a premature stop codon in PF3D7_1139300 and a synonymous mutation in PF3D7_0516800 (ApiAP2-O2). Gene ontology term analysis of genes affected by de novo mutation identified translation factor activity as significantly enriched (FDR corrected p=0.0191). This is driven by mutations in six translation initiation factors, and two elongation factors (Table 1).
Figure 5. de novo mutations in P. falciparum are enriched for functional changes in dispensible, and highly expressed genes.
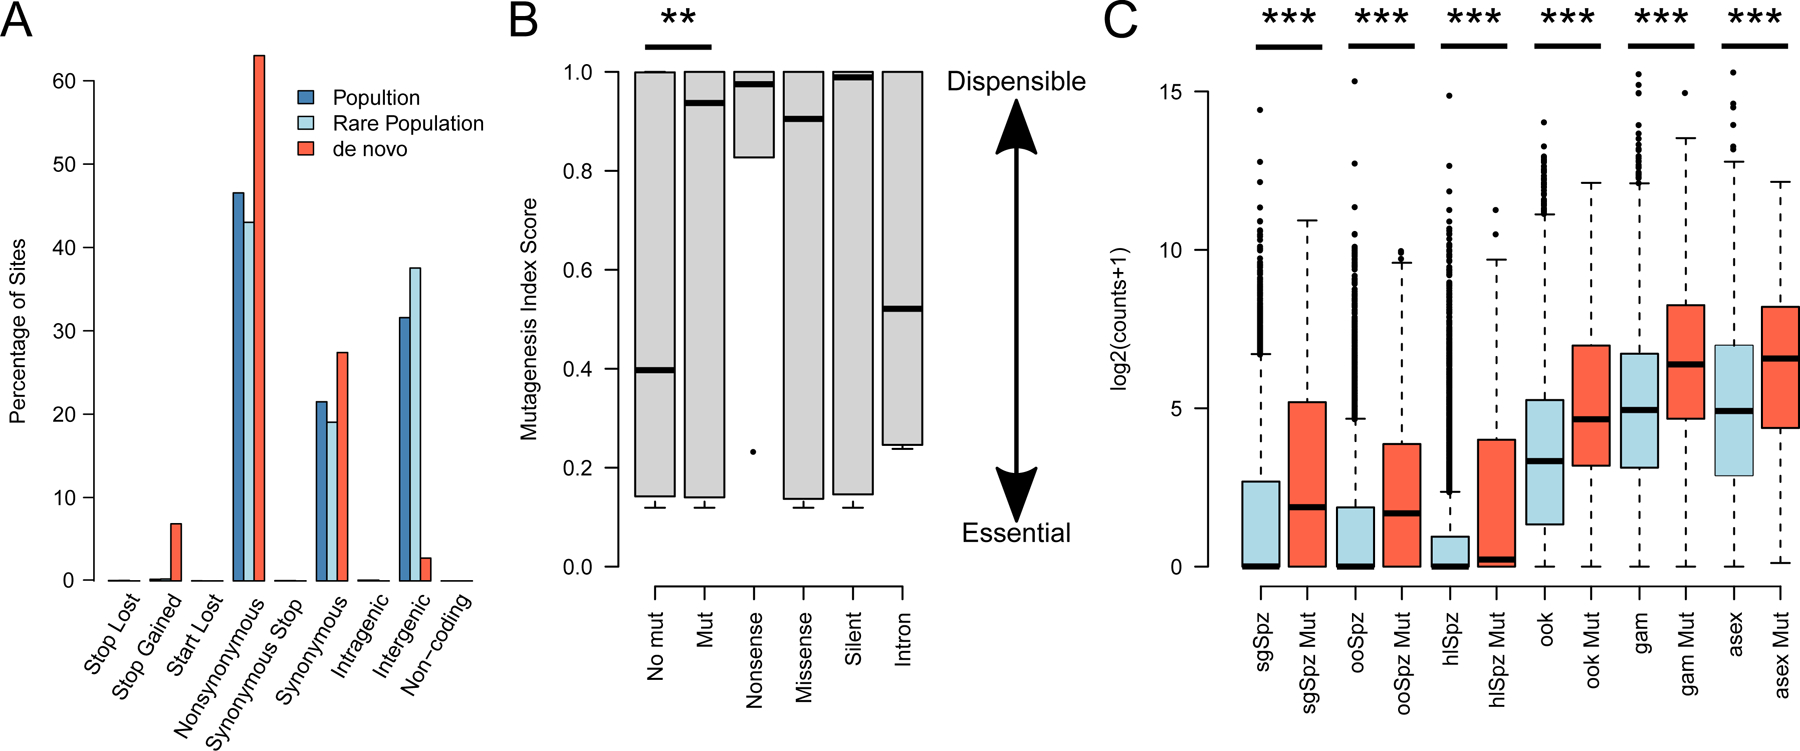
(A) The proportion of mutations in the P. falciparum genome categorized by functional impact. (B) There is a significant enrichment of putative de novo mutations (PDMNs) in genes which are dispensible for blood stage function in vitro. The distribution of Mutagenesis Index Score (MIS) is significantly higher in genes where PDNMs are detected (Mut.) than those where no PDNM was detected (No Mut.). The distribution of MIS is shown for each class of genic mutation. (C) Within each life cycle stage genes where PDNMs were detected (Mut) were expressed significantly higher than other genes (sgSpz – salivary gland sporozoites, ooSpz – oocyst sporozoites, hlSpz – hemolymph sporozoites, ook – ookinetye, gam – gametocytes, asex – asexual blood stage.
Table 1.
Annotated genes bearing putative de novo mutations with the GO term “translation factor activity”.
| Gene ID | Mutation | Gene Name | Functional Domain impacted |
|---|---|---|---|
| PF3D7_0111800 | P463L | eukaryotic translation initiation factor 4E, putative | - |
| PF3D7_0315100 | C154Y | eukaryotic translation initiation factor 4E | eIF4e-like |
| PF3D7_0517700 | Q448* | eukaryotic translation initiation factor 3 subunit B, putative | eIF2A |
| PF3D7_0612100 | E13 | eukaryotic translation initiation factor 3 subunit L, putative | - |
| PF3D7_0827100 | D1369N | translation initiation factor IF-2, putative | - |
| PF3D7_0828500 | T185I | translation initiation factor eIF-2B subunit alpha, putative | eIF2B |
| PF3D7_0602400 | G239R | elongation factor G | GTP binding |
| PF3D7_1330600 | M122I | elongation factor Tu | GTP binding |
| PF3D7_1330600 | G430R | elongation factor Tu | C-terminal domain |
Using publically available datasets we were able to test if PDNMs identified in P. falciparum are enriched for genes known to be dispensable during in vitro blood stage culture (Zhang et al., 2018) (Fig. 5B). Compared to the genome-wide distribution, genes bearing PDNMs had significantly higher mutagenesis index scores (MIS) suggesting they arise in genes which are mostly dispensable for blood stages growth. We used single cell transcriptomic data obtained from across the entire parasite life cycle (Howick et al., 2019; Real et al., 2021) to test the association between gene expression levels and genes bearing PDNMs. While comparison across stages is challenged by wildly varying transcription activity, within each life cycle stage we see genes bearing PDNMs are expressed at a significantly higher rate than other genes.
Parallel Targets of Adaptation in P. vivax and P. falciparum infections
As both P. vivax and P. falciparum tackle similar within host pressures convergent patterns of adaptation at the level of genes or pathways may emerge. To explore this we identified 4,164 orthologues shared between the P. vivax P01 assembly and the P. falciparum 3D7 assembly from OrthoMCL (Li et al., 2003). We identified 12 orthologous genes where de novo mutations ascertained here have arisen in both species (Table 2). We performed bootstrap resampling to test if this was in excess of expectations from random sampling by randomly drawing gene lists the same size as those detected in either P. vivax or P. falciparum and counting the intersect. Only 59 of 100,000 samples contained 12 intersecting genes or higher (p=0.00059, by permutation, Supplementary Figure 7). Five of the intersecting genes contained either non-synonymous or nonsense mutations in both species (Table 2), one of which (elongation factor, G) is also highlighted in Table 1, another (ApiAP2 transcription factor) is highlighted above. Intriguingly, elongation factor G bears mutations adjacent to the GTP-binding domain in each species. We tested for convergent adaptation at the level of GO terms, again restricting analysis to orthologous genes. We implemented a permutation strategy previously used to test for common signatures of within-host adaptation across bacterial pathogens (Gatt and Margalit, 2020). After correction for multiple testing we identified three significant GO terms, two significant KEGG pathways and ten significant MetaCyc pathways (Supplementary Table 4). These included pathways driving the synthesis of several biomolecules (i.e. pseudouridine, sesamin, iron-sulfer cluster, puromycin, coenzyme-A, echinocandin B, purine).
Table 2.
Orthologue pairs with potentially functional mutations arising during infections.
| Gene ID | Product Description | Mutation | Amino Acid Change |
|---|---|---|---|
| PF3D7_0317300 | conserved Plasmodium protein, unknown function | MISSENSE | N3204D |
| PVP01_0822800 | conserved Plasmodium protein, unknown function | MISSENSE | D1079N |
| PF3D7_0602400 | elongation factor G | MISSENSE | G239R |
| PVP01_1146500 | elongation factor G, putative | MISSENSE | A219V |
| PF3D7_1021700 | conserved Plasmodium membrane protein, unknown function | MISSENSE | S4278F |
| PVP01_0606900 | conserved Plasmodium protein, unknown function | MISSENSE | V444I |
| PF3D7_1244100 | N-alpha-acetyltransferase 15, NatA auxiliary subunit, putative | MISSENSE | S688F |
| PVP01_1461200 | N-alpha-acetyltransferase 15, NatA auxiliary subunit, putative | MISSENSE | Y953H |
| PF3D7_1139300 | AP2 domain transcription factor, putative | NONSENSE | R1240* |
| PVP01_0940100 | AP2 domain transcription factor, putative | MISSENSE | S609G |
Discussion
A single cell genomics approach for low parasitaemia infections
We adapted a single cell sequencing protocol (low parasitaemia single cell sequencing (LPSCS)) to explore genetic relatedness and mutation within low parasitaemia malaria infections. Here we use LPSCS to study P. vivax infections, though as our approach is not reliant upon culture adaptation to boost parasitaemia it is applicable to all human malaria parasite species. Critically, it will enable us to dissect samples beyond the reach of conventional approaches such as asymptomatic infections which comprise the dominant reservoir of malaria infection globally (Bousema et al., 2014).
Relapse is the major cause of secondary P. vivax infections
Serial episodes of P. vivax parasitaemia in individual patients have previously been analyzed (Bright et al., 2014; Imwong et al., 2007; Lin et al., 2015; Popovici et al., 2018; Taylor et al., 2019). These suggest that recurrent infections are often related, or identical, to primary infections. The samples studied here were included in a study which estimated the likelihood of relapse, recrudescence or reinfection (Taylor et al., 2019). In this geographical location Taylor et al (Taylor et al., 2019) predicted that relapse is the most likely causes of secondary infection when primaquine is not given. None of the patients in this study were treated with primaquine. The probability of relapse being the source of secondary infection declines with increased time since the original infection. The increased resolution we leverage here is in agreement with this conclusion, though notably the limited number of samples we have focused on here do not allow a quantitative comparison. For instance, in the two patients containing only related parasites 1–4 months separate infection time points (Supplementary Table 5). In the four patients with longer intervals between episodes we see additional unrelated parasites. These unrelated parasites are either the result of new mosquito inoculations or parasite genotypes which did not erupt from the liver in the initial episode.
Recurrent inbreeding in P. vivax infections
Across our data we found cells from multiple infections which showed high numbers of putative de novo mutations after strict quality control, despite sharing >99% IBD with other cells from the same infections. This is most striking in VHX542 where we see 6 mutations completely distinguish infection time points. These mutations clustered into short tracts of the genome indicative of either recurrent inbreeding, an elevated mutation rate or an elevated error profile. The enrichment of SNPs which are polymorphic in the general population, the clustered intrachromosomal location of SNPs and the lack of evidence for either elevated technical error rates or increased mutation rates support these being due to recurrent inbreeding. It is difficult to place exact boundaries on the tract size of the remnant variation present, though the lower bound is in the order of 130kb (50–400kb), less than 1% of the genome. This is similar to what is observed after 8–10 generations of inbreeding between recombinant inbred lines (Broman, 2005). We similarly detected infections with evidence of differing degrees of inbreeding in a broader scale analysis of IBD in Fig. 2. This would suggest P. vivax infections are frequently passaged through mosquito-human-mosquito transmissions without superinfection as we have suggested in P. falciparum infections from areas of high endemicity (Nkhoma et al., 2020). Fine-scale identification of these patterns of inbreeding would not be feasible without the sensitive approaches we have taken. Interestingly, we see putatively functional mutations within inbred genomic foci. A stop codon in the homologue of pfkelch13, which defines artemisinin resistance in sympatric populations of P. falciparum (Ariey et al., 2014), is particularly striking.
De novo mutation within malaria infections
Single cell sequencing of cancer genomes has enabled direct inference of driver mutations, classification of the evolutionary history of a tumor (Navin et al., 2011; Wang et al., 2014) and characterization of drug resistant clones (Kim et al., 2018). The ability to capture genetic variation from an individual cell here enables us to determine the dynamics of mutations which have arisen during an infection. Using stringent scoring methods, we found 159 de novo mutations in 90 genes for P. vivax and 203 de novo mutations in 181 genes for P. falciparum. We have been careful to exclude variation which may be derived from inbreeding and sequencing error, though the identification of de novo mutations from single cell data is an emerging field and some residual error may remain. We also note our conservative approach excludes variation in hypervariable gene families where we would naively anticipate to find substantial de novo mutation.
We find support that many observed mutations may be adaptive. Mutation impacts the same genes disproportionately, of the 165 genes impacted by de novo mutation 5.5–6.1% were recurrently targeted. At the level of gene families we find recurrent mutation across the ApiAP2 family of transcription factors, well described targets of selection (Auburn et al., 2018; Auburn et al., 2019; Dharia et al., 2010; Parobek et al., 2016). The patterns of de novo mutation we identify are non-random, and support convergence of strategies between species at the gene level. As we survey infections with deeper levels of resolution the role intrahost mutation plays on adaptation to an individual host will be clearer. We see dispensable genes showing an excess of PDNMs and genes highly expressed across the parasite life cycle. Further work will be needed to understand if this represents a mechanism of increased mutation rate in highly transcribed genes, as has been observed in other systems (Park et al., 2012).
De novo mutations can occur during the hypnozoite stage in the liver, or alternatively during blood stage growth. Firstly, multiple statistical approaches suggest that the hypnozoite stage contributes few de novo mutations compared with blood stage growth. Within the blood stages most mutations are singletons, a pattern consistent with exponential growth of parasites after emerging from the liver. We previously showed competitive dynamics can arise rapidly within in vitro cultured malaria parasites (Jett et al., 2020). However, competitive lineages did not reach high frequency until ~70 generations. Consistent with this we do not observe high frequency mutations in this study. We likely sample parasites within 15–20 generations after emergence from the liver, too soon for even highly beneficial mutations to reach dominance.
Population genomics work using bulk infections is unable to examine intrahost evolution in malaria parasites, so most work has focused on the role of recombination in generating genetic variation. Examining genome sequence data from single infected blood cells clearly reveals that mutation and selection within hosts play a key role in malaria parasite evolution, as occurs in bacterial and viral infections. This approach will allow direct interrogation of host-parasite interactions and intrahost parasite evolution.
STAR METHODS
RESOURCE AVAILABILITY
Lead contact
Further information and requests for resources and reagents should be directed to and will be fulfilled by the Lead Contact, Ian Cheeseman (ianc@txbiomed.org)
Materials Availability
This study did not generate new unique reagents
Data and code availability
This study did not generate any original code
Raw sequencing data have been submitted to the NCBI Short Read Archive under the accession PRJNN738867
Any additional information required to reanalyze the data reported in this paper is available from the Lead Contact upon request.
EXPERIMENTAL MODEL AND SUBJECT DETAILS
Human participants
The VHX study was conducted between May 2010 and October 2012 by the Shoklo Malaria Research Unit in clinics along the Thailand–Myanmar border and has been previously reported (Chu et al., 2018; Taylor et al., 2019). This is an area with low seasonal malaria transmission where primaquine radical cure treatment is not routine. We actively detected recurrent episodes at scheduled visits by microscopy. All recurrences were treated, irrespective of symptoms. In total, 644 patients older than 6 months and weighing more than 7 kg with microscopy confirmed uncomplicated P. vivax mono-species infection (P. vivax only) were randomised to receive artesunate (2 mg/kg per day for 5 days), chloroquine (25 mg base per kg divided over 3 days: 10, 10, and 5 mg/kg), or chloroquine plus primaquine (0.5 mg base per kg per day for 14 days). G6PD-deficient patients (as determined by the fluorescent spot test) were randomised only to the artesunate and chloroquine monotherapy groups. Subjects were followed daily for supervised drug treatment. Follow-up continued weekly for 8 weeks and then every 4 weeks for a total of 1 year. Patients with microscopy confirmed P. vivax infections were retreated with the same study drug as in the original allocation. Patients in the artesunate or chloroquine monotherapy groups who experienced more than 9 recurrences were given radical curative treatment with the standard primaquine regimen (0.5 mg base per kg per day for 14 days). For this study only patients from the monotherapy groups (without primaquine treatment) were selected. The VHX study was given ethical approval by the Mahidol University Faculty of Tropical Medicine Ethics Committee (MUTM 2010–006) and the Oxford Tropical Research Ethics Committee (OXTREC 04–10) and was registered at ClinicalTrials.gov (NCT01074905). Clinical and demographic information on the patient samples included here are shown in Table S1.
Malaria parasites
Parasite culture
Approximately 1 mL of cryopreserved blood sample was thawed at 37°C to revive intact cells (~200ul recovered pellet, <1% parasitemia). The sample was washed twice by adding 10mL of incomplete media (incomplete McCoy’s 5A medium with 0.02M HEPES, 0.5 % w/v glucose, and 0.01 ng/mL gentamicin added according to normal culture conditions(Sharrock et al., 2008). Following the final centrifugation step (425 x g for 5 minutes) cells were resuspended and grown in 6 mL complete media (incomplete McCoys 5A to which 25% of pooled human AB+ serum (Thermo-Fisher) was added) in a T25 tissue culture flask incubated in a chamber flushed with 5% CO2, 5% O2 and 90% N2. The culture flask was incubated at 37°C for 40–44 hours to allow for parasite progression to late stages, which generates higher quality genomic data after MDA and library preparation (Trevino et al., 2017).
After 37°C incubation, approximately 150μL of the infected packed RBCs were run over a LD MACS (Miltenyi) column and schizont enriched parasites were eluted from the column with CM then rested at 37°C for 1 hour to recover from separation. To stain parasitized cells in readiness for FACS, schizont enriched red cells were centrifuged, brought up in 4mL warm ICM which included 1.5 μl of Vibrant DyeCycle Green (Invitrogen), and incubated at 37°C for 30 minutes with intermittent manual inversion of the tube approximately every 10 minutes. Cells were washed once in ICM and resuspended in 500μL of ICM in a foil-covered tube to protect the dye from photobleaching in preparation for FACS sorting. Catalog numbers for the critical reagents used in parasite culture and capture of single parasitized cells are provided in the Key Resources Table.
METHOD DETAILS
Single-cell capture
We performed single cell capture, whole genome amplification, sequencing analysis and followed guidelines for preventing contamination using the approaches described in (Nair et al., 2014; Trevino et al., 2017). We outline these approaches below.
FACS Sorting
Cells from parasite culture were sorted by BD Influx (BD Biosciences, San Jose, Ca, USA) equipped with a 100 μm nozzle. Cells were gated based on their DNA fluorescence as is shown in Supplementary Figure 1. The sort was run in single-cell sort mode with a drop envelope of 0.5. Individual cells were sorted into 96 well Lo-Bind low profile plates (Eppendorf) containing 5 μl autoclaved sterile PBS (Lonza), which had been prepared under sterile conditions in a PCR hood. Each plate of 36 single cells required about 2 minutes to sort. Plates were then immediately stored on dry ice and transferred to −80 °C longer-term storage within an hour.
Generation of single-cell DNA libraries
Library preparation for individually sorted late-stage parasites was carried out using the Qiagen Single-Cell FX DNA kit according to manufacturer’s instructions. Whole genome amplification preparation was carried out under a PCR hood and DNA was amplified on a dedicated PCR machine. Adapter ligated libraries were amplified 5 cycles with the Qiagen GeneAmp kit to resolve all products and allow for better sample normalization. Library products were analyzed by Agilent TapeStation for fragment size. Adapter-ligated DNA products were quantified by KAPA Hyperplus Kits. Sequencing was performed on Illumina platforms either 2500 or NovaSeq. Raw sequence data has been deposited at the sequence read archive (https://www.ncbi.nlm.nih.gov/sra) under study number PRJN738867.
Sequencing of bulk samples
DNA was extracted from packed red cell pellets using the Quick_DNA Miniprep Plus Kit (Zymo Research) and DNA was eluted in 35uL. This volume was concentrated using the DNA Clean and Concentrate (Zymo Research) into 10uL. No measurable DNA was seen by QBit, so all DNA was added to a single well and processed using the Qiagen FX kit. Bulk sorted schizonts (300–1500cells) from the FACS runs were processed along with the single cells in 96 well plates using the Qiagen FX kit.
QUANTIFICATION AND STATISTICAL ANALYSIS
Sequence analysis
We aligned raw sequencing reads to v1 of the Plasmodium vivax P01 genome reference (http://www.plasmodb.org) using BWA MEM v0.7.5a (Li, 2013). After removing PCR duplicates and reads mapping to the ends of chromosomes (Picard v1.56) we recalibrated base quality scores, realigned around indels and called genotypes using GATK v3.5 (DePristo et al., 2011) in the GenotypeGVCFs mode using QualByDepth, FisherStrand, StrandOddsRatio VariantType, GC Content and max_alterate_alleles set to 6. We recalibrated quality scores and calculated VQSLOD scores using previously identified high quality SNPs (Auburn et al., 2018), excluding sites where the VQSLOD score was <0. We identified lines with potential cross contamination based on unfixed basecall frequency. As the parasite genome is haploid during blood stages all variants are expected to be fixed in genome sequencing data. We measured the proportion of mixed base calls (>5% of reads at a locus mapping to the minority allele) at high confidence biallelic SNPs (>10 reads mapped, VQSLOD>0, GQ>70). Using the cloned lines and bulk population samples as a guide we estimated 5% as an appropriate threshold for excluding putatively mixed lines (Figure S1). Putative de novo mutations were identified and custom .bat scripts written to generate .png files of the regions surrounding each mutation in all cells within the same IBD group for visual inspection. For each SNP we determined these to be errors if they failed any of the following checks (i) no reads aligned, (ii) the region surrounding the SNP contains misaligned reads, (iii) evidence of artefactual variation in other lines, (iv) too few high quality reads support variants (<5), (v) no evidence of variation in pileup. Examples of these are shown in Supplementary Figure 5 and the workflow to identify de novo mutation is shown in Supplementary Figure 3A.
Sequencing of P. falciparum data has been previously described (Nkhoma et al., 2020). To identify de novo mutations we adopted the same filtering approach as in P. vivax samples and the workflow to identify de novo mutation is shown in Supplementary Figure 3B. A graphical definition of standing and de novo variation is shown in Supplementary Figure 4B.
Estimating relatedness between sequences
SNP data were imported into R using SeqArray (Zheng et al., 2017). We called regions of IBD between all samples passing quality control using hmmIBD v2.0.0 (Schaffner et al., 2018) (https://github.com/glipsnort/hmmIBD). As hmmIBD is designed to deal with clonal, haploid data we masked all heterozygous sites from bulk infections from our own sequencing data prior to use. For population samples from Pearson et al (Pearson et al., 2016), we excluded all polyclonal samples. All other statistical analysis and visualization was performed in R v3.4.0 (Team, 2017). Network representation was performed using the igraph packages using shared proportion of IBD as a threshold. For the analysis in Figure 3 we used Manhattan distance to quantify the distance between cells, and visualized this in the dendextend package in R.
Enrichment in function categories
We used GO term enrichment analysis to identify gene ontologies significantly enriched in our data using the web server at PlasmoDB (Bahl et al., 2002; Bahl et al., 2003; Fraunholz and Roos, 2003) (www.plasmodb.com). We used the permutation strategy outlined in Gatt and Margalit (Gatt and Margalit, 2020) to test for enrichment in functional categories across species using pathways from OrthoMCL (Li et al., 2003).
Supplementary Material
KEY RESOURCES TABLE
| REAGENT or RESOURCE | SOURCE | IDENTIFIER |
|---|---|---|
| Biological Samples | ||
| Infected red blood cells | This Study | DMA004 TP1 |
| Infected red blood cells | This Study | DMA004 TP2 |
| Infected red blood cells | This Study | VHX185 TP1 |
| Infected red blood cells | This Study | VHX185 TP2 |
| Infected red blood cells | This Study | VHX220 TP1 |
| Infected red blood cells | This Study | VHX220 TP2 |
| Infected red blood cells | This Study | VHX234 TP1 |
| Infected red blood cells | This Study | VHX234 TP2 |
| Infected red blood cells | This Study | VHX283 TP1 |
| Infected red blood cells | This Study | VHX283 TP2 |
| Infected red blood cells | This Study | VHX284 TP1 |
| Infected red blood cells | This Study | VHX284 TP2 |
| Infected red blood cells | This Study | VHX293 TP1 |
| Infected red blood cells | This Study | VHX293 TP2 |
| Infected red blood cells | This Study | VHX374 TP1 |
| Infected red blood cells | This Study | VHX374 TP2 |
| Infected red blood cells | This Study | VHX542 TP1 |
| Infected red blood cells | This Study | VHX542 TP2 |
| Infected red blood cells | This Study | VHX544 TP1 |
| Infected red blood cells | This Study | VHX544 TP2 |
| Infected red blood cells | This Study | VHX562 TP1 |
| Infected red blood cells | This Study | VHX562 TP2 |
| Chemicals, Peptides, and Recombinant Proteins | ||
| Vybrant DyeCycle Green | Invitrogen | Cat #: V35004 |
| AccuGENE 1X PBS | Lonza | Cat #: 51225 |
| McCoys 5A media | Gibco | Cat #: 11875119 |
| Glycerolyte 57 Solution | Fenwal | Cat #: 4A7831 |
| Cellulose Type B powder | Advantec | Cat #: 49020020 |
| HEPES Buffer Solution | Gibco | Cat #: 15630-080 |
| Gentamicin Reagent Solution | Gibco | Cat #: 15710064 |
| Pooled Human AB+ Serum | Fisher | Cat #: BP2525-100 |
| Glucose | Gibco | Cat #: A24940-01 |
| Critical Commercial Assays | ||
| Single-Cell FX DNA | QIAGEN | Cat#: 180714 |
| Deposited Data | ||
| Single cell sequence data | This Paper | Study Number: PRJN738867 |
| Single cell sequence data | Nkhoma et al(Nkhoma et al., 2020) | Study Number SRP155167 |
| Genome Sequencing data | Pearson et al(Pearson et al., 2016) | https://www.malariagen.net/resource/24 |
| Software and Algorithms | ||
| SeqArray v1.12.9 | Zheng et al., 2017 | http://github.com/zhengxwen/SeqArray |
| R v3.4.0 | Team., 2017 | https://www.r-project.org/ |
| GATK v3.5 | De Pristo et al., 2011 | https://software.broadinstitute.org/gatk/ |
| BWA MEM v0.7.5a | Li, 2013 | http://bio-bwa.sourceforge.net/ |
| Picard v1.56 | NA | http://broadinstitute.github.io/picard/ |
Article Highlights.
Single cell sequencing protocol suited for low parasitaemia malaria infections
Single genomes from recurrent P. vivax infections capture intrahost relatedness
Putative de novo mutations identify recurrent mutation in the ApiAP2 gene family
Reanalysis of P. falciparum single cell data identifies convergent signals of mutation
ACKNOWLEDGEMENTS
We thanks all the participants in this study, Standwell Nkhoma assistance with P. falciparum analysis, and Richard Pearson, Sarah Auburn and MalariaGEN for access to genome sequencing data for P. vivax populations in Thailand. This study was supported by the NIH grants NIAID AI110941–01A1 to IHC and NIAID R37 AI048071 to TJCA. The Shoklo Malaria Research Unit is part of the Mahidol Oxford Tropical Network supported by the Wellcome Trust of Great Britain
Footnotes
Publisher's Disclaimer: This is a PDF file of an unedited manuscript that has been accepted for publication. As a service to our customers we are providing this early version of the manuscript. The manuscript will undergo copyediting, typesetting, and review of the resulting proof before it is published in its final form. Please note that during the production process errors may be discovered which could affect the content, and all legal disclaimers that apply to the journal pertain.
DECLARATION OF INTERESTS
The authors declare no competing interests.
References
- Ariey F, Witkowski B, Amaratunga C, Beghain J, Langlois AC, Khim N, Kim S, Duru V, Bouchier C, Ma L, et al. (2014). A molecular marker of artemisinin-resistant Plasmodium falciparum malaria. Nature 505, 50–55. [DOI] [PMC free article] [PubMed] [Google Scholar]
- Auburn S, Benavente ED, Miotto O, Pearson RD, Amato R, Grigg MJ, Barber BE, William T, Handayuni I, Marfurt J, et al. (2018). Genomic analysis of a pre-elimination Malaysian Plasmodium vivax population reveals selective pressures and changing transmission dynamics. Nat Commun 9, 2585. [DOI] [PMC free article] [PubMed] [Google Scholar]
- Auburn S, Getachew S, Pearson RD, Amato R, Miotto O, Trimarsanto H, Zhu SJ, Rumaseb A, Marfurt J, Noviyanti R, et al. (2019). Genomic analysis of Plasmodium vivax in southern Ethiopia reveals selective pressures in multiple parasite mechanisms. J Infect Dis [DOI] [PMC free article] [PubMed] [Google Scholar]
- Bahl A, Brunk B, Coppel RL, Crabtree J, Diskin SJ, Fraunholz MJ, Grant GR, Gupta D, Huestis RL, Kissinger JC, et al. (2002). PlasmoDB: the Plasmodium genome resource. An integrated database providing tools for accessing, analyzing and mapping expression and sequence data (both finished and unfinished). Nucleic Acids Res 30, 87–90. [DOI] [PMC free article] [PubMed] [Google Scholar]
- Bahl A, Brunk B, Crabtree J, Fraunholz MJ, Gajria B, Grant GR, Ginsburg H, Gupta D, Kissinger JC, Labo P, et al. (2003). PlasmoDB: the Plasmodium genome resource. A database integrating experimental and computational data. Nucleic Acids Res 31, 212–215. [DOI] [PMC free article] [PubMed] [Google Scholar]
- Battle KE, Lucas TCD, Nguyen M, Howes RE, Nandi AK, Twohig KA, Pfeffer DA, Cameron E, Rao PC, Casey D, et al. (2019). Mapping the global endemicity and clinical burden of Plasmodium vivax, 2000–17: a spatial and temporal modelling study. Lancet 394, 332–343. [DOI] [PMC free article] [PubMed] [Google Scholar]
- Bohrson CL, Barton AR, Lodato MA, Rodin RE, Luquette LJ, Viswanadham VV, Gulhan DC, Cortes-Ciriano I, Sherman MA, Kwon M, et al. (2019). Linked-read analysis identifies mutations in single-cell DNA-sequencing data. Nat Genet 51, 749–754. [DOI] [PMC free article] [PubMed] [Google Scholar]
- Bopp SE, Manary MJ, Bright AT, Johnston GL, Dharia NV, Luna FL, McCormack S, Plouffe D, McNamara CW, Walker JR, et al. (2013). Mitotic evolution of Plasmodium falciparum shows a stable core genome but recombination in antigen families. PLoS Genet 9, e1003293. [DOI] [PMC free article] [PubMed] [Google Scholar]
- Bousema T, Okell L, Felger I, and Drakeley C (2014). Asymptomatic malaria infections: detectability, transmissibility and public health relevance. Nat Rev Microbiol 12, 833–840. [DOI] [PubMed] [Google Scholar]
- Bright AT, Manary MJ, Tewhey R, Arango EM, Wang T, Schork NJ, Yanow SK, and Winzeler EA (2014). A high resolution case study of a patient with recurrent Plasmodium vivax infections shows that relapses were caused by meiotic siblings. PLoS Negl Trop Dis 8, e2882. [DOI] [PMC free article] [PubMed] [Google Scholar]
- Broman KW (2005). The genomes of recombinant inbred lines. Genetics 169, 1133–1146. [DOI] [PMC free article] [PubMed] [Google Scholar]
- Browning SR, and Browning BL (2012). Identity by descent between distant relatives: detection and applications. Annu Rev Genet 46, 617–633. [DOI] [PubMed] [Google Scholar]
- Chu CS, Phyo AP, Lwin KM, Win HH, San T, Aung AA, Raksapraidee R, Carrara VI, Bancone G, Watson J, et al. (2018). Comparison of the Cumulative Efficacy and Safety of Chloroquine, Artesunate, and Chloroquine-Primaquine in Plasmodium vivax Malaria. Clin Infect Dis 67, 1543–1549. [DOI] [PMC free article] [PubMed] [Google Scholar]
- Claessens A, Hamilton WL, Kekre M, Otto TD, Faizullabhoy A, Rayner JC, and Kwiatkowski D (2014). Generation of antigenic diversity in Plasmodium falciparum by structured rearrangement of Var genes during mitosis. PLoS Genet 10, e1004812. [DOI] [PMC free article] [PubMed] [Google Scholar]
- Cowell AN, Istvan ES, Lukens AK, Gomez-Lorenzo MG, Vanaerschot M, Sakata-Kato T, Flannery EL, Magistrado P, Owen E, Abraham M, et al. (2018). Mapping the malaria parasite druggable genome by using in vitro evolution and chemogenomics. Science 359, 191–199. [DOI] [PMC free article] [PubMed] [Google Scholar]
- DePristo MA, Banks E, Poplin R, Garimella KV, Maguire JR, Hartl C, Philippakis AA, del Angel G, Rivas MA, Hanna M, et al. (2011). A framework for variation discovery and genotyping using next-generation DNA sequencing data. Nat Genet 43, 491–498. [DOI] [PMC free article] [PubMed] [Google Scholar]
- Dharia NV, Bright AT, Westenberger SJ, Barnes SW, Batalov S, Kuhen K, Borboa R, Federe GC, McClean CM, Vinetz JM, et al. (2010). Whole-genome sequencing and microarray analysis of ex vivo Plasmodium vivax reveal selective pressure on putative drug resistance genes. Proc Natl Acad Sci U S A 107, 20045–20050. [DOI] [PMC free article] [PubMed] [Google Scholar]
- Dong X, Zhang L, Milholland B, Lee M, Maslov AY, Wang T, and Vijg J (2017). Accurate identification of single-nucleotide variants in whole-genome-amplified single cells. Nat Methods 14, 491–493. [DOI] [PMC free article] [PubMed] [Google Scholar]
- Feder AF, Kline C, Polacino P, Cottrell M, Kashuba ADM, Keele BF, Hu SL, Petrov DA, Pennings PS, and Ambrose Z (2017). A spatio-temporal assessment of simian/human immunodeficiency virus (SHIV) evolution reveals a highly dynamic process within the host. PLoS Pathog 13, e1006358. [DOI] [PMC free article] [PubMed] [Google Scholar]
- Fogle CA, Nagle JL, and Desai MM (2008). Clonal interference, multiple mutations and adaptation in large asexual populations. Genetics 180, 2163–2173. [DOI] [PMC free article] [PubMed] [Google Scholar]
- Fraunholz MJ, and Roos DS (2003). PlasmoDB: exploring genomics and post-genomics data of the malaria parasite, Plasmodium falciparum. Redox Rep 8, 317–320. [DOI] [PubMed] [Google Scholar]
- Gatt YE, and Margalit H (2020). Common adaptive strategies underlie within-host evolution of bacterial pathogens. Mol Biol Evol [DOI] [PMC free article] [PubMed] [Google Scholar]
- Howick VM, Russell AJC, Andrews T, Heaton H, Reid AJ, Natarajan K, Butungi H, Metcalf T, Verzier LH, Rayner JC, et al. (2019). The Malaria Cell Atlas: Single parasite transcriptomes across the complete Plasmodium life cycle. Science 365. [DOI] [PMC free article] [PubMed] [Google Scholar]
- Huff CD, Witherspoon DJ, Simonson TS, Xing J, Watkins WS, Zhang Y, Tuohy TM, Neklason DW, Burt RW, Guthery SL, et al. (2011). Maximum-likelihood estimation of recent shared ancestry (ERSA). Genome Res 21, 768–774. [DOI] [PMC free article] [PubMed] [Google Scholar]
- Imwong M, Snounou G, Pukrittayakamee S, Tanomsing N, Kim JR, Nandy A, Guthmann JP, Nosten F, Carlton J, Looareesuwan S, et al. (2007). Relapses of Plasmodium vivax infection usually result from activation of heterologous hypnozoites. J Infect Dis 195, 927–933. [DOI] [PubMed] [Google Scholar]
- Jett C, Dia A, and Cheeseman IH (2020). Rapid emergence of clonal interference during malaria parasite cultivation. bioRxiv [Google Scholar]
- Kim C, Gao R, Sei E, Brandt R, Hartman J, Hatschek T, Crosetto N, Foukakis T, and Navin NE (2018). Chemoresistance Evolution in Triple-Negative Breast Cancer Delineated by Single-Cell Sequencing. Cell 173, 879–893 e813. [DOI] [PMC free article] [PubMed] [Google Scholar]
- Li HJa.p.a. (2013). Aligning sequence reads, clone sequences and assembly contigs with BWA-MEM
- Li L, Stoeckert CJ Jr., and Roos DS (2003). OrthoMCL: identification of ortholog groups for eukaryotic genomes. Genome Res 13, 2178–2189. [DOI] [PMC free article] [PubMed] [Google Scholar]
- Lieberman TD, Flett KB, Yelin I, Martin TR, McAdam AJ, Priebe GP, and Kishony R (2014). Genetic variation of a bacterial pathogen within individuals with cystic fibrosis provides a record of selective pressures. Nat Genet 46, 82–87. [DOI] [PMC free article] [PubMed] [Google Scholar]
- Lieberman TD, Michel JB, Aingaran M, Potter-Bynoe G, Roux D, Davis MR Jr., Skurnik D, Leiby N, LiPuma JJ, Goldberg JB, et al. (2011). Parallel bacterial evolution within multiple patients identifies candidate pathogenicity genes. Nat Genet 43, 1275–1280. [DOI] [PMC free article] [PubMed] [Google Scholar]
- Lieberman TD, Wilson D, Misra R, Xiong LL, Moodley P, Cohen T, and Kishony R (2016). Genomic diversity in autopsy samples reveals within-host dissemination of HIV-associated Mycobacterium tuberculosis. Nat Med 22, 1470–1474. [DOI] [PMC free article] [PubMed] [Google Scholar]
- Lin JT, Hathaway NJ, Saunders DL, Lon C, Balasubramanian S, Kharabora O, Gosi P, Sriwichai S, Kartchner L, Chuor CM, et al. (2015). Using Amplicon Deep Sequencing to Detect Genetic Signatures of Plasmodium vivax Relapse. J Infect Dis 212, 999–1008. [DOI] [PMC free article] [PubMed] [Google Scholar]
- Lodato MA, Rodin RE, Bohrson CL, Coulter ME, Barton AR, Kwon M, Sherman MA, Vitzthum CM, Luquette LJ, Yandava CN, et al. (2018). Aging and neurodegeneration are associated with increased mutations in single human neurons. Science 359, 555–559. [DOI] [PMC free article] [PubMed] [Google Scholar]
- Lodato MA, Woodworth MB, Lee S, Evrony GD, Mehta BK, Karger A, Lee S, Chittenden TW, D’Gama AM, Cai X, et al. (2015). Somatic mutation in single human neurons tracks developmental and transcriptional history. Science 350, 94–98. [DOI] [PMC free article] [PubMed] [Google Scholar]
- Martincorena I, Fowler JC, Wabik A, Lawson ARJ, Abascal F, Hall MWJ, Cagan A, Murai K, Mahbubani K, Stratton MR, et al. (2018). Somatic mutant clones colonize the human esophagus with age. Science 362, 911–917. [DOI] [PMC free article] [PubMed] [Google Scholar]
- Martincorena I, Raine KM, Gerstung M, Dawson KJ, Haase K, Van Loo P, Davies H, Stratton MR, and Campbell PJ (2017). Universal Patterns of Selection in Cancer and Somatic Tissues. Cell 171, 1029–1041 e1021. [DOI] [PMC free article] [PubMed] [Google Scholar]
- McDew-White M, Li X, Nkhoma SC, Nair S, Cheeseman I, and Anderson TJC (2019). Mode and Tempo of Microsatellite Length Change in a Malaria Parasite Mutation Accumulation Experiment. Genome Biol Evol 11, 1971–1985. [DOI] [PMC free article] [PubMed] [Google Scholar]
- Miles A, Iqbal Z, Vauterin P, Pearson R, Campino S, Theron M, Gould K, Mead D, Drury E, O’Brien J, et al. (2016). Indels, structural variation, and recombination drive genomic diversity in Plasmodium falciparum. Genome Res 26, 1288–1299. [DOI] [PMC free article] [PubMed] [Google Scholar]
- Nair S, Nkhoma SC, Serre D, Zimmerman PA, Gorena K, Daniel BJ, Nosten F, Anderson TJ, and Cheeseman IH (2014). Single-cell genomics for dissection of complex malaria infections. Genome Res 24, 1028–1038. [DOI] [PMC free article] [PubMed] [Google Scholar]
- Navin N, Kendall J, Troge J, Andrews P, Rodgers L, McIndoo J, Cook K, Stepansky A, Levy D, Esposito D, et al. (2011). Tumour evolution inferred by single-cell sequencing. Nature 472, 90–94. [DOI] [PMC free article] [PubMed] [Google Scholar]
- Nkhoma SC, Trevino SG, Gorena KM, Nair S, Khoswe S, Jett C, Garcia R, Daniel B, Dia A, Terlouw DJ, et al. (2020). Co-transmission of Related Malaria Parasite Lineages Shapes Within-Host Parasite Diversity. Cell Host Microbe 27, 93–103 e104. [DOI] [PMC free article] [PubMed] [Google Scholar]
- Park C, Qian W, and Zhang J (2012). Genomic evidence for elevated mutation rates in highly expressed genes. EMBO Rep 13, 1123–1129. [DOI] [PMC free article] [PubMed] [Google Scholar]
- Parobek CM, Lin JT, Saunders DL, Barnett EJ, Lon C, Lanteri CA, Balasubramanian S, Brazeau N, DeConti DK, Garba DL, et al. (2016). Selective sweep suggests transcriptional regulation may underlie Plasmodium vivax resilience to malaria control measures in Cambodia. Proc Natl Acad Sci U S A 113, E8096–E8105. [DOI] [PMC free article] [PubMed] [Google Scholar]
- Pearson RD, Amato R, Auburn S, Miotto O, Almagro-Garcia J, Amaratunga C, Suon S, Mao S, Noviyanti R, Trimarsanto H, et al. (2016). Genomic analysis of local variation and recent evolution in Plasmodium vivax. Nat Genet 48, 959–964. [DOI] [PMC free article] [PubMed] [Google Scholar]
- Popovici J, Friedrich LR, Kim S, Bin S, Run V, Lek D, Cannon MV, Menard D, and Serre D (2018). Genomic Analyses Reveal the Common Occurrence and Complexity of Plasmodium vivax Relapses in Cambodia. mBio 9. [DOI] [PMC free article] [PubMed] [Google Scholar]
- Real E, Howick VM, Dahalan FA, Witmer K, Cudini J, Andradi-Brown C, Blight J, Davidson MS, Dogga SK, Reid AJ, et al. (2021). A single-cell atlas of Plasmodium falciparum transmission through the mosquito. Nat Commun 12, 3196. [DOI] [PMC free article] [PubMed] [Google Scholar]
- Ribaut C, Berry A, Chevalley S, Reybier K, Morlais I, Parzy D, Nepveu F, Benoit-Vical F, and Valentin A (2008). Concentration and purification by magnetic separation of the erythrocytic stages of all human Plasmodium species. Malar J 7, 45. [DOI] [PMC free article] [PubMed] [Google Scholar]
- Schaffner SF, Taylor AR, Wong W, Wirth DF, and Neafsey DE (2018). hmmIBD: software to infer pairwise identity by descent between haploid genotypes. Malar J 17, 196. [DOI] [PMC free article] [PubMed] [Google Scholar]
- Sharrock WW, Suwanarusk R, Lek-Uthai U, Edstein MD, Kosaisavee V, Travers T, Jaidee A, Sriprawat K, Price RN, Nosten F, et al. (2008). Plasmodium vivax trophozoites insensitive to chloroquine. Malar J 7, 94. [DOI] [PMC free article] [PubMed] [Google Scholar]
- Taylor AR, Watson JA, Chu CS, Puaprasert K, Duanguppama J, Day NPJ, Nosten F, Neafsey DE, Buckee CO, Imwong M, et al. (2019). Resolving the cause of recurrent Plasmodium vivax malaria probabilistically. Nat Commun 10, 5595. [DOI] [PMC free article] [PubMed] [Google Scholar]
- Team, R.C. (2017). R: A Language and Environment for Statistical Computing
- Thanapongpichat S, McGready R, Luxemburger C, Day NP, White NJ, Nosten F, Snounou G, and Imwong M (2013). Microsatellite genotyping of Plasmodium vivax infections and their relapses in pregnant and non-pregnant patients on the Thai-Myanmar border. Malar J 12, 275. [DOI] [PMC free article] [PubMed] [Google Scholar]
- Theys K, Feder AF, Gelbart M, Hartl M, Stern A, and Pennings PS (2018). Within-patient mutation frequencies reveal fitness costs of CpG dinucleotides and drastic amino acid changes in HIV. PLoS Genet 14, e1007420. [DOI] [PMC free article] [PubMed] [Google Scholar]
- Trevino SG, Nkhoma SC, Nair S, Daniel BJ, Moncada K, Khoswe S, Banda RL, Nosten F, and Cheeseman IH (2017). High-Resolution Single-Cell Sequencing of Malaria Parasites. Genome Biol Evol 9, 3373–3383. [DOI] [PMC free article] [PubMed] [Google Scholar]
- Volkman SK, Neafsey DE, Schaffner SF, Park DJ, and Wirth DF (2012). Harnessing genomics and genome biology to understand malaria biology. Nat Rev Genet 13, 315–328. [DOI] [PubMed] [Google Scholar]
- Voorberg-van der Wel A, Roma G, Gupta DK, Schuierer S, Nigsch F, Carbone W, Zeeman AM, Lee BH, Hofman SO, Faber BW, et al. (2017). A comparative transcriptomic analysis of replicating and dormant liver stages of the relapsing malaria parasite Plasmodium cynomolgi. Elife 6. [DOI] [PMC free article] [PubMed] [Google Scholar]
- Wang Y, Waters J, Leung ML, Unruh A, Roh W, Shi X, Chen K, Scheet P, Vattathil S, Liang H, et al. (2014). Clonal evolution in breast cancer revealed by single nucleus genome sequencing. Nature 512, 155–160. [DOI] [PMC free article] [PubMed] [Google Scholar]
- Zhang M, Wang C, Otto TD, Oberstaller J, Liao X, Adapa SR, Udenze K, Bronner IF, Casandra D, Mayho M, et al. (2018). Uncovering the essential genes of the human malaria parasite Plasmodium falciparum by saturation mutagenesis. Science 360. [DOI] [PMC free article] [PubMed] [Google Scholar]
- Zheng X, Gogarten SM, Lawrence M, Stilp A, Conomos MP, Weir BS, Laurie C, and Levine D (2017). SeqArray-a storage-efficient high-performance data format for WGS variant calls. Bioinformatics 33, 2251–2257. [DOI] [PMC free article] [PubMed] [Google Scholar]
- Zhu SJ, Hendry JA, Almagro-Garcia J, Pearson RD, Amato R, Miles A, Weiss DJ, Lucas TC, Nguyen M, Gething PW, et al. (2019). The origins and relatedness structure of mixed infections vary with local prevalence of P. falciparum malaria. Elife 8. [DOI] [PMC free article] [PubMed] [Google Scholar]
Associated Data
This section collects any data citations, data availability statements, or supplementary materials included in this article.
Supplementary Materials
Data Availability Statement
This study did not generate any original code
Raw sequencing data have been submitted to the NCBI Short Read Archive under the accession PRJNN738867
Any additional information required to reanalyze the data reported in this paper is available from the Lead Contact upon request.