

Abstract
Nonplatinum metal (NPM) catalysts for the oxygen reduction reaction (ORR) in proton exchange membrane fuel cells (PEMFCs) have been developed; however, NPM catalysts still need to be improved in terms of both their catalytic activity and durability. To overcome these problems, an Fe active site contained within a more compact ligand than conventional, porphyrinic, 16-membered ring ligands, or more specifically, a hexaaza macrocyclic ligand with a 14-membered ring (14MR), was developed. In this study, the durability of the Fe-14MR complex was compared to that of Fe phthalocyanine (FePc), which has a 16-membered ring ligand, using in situ X-ray absorption spectroscopy; demetalation of the Fe complexes was directly observed during electrochemical experiments performed under acidic ORR conditions. It was found that Fe-14MR is significantly more resistant to demetalation than FePc during the ORR.
Keywords: Fuel cell, ORR, nonplatinum, Fe complex, durability, in situ XAS
Introduction
The development of nonplatinum metal (NPM) oxygen reduction reaction (ORR) catalysts with high activities and durabilities in proton exchange membrane fuel cells (PEMFCs) is challenging, as NPM catalysts are easily corroded in the acidic environment of PEMFCs.1−3 Iron catalysts prepared by pyrolyzing iron, carbon, and nitrogen (Fe–N–C) precursor mixtures have been found to have relatively high activities and durabilities during the ORR in acidic media; however, their performance remains inferior to that of Pt-based catalysts.4−9 To understand and enhance the catalytic performance of Fe–N–C catalysts, the active structures of Fe–N–C catalysts have been investigated by many research groups.2,3,6,10−13 As a result, single Fe sites embedded in nitrogen-doped carbon materials, or more specifically, FeN4 sites, have been proposed as ORR active sites.6,12,13 However, the FeN4 sites in nonpyrolyzed Fe precursors or complexes, e.g., Fe phthalocyanine (FePc) and Fe porphyrin, are not stable under acidic ORR conditions due to demetalation triggered by the ORR.14,15 If highly stable and active Fe macrocyclic complexes are prepared, new types of durable NPM catalysts can be developed by modifying the ligands of the catalyst to tune the electronic structure of the Fe centers and building them up into catalysts with three-dimensional architectures.
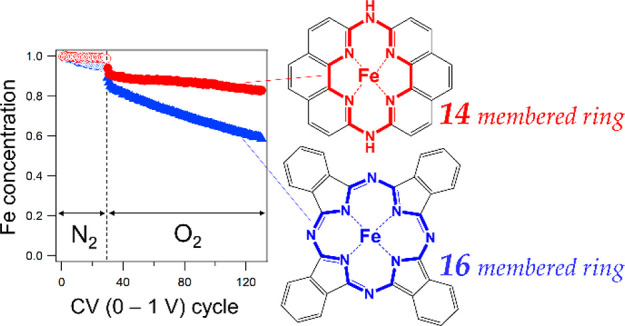
The structure performance of Fe–N–C catalysts during the ORR is of great interest, as it has been revealed that Fe–N–C catalysts contain two types of FeN4 active sites embedded in graphene structures, which show different catalytic activities and durabilities during the ORR.2,3,10,11,13 The porphyrinic FeN4 active site is surrounded by a 16-membered ring (the so-called S1 site) and is highly active but shows poor durability during the ORR under acidic conditions. The more compact FeN4 active site is surrounded by a 14-membered ring (the so-called S2 site) and less active than the S1 site but has a much higher durability.2,3 In addition, the previous studies on FePc and Fe porphyrins have suggested that Fe–N distance can tune their stability.16 Therefore, one may consider that FeN4 structures with compact moieties, more specifically, short Fe–N bonds, are desirable for new Fe–N–C catalysts.17,18 In fact, our research group has recently developed an Fe complex with a 14-membered hexaaza macrocyclic ligand (Fe(II) 1,14:7,8-ditethenotetrapyrido-[2,1,6-de:2′,1′6′-gh:2″,1″,6″-kl:2‴,1‴,6‴-na][1,3,5,8,10,12]hexaazacyclotetradecine, referred to as Fe-14MR), as shown in Figure 1.17 The number of N atoms in Fe-14MR is the same as that of FePc, but the numbers of all atoms surrounding the Fe centers are smaller than FePc. In fact, a previous study demonstrated that Fe-14MR has a shorter Fe–N bond length (1.9 Å) than Fe porphyrin (2.0 Å).17 Furthermore, Fe-14MR exhibits better ORR activity than FePc under both acidic and basic electrolyte conditions.17 It is assumed that the superior catalytic activity of Fe-14MR is attributed to the strong coordination of the compact macrocyclic ligand. One may expect that the compact ligand also has the advantage of stability, as it strongly holds the Fe center; however, the stability of Fe-14MR has not yet been studied.
Figure 1.

(a) The Fe-14MR complex used in this study, which has a 14-membered hexaaza macrocyclic ring. (b) FePc with a 16-membered ring, which was used as a reference catalyst. The numbers of the rings, 14 and 16, indicate the numbers of atoms surrounding the Fe centers.
As such, we are interested in fully investigating the stability of Fe-14MR under electrochemical conditions. According to the literature, one of the main reasons for the degradation of FeN4 active sites in pyrolyzed Fe–N–C catalysts is demetalation during the ORR, which is caused by the protonation of basic N atoms and/or the degradation of carbon by reactive oxygen species.2,3,19−21 The kinetics of Fe demetalation at controlled potentials has been directly evaluated in a pyrolyzed Fe–N–C catalyst using in situ 57Fe Mössbauer spectroscopy, which revealed demetalation of 80–90% of the S1 site and almost no variation of the S2 site after 50 h of operation at 0.5 V in PEMFC single-cell tests.2,22 Real-time observations of demetalation in half-cell tests have been performed using in situ inductively coupled plasma mass spectrometry (ICP-MS); in this method, electrolyte solutions containing dissolved metals from pyrolyzed Fe–N–C catalysts can be monitored during electrochemical measurements.20,23−25 However, ICP-MS does not provide information on the electronic state or local structure of Fe active sites. Meanwhile, in situ X-ray absorption spectroscopy (XAS) has been used to investigate structural variations in Fe–N–C catalysts and their redox during the ORR in electrolyte solutions and PEMFC single-cell tests.19,20,25−28 Although the in situ XAS technique has not been applied in the quantitative analysis of demetalation, it has the potential to record demetalation in real time by monitoring Fe signals, which depend on Fe concentration.
In the present study, we quantitatively analyzed the degradation of Fe-14MR under electrochemical conditions in real time by in situ XAS. Carbon-supported Fe-14MR (Fe-14MR/C) and FePc (FePc/C) were prepared, and their structures and demetalation behavior were evaluated to compare the durability of the Fe active site in a 14-membered ring to that in a 16-membered ring. The relationship between Fe–N bond length and catalyst durability is discussed to provide new insights into the development of durable macrocyclic complexes for the ORR under acidic conditions.
Results and Discussion
Fe-14MR was synthesized according to a previous report.17 Fe-14MR/C was prepared by impregnating an aqueous solution of Fe-14MR with carbon black (Ketjen EC600JD) at 85 °C. The amount of Fe in Fe-14MR/C was determined to be 0.6 wt % by electron probe microanalysis (EPMA). Furthermore, the electrochemically active Fe density was evaluated to be 19 μmol g–1 using a NO2– reduction method.29 As a reference catalyst, FePc/C was prepared by impregnating a H2SO4-based solution of FePc with carbon, as reported in the literature.27,28 The amount of Fe and the electrochemically active Fe density in FePc/C were determined to be 0.7 wt % and 9 μmol g–1 by EPMA and a NO2– reduction method, respectively. The Fe amounts and the electrochemically active Fe densities of the catalysts are summarized in Table 1.
Table 1. Fe Loadings and Electrochemically Active Fe Densities of Fe-14MR/C and FePc/C.
Determined by EPMA.
Determined by a NO2– reduction method.
The structure of Fe-14MR/C was analyzed by ex situ XAS. Figure 2(a) shows the Fe K-edge X-ray absorption near edge structure (XANES) spectra of Fe-14MR/C, Fe-14MR, and FePc/C. Fe-14MR/C exhibits spectral features that are slightly different than those of Fe-14MR. Specifically, the pre-edge peak for Fe-14MR/C is of higher intensity than the pre-edge peak for Fe-14MR. A pre-edge peak is also observed in the FePc/C spectrum. An increase in the pre-edge peak intensity indicates that the symmetry around the Fe species is distorted by Fe-14MR being loaded on carbon.30 Thus, one can consider that the axial ligands of Fe-14MR are changed by the adsorption of Fe-14MR on carbon. Figure 2(b) shows the Fourier transforms (FTs) of the Fe K-edge extended X-ray absorption fine structure (EXAFS) spectra of Fe-14MR/C, Fe-14MR, and FePc/C; peaks are observed at 1–2 Å (Figure S1: EXAFS oscillations). Table 2 presents the curve-fitting analysis results for the peaks observed at 1–2 Å. The Fe-14MR/C peak is fitted by a model comprising four Fe–N bonds with lengths of 1.90 Å and two Fe–O bonds with lengths of 2.12 Å. The R-factor suggests that the model is the most accurate. The Fe–N and Fe–O bond lengths are nearly identical to those of Fe-14MR and those determined previously by single-crystal analysis.17 For FePc/C, the peak at 1–2 Å is well-fitted by a model comprising four Fe–N bonds with lengths of 2.03 Å and one Fe–O bond with a length of 1.85 Å. Therefore, Fe-14MR/C has shorter Fe–N bonds than FePc/C. In other words, the Fe active sites within Fe-14MR/C have a smaller coordinated structure than those within FePc/C.
Figure 2.
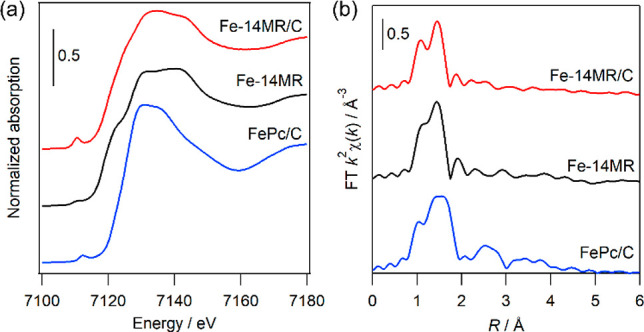
Fe K-edge (a) XANES and (b) FT EXAFS spectra of Fe-14MR/C, Fe-14MR, and FePc/C.
Table 2. EXAFS Curve-Fitting Results for Fe-14MR/C, Fe-14MR, and FePc/Ca.
| sample | atom | Nb | Rc/Å | σ2d/Å2 | E0e | R-factor |
|---|---|---|---|---|---|---|
| Fe-14MR/C | N | 4 | 1.90(4) | 0.005(2) | 7117(7) | 0.035 |
| O | 2 | 2.12(7) | 0.017(19) | |||
| Fe-14MR | N | 4 | 1.88(2) | 0.003(1) | 7116(4) | 0.016 |
| O | 2 | 2.14(4) | 0.014(9) | |||
| FePc/C | N | 4 | 2.03(2) | 0.004(1) | 7117(2) | 0.007 |
| O | 1 | 1.85(2) | 0.001(2) |
FT range: 3–14 Å–1, curve-fitting range: 1.0–2.0 Å.
Coordination number.
Atomic distance.
Debye–Waller factor.
Absorption edge energy.
Linear sweep voltammetry (LSV) was performed on Fe-14MR/C using a rotating disk electrode (RDE) at 2500 rpm in an O2-saturated, 0.5 M H2SO4 aqueous solution. To evaluate the durability of Fe-14MR/C, ORR curves were obtained before and after 50 potential sweep cycles between 1.0 and 0 V at 50 mV sec–1 in O2-saturated 0.5 M H2SO4. For comparison, the ORR performance of FePc/C was also determined under the same conditions as those for Fe-14MR/C. To compare the catalytic activity of Fe-14MR/C and FePc/C, their turnover frequencies (TOFs) were evaluated from the current at 0.75 V vs RHE (before 50 potential sweep cycles) and the Fe active site densities. As presented in Table 3, the TOF of Fe-14MR/C showed a significantly higher value than that of FePc/C. Therefore, the electrochemically active Fe site of Fe-14MR/C has higher catalytic activity for the ORR than that of FePc/C.
Table 3. TOFs of Fe-14MR/C and FePc/C for the ORR at 0.75 V vs RHEa.
| sample | TOF/e site–1 s–1 |
|---|---|
| Fe-14MR/C | 0.39 |
| FePc/C | 0.08 |
TOF = i/d/F, where i is the current per unit catalyst weight (A g–1) at 0.75 V vs RHE, d is the electrochemically active Fe density (mol g–1), and F is the Faraday constant (C mol–1).
For both catalysts, the ORR onset potential shifted to a lower potential after cycling (Figure 3), suggesting that the catalysts degraded during the ORR. However, the shift in the onset potential for Fe-14MR/C was much smaller than that for FePc/C, indicating that Fe-14MR/C is more stable than FePc/C during the ORR under acidic conditions. It is reasonable to consider that the high stability of Fe-14MR/C is derived from the active Fe species being highly resistant to demetalation in acidic media during the ORR.2,22,23,25 Meanwhile, previous works have suggested the low stability of Fe-14MR (without carbon support) for acidic ORR, which is different from the results of this study.17,18 The difference would be derived from the supported form of Fe-14MR/C, since in the previous studies, the stability of Fe-14MR was evaluated using a simply mixed catalyst of Fe-14MR and carbon black.
Figure 3.
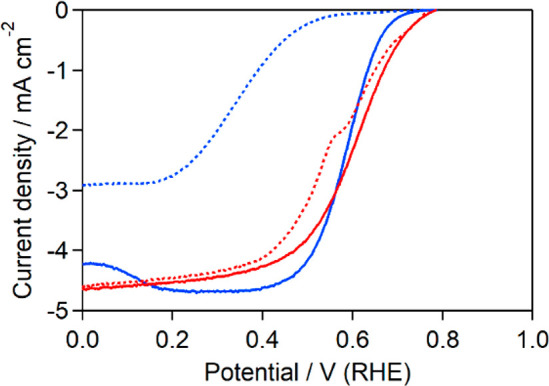
ORR LSV curves for Fe-14MR/C (red curve) and FePc/C (blue curve) before (solid curves) and after (dotted curves) 50 potential sweep cycles between 1.0 and 0 V. The RDE was rotated at 1600 rpm in O2-saturated 0.5 M H2SO4.
To determine the dissolution behavior of the Fe species in Fe-14MR/C, in situ XAS measurements were performed according to the procedure outlined in Table 4. First, the redox behavior of the Fe species was evaluated under N2 by cyclic voltammetry (CV, step 1), and XANES spectra were obtained with the cathode potential held at either 0.9 or 0.3 V vs RHE (steps 2 and 3, respectively). Then, the electrode Fe content during CV under N2 and O2 was determined from the X-ray fluorescence of the Fe species during synchrotron X-ray radiation (8214 eV) (steps 4 and 5, respectively). It should be noted that the reason for monitoring the X-ray fluorescence of Fe species under both N2 and O2 is to confirm that the ORR triggered demetalation.14,15 Changes in the redox behavior and structure of the catalyst after 155 potential cycles were evaluated by additional XAS measurements (steps 6 and 7) and CV under N2 (step 8). FePc/C was studied in the same manner for comparison.
Table 4. In Situ XAS Procedure during Electrochemical Measurements.
| step no. | measurement |
|---|---|
| 1 | CV under N2 |
| 2 | XANES at 0.9 V under N2 |
| 3 | XANES at 0.3 V under N2 |
| 4 | X-ray fluorescence monitoring during CV; 30 cycles under N2 |
| 5 | X-ray fluorescence monitoring during CV; 125 cycles under O2 |
| 6 | XANES at 0.9 V under N2 |
| 7 | XANES at 0.3 V under N2 |
| 8 | CV under N2 |
The CV results for Fe-14MR/C under N2 (step 1) are shown in Figure 4(a), and anodic and cathodic peaks are observed at 0.75 and 0.72 V, respectively. Figure 5(a) presents the XANES spectra of Fe-14MR/C obtained during steps 2 and 3 at 0.9 and 0.3 V, respectively; these potentials were higher and lower than the CV peaks, respectively. The features of the Fe-14MR/C spectrum changed with the applied potential. Specifically, the X-ray absorption edge shifted to a lower energy as the potential changed from 0.9 to 0.3 V. This edge shift indicates that Fe-14MR/C was reduced. Considering the previously reported relationship between edge energy and formal Fe valence,17 Fe in Fe-14MR/C was presumably reduced from Fe3+ to Fe2+ when the potential was swept from 0.9 to 0.3 V. Thus, the CV peaks in Figure 4(a) are considered to involve Fe3+/2+ redox. The XANES spectra of Fe-14MR/C after the CV cycles performed in steps 6 and 7 are also shown in Figure 5(a). The spectrum at each potential was similar to that obtained before the CV cycles performed in steps 2 and 3, confirming that the chemical structure surrounding the Fe centers was retained even after 155 potential cycles and Fe3+/2+ redox.
Figure 4.
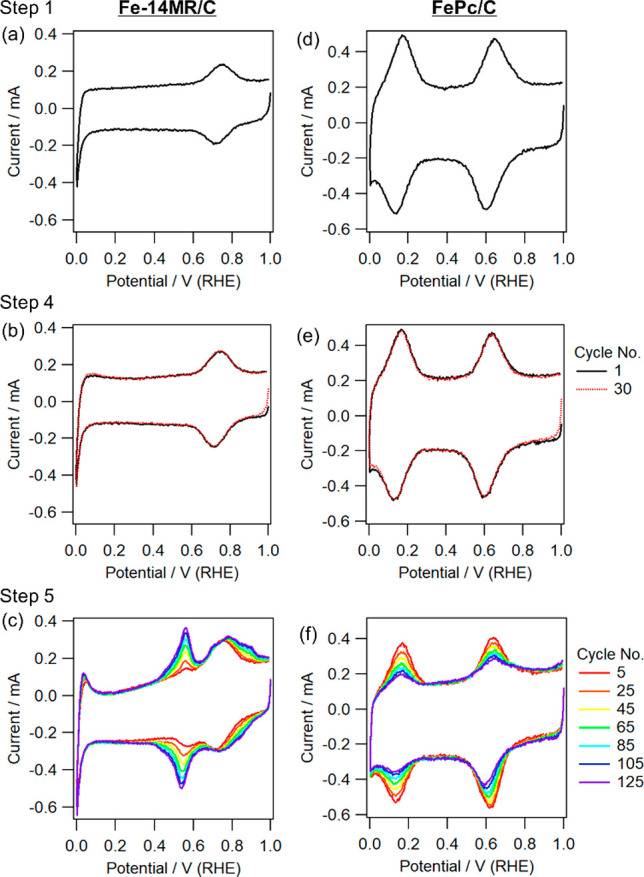
CV curves for Fe-14MR/C obtained by in situ XAS during (a) steps 1, (b) 4, and (c) 5, together with (d–f) those for FePc/C.
Figure 5.
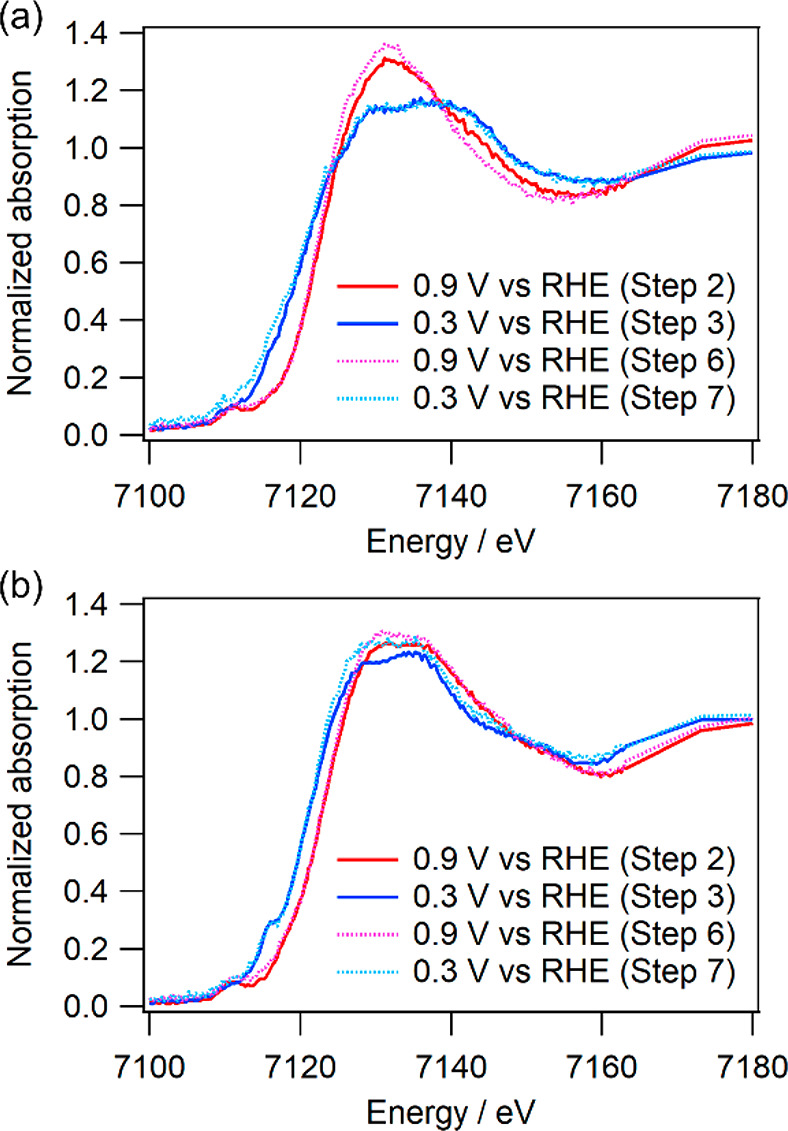
In situ Fe K-edge XANES spectra of (a) Fe-14MR/C and (b) FePc/C obtained at 0.9 V during step 2 (red solid curve) and step 6 (pink dotted curve) or at 0.3 V during step 3 (blue solid curve) and step 7 (light blue dotted curve).
Figure 4(b,c) show the CV curves obtained at steps 4 and 5. The features of the CV curve did not change during CV cycling under N2 (step 4). In contrast, the CV features clearly changed during CV cycling under O2 (step 5). The CV cycling caused an increase of peaks at 0.55 and 0.8–0.9 V, while the current at 0.75 V did not significantly change. Although the reason for the variation of the CV feature has not yet been revealed, it seems that demetalation of Fe is not the main cause of the variation of the CV feature, because the current at 0.75 V was almost constant during the CV cycles. It should also be noted that the XANES spectra obtained after the CV performed in steps 6 and 7 were slightly different from those obtained after steps 2 and 3, suggesting that the coordination environment around the Fe species slightly changed. Thus, the difference in the CV curves as well as that in the ORR curves (Figure 3) may be due to changes in the ligands such as variation of the amine groups to imine groups within Fe-14MR during the ORR. More importantly, the intensity of the CV peaks was not diminished after 125 cycles under O2, suggesting that Fe-14MR/C is resistant to Fe dissolution during the ORR.
For comparison, the CV curves for FePc/C obtained at steps 1, 4, and 5 are presented in Figure 4(d–f). In addition, the XANES spectra of FePc/C before and after CV cycling are shown in Figure 5(b). The XANES spectra change due to the redox of FePc/C; the absorption edge energy shifts due to Fe3+ transforming into Fe2+. This result is consistent with those of a previous report on FePc/C.27,28 The change in the FePc/C spectra is similar to that observed in the Fe-14MR/C spectra. However, trends in the CV curves for FePc/C are different from those in the CV curves for Fe-14MR/C. The intensity of the CV peaks for the FePc/C decrease with increasing CV cycle number, especially under O2 (Figure 4(f)). This suggests that FePc/C is vulnerable to the dissolution of Fe species during the ORR.
To evaluate the demetalation of the catalysts during the ORR, changes in the amount of Fe in the catalysts during CV cycling under N2 and O2 (steps 4 and 5) were investigated; Fe-derived X-ray fluorescence was monitored under X-ray irradiation at 8214 eV. The Fe-derived X-ray fluorescence of the catalysts was determined by subtracting the X-ray fluorescence of a blank in situ XAS cell without the catalysts from the X-ray fluorescence of XAS cells with the catalysts. Then, relative changes in the Fe concentration of the catalysts were evaluated. Figure 6 shows the relative decrease in Fe concentration observed for Fe-14MR/C and FePc/C during the CV cycles performed in steps 4 and 5. The relative concentration of Fe in Fe-14MR/C was nearly unchanged under N2 but decreased under O2 with repeated cycling. This result indicates that leaching of Fe species into the electrolyte solution is faster under O2. Thus, the demetalation of Fe species is considered to be caused by activated oxygen species formed during the ORR.2,14,15,20,31 More importantly, the relative concentration of Fe decreased less and more slowly in Fe-14MR/C than in FePc/C. The smaller decrease was confirmed by the raw XANES spectra before absorption normalization (Figure S2). Therefore, Fe-14MR/C is more stable than FePc/C with respect to the leaching of Fe species during the ORR. The high stability of Fe-14MR/C accounts for its highly durable ORR performance (Figure 3). It should also be noted that the decreased ratio of Fe content in Figure 6 is not consistent with that of ORR activity in Figure 3. More specifically, the ORR activity of FePc/C was almost completely diminished after only the 50 CV cycles, but about 50% of Fe content was remained on FePc/C even after the 125 CV cycles. In other words, the Fe content should be much smaller if all Fe species detected in the in situ XAS experiment had been active for the ORR. The results suggest that some of Fe species exist as inactive species on an electrode after the CV cycles. There are two possible structures of ORR-inactive Fe species: Fe oxide nanoparticles and bulk Fe species in a stack or crystalline of Fe complexes. If the Fe oxide nanoparticles had been formed as the main deactivated species, the XANES spectral feature would have largely changed after the CV cycles. But the actual change in XANES spectra of the Fe complexes is slight, suggesting that the Fe species in the inside of a stack or crystal are the main inactive Fe species remaining after the CV cycles. As described above, the amount of exposed Fe active species in Fe-14MR/C is about twice as large as that in FePc/C at almost the same Fe content (Table 1). This means that the difference in the stability between Fe-14MR/C and FePc/C is more than that observed in Figure 6. In other words, the stability of Fe-14MR/C is significantly superior to that of FePc/C. It is reasonable to consider that the shorter Fe–N bond length in Fe-14MR, with respect to the Fe–N bond lengths in conventional Fe complexes with 16-membered rings, is key to the stability of the Fe species in Fe-14MR during the ORR.
Figure 6.
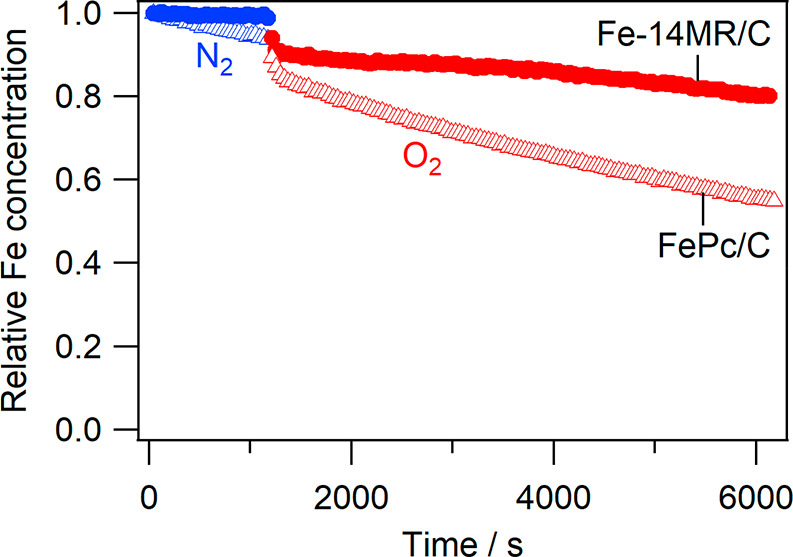
Changes in the relative concentration of Fe in Fe-14MR/C (●) and FePc/C (Δ) during CV cycling under N2 (step 4) (blue) and O2 (step 5) (red).
Conclusions
The structural effect of the FeN4 moiety on durability under acidic ORR conditions was investigated by comparing Fe-14MR/C and FePc/C. Structural analysis using EPMA and XAS confirmed that Fe-14MR/C and FePc/C contain a similar amount of Fe species, but Fe-14MR/C has a shorter Fe–N bond length. An electrochemical ORR study indicated that Fe-14MR/C is more durable than FePc/C. In situ XAS analysis demonstrated that the demetalation of Fe-14MR/C is accelerated under O2, and more importantly, Fe-14MR/C is more resistant to demetalation during the ORR than FePc/C. Therefore, it is revealed that 14-membered ring ligands can improve the durability of Fe catalysts during the ORR by improving the resistance of these catalysts to Fe leaching in acidic media. The results of this study are consistent with the structure–property relationships observed in Fe–N–C catalysts. More importantly, the results suggest that compact Fe complexes with 14-membered ring ligands can be used for the ORR under acidic conditions without pyrolysis, whereas conventional Fe complexes with 16-membered rings cannot be used because of their poor stability. Therefore, a new and more rational NPM catalyst design may be developed by preparing 14-membered Fe complexes with three-dimensional architectures or loading them onto catalytic supports with high surface areas. Further studies will be performed to modify the ligand structure and tune the catalytic activity and stability of these promising Fe complexes.
Methods
Catalyst Preparation
Fe-14MR was synthesized according to a previous study.17 Fe-14MR/C was prepared by impregnating an aqueous solution (200 mL) of Fe-14MR (101 mg) (yellow-blue in color) with Ketjen black (500 mg) at 85 °C. After stirring for 2 h, the suspension was filtered; then, the solid was washed with water (100 mL) and dried overnight at 120 °C to obtain Fe-14MR/C. FePc/C was prepared according to the literature.27,28 FePc (20 mg) was dissolved in H2SO4; Ketjen black (49 mg) was then added. The suspension was stirred for 1 h at room temperature, diluted with water (200 mL) in an ice bath, and then filtered. The suspension was washed with water until the pH of the filtrate was 6–7; the residue was dried overnight at 110 °C to obtain FePc/C.
Catalyst Characterization
The amount of Fe in Fe-14MR/C and FePc/C was determined using an electron probe microanalyser (JXA-8100, JEOL) with a wavelength dispersive spectrometer; an LIFH crystal was used to detect Fe. EPMA samples were prepared by pelletizing catalyst powders; no binder was used. Electrochemically active Fe density was evaluated using a NO2– reduction method.29 In this method, NO2– was coordinated to Fe active sites by immersing Fe14MR/C in a NaNO2 aqueous solution and then reduced by sweeping potential from 0.4 to −0.3 V vs RHE, where cathodic current was obtained by reductive stripping of NO on the Fe active sites. From the cathodic current, the amount of electrochemically active Fe species was determined.
XAFS measurements were performed at the BL5S1 beamline at the Aichi Synchrotron Radiation Center in Japan. The spectra were obtained in transmission mode. The spectral analysis was performed using Athena and Artemis software included in the Demeter package.
ORR Activity Tests
ORR durability tests were performed using a Nikko Keisoku RDE-1 system with an HZ-7000 bipotentiostat (Hokuto Denko). A catalyst ink was prepared by dispersing the catalyst powder (5 mg) in a solution containing water (150 μL), ethanol (150 μL), and Nafion DE521 (Sigma-Aldrich, 50 μL). The prepared ink (4 μL) was coated on the glassy carbon disk (0.283 cm2) of a rotating ring-disk electrode (RRDE) to a final loading of 200 μgcat cm–2 (Figure S3). Linear sweep voltammograms (10 mV sec–1) were obtained at a rotation speed of 1600 rpm in a N2-saturated, 0.5 M H2SO4 aqueous solution and an O2-saturated solution. The current resulting from the ORR was determined by subtracting the current obtained under N2 from that obtained under O2. After the LSV measurements, 50 potential sweep cycles were carried out between 1.0 and 0 V at 50 mV sec–1 in the same O2-saturated, 0.5 M H2SO4 aqueous solution; these cycles were performed to accelerate degradation. After cycling, LSV was performed under O2 and N2.
In Situ XAS Measurements
A schematic diagram of the in situ XAS setup is presented in Figure S4.32 The catalyst ink was dispersed on a polished, glassy carbon plate; the ink formed a circle with a diameter of 0.5 cm, and the catalyst loading was 0.4 mgcat cm–2. The catalyst-coated plate acted as the working electrode. An RHE and a Pt counter electrode were placed in a glass cell filled with a 0.5 M H2SO4 aqueous solution. The electrolyte was saturated with N2 or O2 by bubbling the solution with each gas at a flow rate of 20 mL min–1 for 10 min. The electrodes were connected to an HZ-7000 potentiostat (Hokuto Denko Corp.). Fe K-edge X-ray absorption and X-ray fluorescence were measured by irradiating the catalyst on the carbon plate with synchrotron X-rays; the potential of the working electrode was controlled. X-ray fluorescence was monitored with a multielement, solid-state silicon drift detector (SSD). The Fe content was evaluated from the X-ray fluorescence at 8214 eV acquired for 40 s, which corresponds to the time for 1 cycle of CV. The in situ XAS experimental protocol is presented in Table 4. In situ XAS measurements were performed at the BL5S1 beamline at AichiSR. The spectra were analyzed using Athena software included in the Demeter package.
Acknowledgments
This study was financially supported by the New Energy and Industrial Technology Development Organization (NEDO). XAS measurements were obtained at the BL5S1 and BL11S2 beamlines at the Aichi Synchrotron Radiation Center in Japan (Proposal Nos. 201904003, 201905074, 202002021, and 202004072).
Supporting Information Available
The Supporting Information is available free of charge at https://pubs.acs.org/doi/10.1021/jacsau.1c00309.
EXAFS spectra, in situ XANES spectra, a schematic diagram of an in situ XAS cell, and a plot of the ORR current density against catalyst amount (PDF)
Author Contributions
The manuscript was written through contributions of all authors. All authors have given approval to the final version of the manuscript.
The authors declare no competing financial interest.
Supplementary Material
References
- Chen Z.; Higgins D.; Yu A.; Zhang L.; Zhang J. A review on non-precious metal electrocatalysts for PEM fuel cells. Energy Environ. Sci. 2011, 4, 3167–3192. 10.1039/c0ee00558d. [DOI] [Google Scholar]
- Li J.; Sougrati M. T.; Zitolo A.; Ablett J. M.; Oğuz I. C.; Mineva T.; Matanovic I.; Atanassov P.; Huang Y.; Zenyuk I.; Di Cicco A.; Kumar K.; Dubau L.; Maillard F.; Dražić G.; Jaouen F. Identification of durable and non-durable FeNx sites in Fe-N-C materials for proton exchange membrane fuel cells. Nat. Catal. 2021, 4, 10–19. 10.1038/s41929-020-00545-2. [DOI] [Google Scholar]
- Liu S.; Shi Q.; Wu G. Solving the activity-stability trade-off riddle. Nat. Catal. 2021, 4, 6–7. 10.1038/s41929-020-00567-w. [DOI] [Google Scholar]
- Banham D.; Kishimoto T.; Zhou Y.; Sato T.; Bai K.; Ozaki J.-i.; Imashiro Y.; Ye S. Critical advancements in achieving high power and stable nonprecious metal catalyst-based MEAs for real-world proton exchange membrane fuel cell applications. Sci. Adv. 2018, 4, eaar7180 10.1126/sciadv.aar7180. [DOI] [PMC free article] [PubMed] [Google Scholar]
- Nabae Y.; Nagata S.; Hayakawa T.; Niwa H.; Harada Y.; Oshima M.; Isoda A.; Matsunaga A.; Tanaka K.; Aoki T. Pt-free carbon-based fuel cell catalyst prepared from spherical polyimide for enhanced oxygen diffusion. Sci. Rep. 2016, 6, 23276. 10.1038/srep23276. [DOI] [PMC free article] [PubMed] [Google Scholar]
- Nabae Y.; Nagata S.; Kusaba K.; Aoki T.; Hayakawa T.; Tanida H.; Imai H.; Hori K.; Yamamoto Y.; Arai S.; Ohyama J. Magnetic purification of non-precious metal fuel cell catalysts for obtaining atomically dispersed Fe centers. Catal. Sci. Technol. 2020, 10, 493–501. 10.1039/C9CY02304F. [DOI] [Google Scholar]
- Proietti E.; Jaouen F.; Lefèvre M.; Larouche N.; Tian J.; Herranz J.; Dodelet J.-P. Iron-based cathode catalyst with enhanced power density in polymer electrolyte membrane fuel cells. Nat. Commun. 2011, 2, 416. 10.1038/ncomms1427. [DOI] [PubMed] [Google Scholar]
- Strickland K.; Miner E.; Jia Q.; Tylus U.; Ramaswamy N.; Liang W.; Sougrati M.-T.; Jaouen F.; Mukerjee S. Highly active oxygen reduction non-platinum group metal electrocatalyst without direct metal-nitrogen coordination. Nat. Commun. 2015, 6, 7343. 10.1038/ncomms8343. [DOI] [PMC free article] [PubMed] [Google Scholar]
- Wan X.; Liu X.; Li Y.; Yu R.; Zheng L.; Yan W.; Wang H.; Xu M.; Shui J. Fe-N-C electrocatalyst with dense active sites and efficient mass transport for high-performance proton exchange membrane fuel cells. Nat. Catal. 2019, 2, 259–268. 10.1038/s41929-019-0237-3. [DOI] [Google Scholar]
- Mineva T.; Matanovic I.; Atanassov P.; Sougrati M.-T.; Stievano L.; Clémancey M.; Kochem A.; Latour J.-M.; Jaouen F. Understanding Active Sites in Pyrolyzed Fe-N-C Catalysts for Fuel Cell Cathodes by Bridging Density Functional Theory Calculations and 57Fe Mössbauer Spectroscopy. ACS Catal. 2019, 9, 9359–9371. 10.1021/acscatal.9b02586. [DOI] [Google Scholar]
- Wagner S.; Auerbach H.; Tait C. E.; Martinaiou I.; Kumar S. C. N.; Kübel C.; Sergeev I.; Wille H.-C.; Behrends J.; Wolny J. A.; Schünemann V.; Kramm U. I. Elucidating the Structural Composition of an Fe-N-C Catalyst by Nuclear- and Electron-Resonance Techniques. Angew. Chem., Int. Ed. 2019, 58, 10486–10492. 10.1002/anie.201903753. [DOI] [PubMed] [Google Scholar]
- Chung H. T.; Cullen D. A.; Higgins D.; Sneed B. T.; Holby E. F.; More K. L.; Zelenay P. Direct atomic-level insight into the active sites of a high-performance PGM-free ORR catalyst. Science 2017, 357, 479–484. 10.1126/science.aan2255. [DOI] [PubMed] [Google Scholar]
- Zitolo A.; Goellner V.; Armel V.; Sougrati M.-T.; Mineva T.; Stievano L.; Fonda E.; Jaouen F. Identification of catalytic sites for oxygen reduction in iron- and nitrogen-doped graphene materials. Nat. Mater. 2015, 14, 937–942. 10.1038/nmat4367. [DOI] [PubMed] [Google Scholar]
- Chen Z.; Jiang S.; Kang G.; Nguyen D.; Schatz G. C.; Van Duyne R. P. Operando Characterization of Iron Phthalocyanine Deactivation during Oxygen Reduction Reaction Using Electrochemical Tip-Enhanced Raman Spectroscopy. J. Am. Chem. Soc. 2019, 141, 15684–15692. 10.1021/jacs.9b07979. [DOI] [PubMed] [Google Scholar]
- Baranton S.; Coutanceau C.; Roux C.; Hahn F.; Léger J. M. Oxygen reduction reaction in acid medium at iron phthalocyanine dispersed on high surface area carbon substrate: tolerance to methanol, stability and kinetics. J. Electroanal. Chem. 2005, 577, 223–234. 10.1016/j.jelechem.2004.11.034. [DOI] [Google Scholar]
- Bonnett R. 9.22 - Metal Complexes for Photodynamic Therapy. Comprehensive Coordination Chemistry II 2003, 945–1003. 10.1016/B0-08-043748-6/09204-5. [DOI] [Google Scholar]
- Moriya M.; Takahama R.; Kamoi K.; Ohyama J.; Kawashima S.; Kojima R.; Okada M.; Hayakawa T.; Nabae Y. Fourteen-Membered Macrocyclic Fe Complexes Inspired by FeN4-Center-Embedded Graphene for Oxygen Reduction Catalysis. J. Phys. Chem. C 2020, 124, 20730–20735. 10.1021/acs.jpcc.0c05536. [DOI] [Google Scholar]
- Marshall-Roth T.; Libretto N. J.; Wrobel A. T.; Anderton K. J.; Pegis M. L.; Ricke N. D.; Voorhis T. V.; Miller J. T.; Surendranath Y. A pyridinic Fe-N4 macrocycle models the active sites in Fe/N-doped carbon electrocatalysts. Nat. Commun. 2020, 11, 5283. 10.1038/s41467-020-18969-6. [DOI] [PMC free article] [PubMed] [Google Scholar]
- Nabae Y.; Yuan Q.; Nagata S.; Kusaba K.; Aoki T.; Takao N.; Itoh T.; Arao M.; Imai H.; Higashi K.; Sakata T.; Uruga T.; Iwasawa Y. In Situ X-ray Absorption Spectroscopy to Monitor the Degradation of Fe/N/C Cathode Catalyst in Proton Exchange Membrane Fuel Cells. J. Electrochem. Soc. 2021, 168, 014513. 10.1149/1945-7111/abdc64. [DOI] [Google Scholar]
- Choi C. H.; Baldizzone C.; Grote J.-P.; Schuppert A. K.; Jaouen F.; Mayrhofer K. J. J. Stability of Fe-N-C Catalysts in Acidic Medium Studied by Operando Spectroscopy. Angew. Chem., Int. Ed. 2015, 54, 12753–12757. 10.1002/anie.201504903. [DOI] [PubMed] [Google Scholar]
- Singh H.; Zhuang S.; Ingis B.; Nunna B. B.; Lee E. S. Carbon-based catalysts for oxygen reduction reaction: A review on degradation mechanisms. Carbon 2019, 151, 160–174. 10.1016/j.carbon.2019.05.075. [DOI] [Google Scholar]
- Chenitz R.; Kramm U. I.; Lefèvre M.; Glibin V.; Zhang G.; Sun S.; Dodelet J.-P. A specific demetalation of Fe-N4 catalytic sites in the micropores of NC_Ar + NH3 is at the origin of the initial activity loss of the highly active Fe/N/C catalyst used for the reduction of oxygen in PEM fuel cells. Energy Environ. Sci. 2018, 11, 365–382. 10.1039/C7EE02302B. [DOI] [Google Scholar]
- Santori P. G.; Speck F. D.; Li J.; Zitolo A.; Jia Q.; Mukerjee S.; Cherevko S.; Jaouen F. Effect of Pyrolysis Atmosphere and Electrolyte pH on the Oxygen Reduction Activity, Stability and Spectroscopic Signature of FeNx Moieties in Fe-N-C Catalysts. J. Electrochem. Soc. 2019, 166, F3311–F3320. 10.1149/2.0371907jes. [DOI] [Google Scholar]
- Klemm S. O.; Topalov A. A.; Laska C. A.; Mayrhofer K. J. J. Coupling of a high throughput microelectrochemical cell with online multielemental trace analysis by ICP-MS. Electrochem. Commun. 2011, 13, 1533–1535. 10.1016/j.elecom.2011.10.017. [DOI] [Google Scholar]
- Ferrandon M.; Wang X.; Kropf A. J.; Myers D. J.; Wu G.; Johnston C. M.; Zelenay P. Stability of iron species in heat-treated polyaniline-iron-carbon polymer electrolyte fuel cell cathode catalysts. Electrochim. Acta 2013, 110, 282–291. 10.1016/j.electacta.2013.03.183. [DOI] [Google Scholar]
- García Á.; Pascual L.; Ferrer P.; Gianolio D.; Held G.; Grinter D. C.; Peña M. A.; Retuerto M.; Rojas S. Study of the evolution of FeNxCy and Fe3C species in Fe/N/C catalysts during the oxygen reduction reaction in acid and alkaline electrolyte. J. Power Sources 2021, 490, 229487. 10.1016/j.jpowsour.2021.229487. [DOI] [Google Scholar]
- Alsudairi A.; Li J.; Ramaswamy N.; Mukerjee S.; Abraham K. M.; Jia Q. Resolving the Iron Phthalocyanine Redox Transitions for ORR Catalysis in Aqueous Media. J. Phys. Chem. Lett. 2017, 8, 2881–2886. 10.1021/acs.jpclett.7b01126. [DOI] [PubMed] [Google Scholar]
- Li J.; Alsudairi A.; Ma Z.-F.; Mukerjee S.; Jia Q. Asymmetric Volcano Trend in Oxygen Reduction Activity of Pt and Non-Pt Catalysts: In Situ Identification of the Site-Blocking Effect. J. Am. Chem. Soc. 2017, 139, 1384–1387. 10.1021/jacs.6b11072. [DOI] [PubMed] [Google Scholar]
- Malko D.; Kucernak A.; Lopes T. In situ electrochemical quantification of active sites in Fe-N/C non-precious metal catalysts. Nat. Commun. 2016, 7, 13285. 10.1038/ncomms13285. [DOI] [PMC free article] [PubMed] [Google Scholar]
- Yamamoto T. Assignment of pre-edge peaks in K-edge x-ray absorption spectra of 3d transition metal compounds: electric dipole or quadrupole?. X-Ray Spectrom. 2008, 37, 572–584. 10.1002/xrs.1103. [DOI] [Google Scholar]
- Choi C. H.; Lim H.-K.; Chung M. W.; Chon G.; Ranjbar Sahraie N.; Altin A.; Sougrati M.-T.; Stievano L.; Oh H. S.; Park E. S.; Luo F.; Strasser P.; Dražić G.; Mayrhofer K. J. J.; Kim H.; Jaouen F. The Achilles’ heel of iron-based catalysts during oxygen reduction in an acidic medium. Energy Environ. Sci. 2018, 11, 3176–3182. 10.1039/C8EE01855C. [DOI] [Google Scholar]
- Ohyama J.; Okubo K.; Ishikawa K.; Saida T.; Yamamoto Y.; Arai S.; Satsuma A. Removal of Surface Poisoning Improves Hydrogen Oxidation Performance of Pt Catalysts under Basic Conditions. ACS Appl. Energy Mater. 2020, 3, 1854–1859. 10.1021/acsaem.9b02274. [DOI] [Google Scholar]
Associated Data
This section collects any data citations, data availability statements, or supplementary materials included in this article.