Abstract
Objectives
To observe and compare the difference in retinal thickness using optical coherence tomography (OCT) between patients with high myopia (HM) during the third trimester of pregnancy and age-matched HM non-pregnant women.
Methods
A case-control study. A total of 39 eyes from 39 HM women in the third trimester (study group) and 50 eyes of 50 age-matched non-pregnant women with HM (control group) were included. All subjects underwent SD-OCT examination. The built-in software was used to measure the retinal thickness in macular region. The data from two groups were compared using independent-samples t test.
Results
Among the 89 subjects in this study, the mean gestational age of the study group was 35.09 ± 2.44 weeks, and the average age was 32.24 ± 3.75 years. The average age of the control group was 34.04 ± 7.19 years old. Compared with the control group, the average thickness of parafoveal area, and the average thickness of parafoveal superior, inferior, temporal quadrants of the superficial retina and the average thickness of the foveal and parafoveal of the superficial retina were significantly decreased in the study group (P < 0.05). Compared with the control group, the average thickness of all quadrants of the retina in the parafoveal area except the nasal quadrant were significantly decreased in the study group (P < 0.05).
Conclusions
In this observational study, the retinal thickness of patients with high myopia during the third trimester of pregnancy was thinner than that of non-pregnant women with age-matched high myopia.
Keywords: High myopia, Pregnancy, Optical coherence tomography, Retinal thickness
Background
HM is one of the causes of severe visual impairment leading to the major global public health concern [1]. In recent decades, the prevalence of myopia has increased worldwide, especially in Asia. It has reported that in 2012, among the population over 5 years old in China, the total number of myopic patients was about 450 million, of which the HM patients reached 30 million [2]. For the Asian population, it is estimated that the number of myopia among people aged between 25 and 40 will be as high as 78.8% by 2050 [1].
HM, which is defined as a myopic refractive error of ≥6 diopters (D) or an axial length (AL) of > 26.5 mm, is accompanied by characteristic pathological changes, including leopard fundus, conus, macular lesions, peripheral retinal and choroidal lesions [1]. The physiological ophthalmic changes during pregnancy mainly include decreased corneal sensitivity, increased corneal thickness and curvature and decreased intraocular pressure [2, 3]. Due to the significant changes in hormone levels and hemodynamics during pregnancy, the choroid is the structure with the most abundant blood vessels in the eye. It accounts for more than 70% of the total blood flow in the eye [4]. Therefore, it is speculated that the choroid and retina are susceptible to pregnancy. HM is associated with retinal changes, and HM patients is a high-risk group of retinal detachment. It is of great significance to understand the ocular changes for better care of HM pregnant women in the third trimester of pregnancy.
Due to the relative difficulty of sample collection and the limitations of traditional examination methods, the effect of pregnancy on the retina of HM patients is still remain unclear. With the development of OCT technology, a feasible and safe method is provided for quantitative observation of fundus changes during pregnancy in vivo. So using OCT to observe the structure of each retinal layer and measure parameters such as retinal thickness can provide a reference for the evaluation of fundus changes in pregnant women with HM [5].
Considering the safety of mothers and fetus and the fact that the hormone levels and hemodynamic changes in pregnant women may be more obvious in the third trimester of pregnancy, the uninvasive OCT technology has been applied in this study to quantify the superficial, deep and full retinal thickness of the macular region in women with HM in the third trimester of pregnancy. The aim of this study is to observe the corresponding fundus changes of HM during this special period of pregnancy, and try to provide a pilot understanding for further research on the correlation between the retina and pregnancy in the future.
Subjects and methods
This study is a case-control study. HM women in the third trimester of pregnancy and HM non-pregnant women who conformed to the criteria of ophthalmic examination in Ophthalmology Department of Peking University First Hospital from November 2020 were recruited. This study was approved by the Ethics Committee of Peking University First Hospital and complied with the Declaration of Helsinki. All subjects signed the informed consent form.
Inclusion criteria included age 25–40 years subjects who is generally in good health and has no history of significant cardiovascular and cerebrovascular diseases. Their myopic refractive error ≥ 6 D (or the AL > 26.5 mm) and gestational age is over 28 weeks. The right eye was designated the study eye with an even-numbered birth month; the left eye, for those with an odd-numbered birth month.
Exclusion criteria comprised previous history of hypertension, kidney disease, cardiovascular disease and other systemic diseases. Subjects with a family history of glaucoma, genetic-related eye diseases, history of eye diseases such as glaucoma, cataract, vitreoretinal disease, eye surgery and other ophthalmic diseases were excluded. Subjects with posterior complications of HM, such as retinal schesis, retinal detachment etc. were excluded. Subjects with pregnancy-induced complications (e.g., pre-eclampsia [6]) were excluded. Subjects who are unable to complete the examination and obtain clear fundus images due to various reasons were excluded. The subjects with visual acuity is less than 20/200 were also excluded.
The subjects were divided into two groups: the study group consisted of 39 eyes of 39 HM women in the third trimester of pregnancy and the control group had 50 eyes of non-pregnant women with HM.
All participants underwent standard ophthalmologic examinations, including slit-lamp biomicroscopy, refraction and best corrected visual acuity (BCVA), intraocular pressure (IOP) testing, dilated fundus examination, AL measurement (IOL Master500; Carl Zeiss Meditec, Dublin, CA). BCVA is converted to logarithm of the minimum angle of resolution (logMAR) for analyzing the results.
SD-OCT auxiliary examination had been operated for all subjects by the same skilled examiner (HRA/Spectralis, Heidelberg Engineering, Germany). Linear scanning at the same retinal position is to obtain > 90 images for real-time noise reduction. A total of 31 high-resolution raster lines were scanned in the macula region at 30° × 15°. The horizontal lines were separated by 240 μm. The image quality is checked by the same reader. The inner boundary of the superficial retina is the internal limiting membrane (ILM), and the outer boundary is the approximate form of the inner plexiform layer (IPL). It is equivalent to the interface between IPL and the inner nuclear layer (INL) [7]. The full retinal thickness refers to the thickness from the ILM to the retinal pigment epithelium (RPE) layer. The deep retinal thickness is the thickness from the junction of IPL and INL to RPE. Using the built-in software in the system to measure the superficial, deep and full retinal thickness of the macular region. Foveal thickness at 1 mm and parafoveal thickness at 3 mm diameter were measured by OCT. Parafoveal thickness was recorded for upper, temporal, inferior and nasal quadrants. Three measurements were taken from the retina for each eye. The average of three measurements was used in the study.
SPSS statistical software (IBM SPSS Corporation, version 23.0) was used for statistical analysis. The data were tested for normality and homogeneity of variance. Normal distribution of measurement data were represented by mean ± SD, comparison between the two groups use independent sample t-test; The measurement data of non-normal distribution were represented by M (P25, P75), and the comparison between the two groups was performed by Mann-Whitney U test. Chi-square test was used to compare categorical variables between the two groups. A P value of <0.05 was considered statistically significant.
Results
Clinical characteristics
A total of 89 eyes of 89 subjects were included in this study, including 39 study eyes and 50 control eyes. Mean gestational age of the study group was 35.09 ± 2.44 weeks. The clinical characteristics of subjects are shown in Table 1. The age, IOP, AL, diopter(D) and LogMAR visual acuity of the study eyes were compared with the control eyes. The difference was not statistically significant (P>0.05).
Table 1.
Clinical characteristics of the subjects
| Characteristic | Study eyes n = 39 |
Control eyes N = 50 |
P value |
|---|---|---|---|
| mean ± SD | mean ± SD | ||
| Age (years) | 32.24 ± 3.75 | 34.04 ± 7.19 | 0.132 |
| IOP (mmHg) | 15.03 ± 2.81 | 15.85 ± 2.22 | 0.208 |
| Axial length (mm) | 26.86 ± 1.02 | 26.57 ± 1.19 | 0.286 |
| Diopter(D) | −8.40 ± 1.36 | −8.27 ± 1.92 | 0.274 |
| LogMAR | 0 | 0 | 1.000 |
IOP, intraocular pressure; LogMAR, logarithm of the minimum angle of resolution; SD, standard deviation. P < 0.05, independent sample t-test
Retinal thickness measurements
Superficial retinal thickness measurements
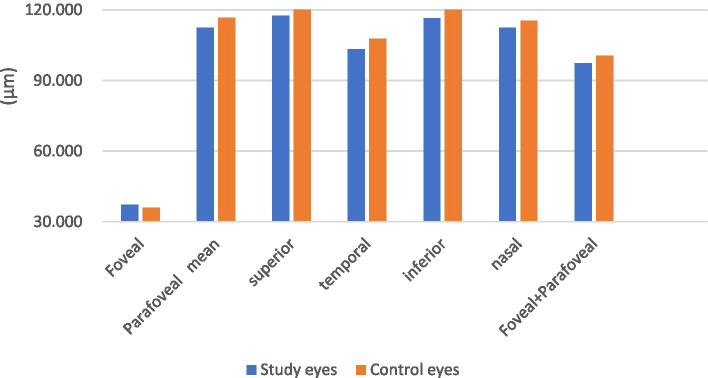
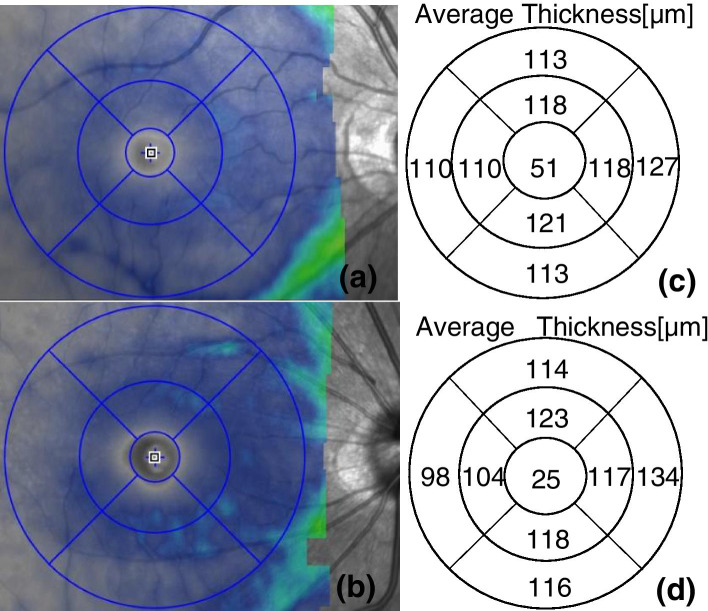
The results of superficial retinal thickness in macular region of the study eyes and control eyes are shown in Table 2 and Fig. 1. The representative OCT images are shown in Fig. 2.
Table 2.
Superficial retinal thickness measurements of the subjects
| Superficial retinal thickness (μm) | Study eyes N = 39 |
Control eyes N = 50 |
P value |
|---|---|---|---|
| mean ± SD | mean ± SD | ||
| Foveal | 37.123 ± 10.515 | 35.860 ± 10.793 | 0.587 |
| Parafoveal mean | 112.417 ± 7.002 | 116.680 ± 6.668 | 0.004 |
| superior | 117.564 ± 6.508 | 121.000 ± 7.273 | 0.023 |
| temporal | 103.308 ± 7.991 | 107.820 ± 6.675 | 0.005 |
| inferior | 116.359 ± 8.683 | 122.560 ± 7.859 | 0.001 |
| nasal | 112.436 ± 7.830 | 115.340 ± 7.061 | 0.070 |
| Foveal+Parafoveal | 97.354 ± 6.770 | 100.516 ± 6.933 | 0.034 |
SD, standard deviation. P < 0.05, independent sample t-test
Fig. 1.
Superficial retinal thickness
Fig. 2.
Superficial retinal thickness of an study eye (a) and a control eye (b). (c) and (d) are the results of each quadrant thickness of superficial retina automatically measured by the system software (the numbers in the corresponding area in the figure) respectively
Compared with the control group, the average thickness of parafoveal, the average thickness of parafoveal superior, inferior, temporal quadrants of the superficial retina and the average thickness of the foveal and parafoveal of the superficial retina were significantly decreased in the study group (P < 0.05).
Deep retinal thickness measurements
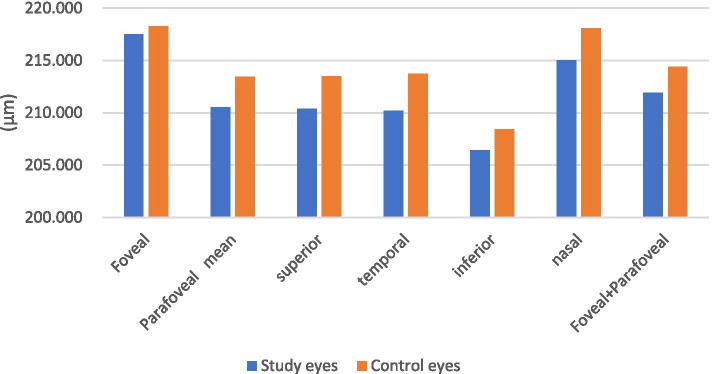
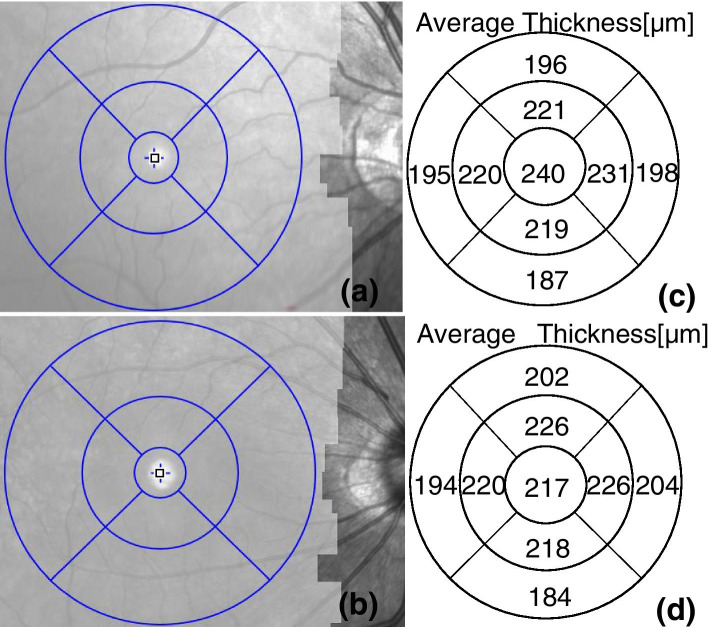
The results of deep retinal thickness in macular region of the study eyes and control eyes are shown in Table 3 and Fig. 3. The representative OCT images are shown in Fig. 4.
Table 3.
Deep retinal thickness measurements of the subjects
| Deep retinal thickness (μm) | Study eyes N = 39 |
Control eyes N = 50 |
P value |
|---|---|---|---|
| mean ± SD | mean ± SD | ||
| Foveal | 217.513 ± 11.887 | 218.260 ± 13.144 | 0.782 |
| Parafoveal mean | 210.513 ± 9.997 | 213.440 ± 9.212 | 0.155 |
| superior | 210.385 ± 9.751 | 213.520 ± 9.446 | 0.129 |
| temporal | 210.205 ± 10.519 | 213.720 ± 8.960 | 0.093 |
| inferior | 206.436 ± 10.382 | 208.440 ± 9.372 | 0.342 |
| nasal | 215.026 ± 11.451 | 218.080 ± 10.228 | 0.188 |
| Foveal+Parafoveal | 211.913 ± 9.749 | 214.404 ± 9.468 | 0.227 |
SD, standard deviation. P < 0.05, independent sample t-test
Fig. 3.
Deep retinal thickness
Fig. 4.
Deep retinal thickness of an study eye (a) and a control eye (b). (c) and (d) are the results of each quadrant thickness of deep retina automatically measured by the system software (the numbers in the corresponding area in the figure) respectively
The deep retinal thickness of the study eyes was compared with the control eyes. The difference was not statistically significant (P>0.05).
Full retinal thickness measurements
The results of full retinal thickness in macular region of the study eyes and control eyes are shown in Table 4 and Fig. 5. The representative OCT images are shown in Fig. 6.
Table 4.
Full retinal thickness measurements of the subjects
| Full retinal thickness (μm) |
Study eyes N = 39 |
Control eyes N = 50 |
P value |
|---|---|---|---|
| mean ± SD | mean ± SD | ||
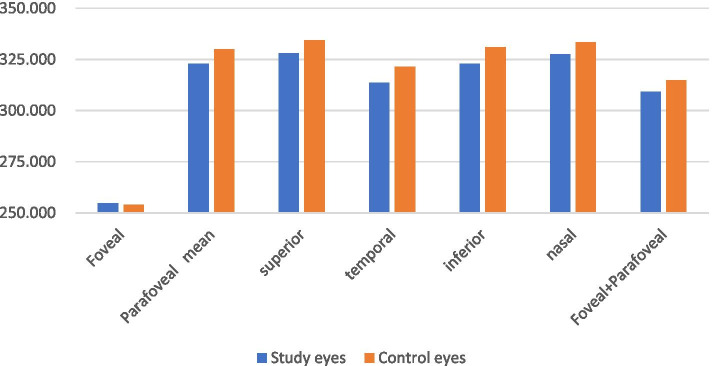
| Foveal | 254.615 ± 19.085 | 254.120 ± 21.047 | 0.909 |
| Parafoveal mean | 322.930 ± 14.391 | 330.120 ± 13.682 | 0.018 |
| superior | 327.949 ± 13.700 | 334.520 ± 14.214 | 0.031 |
| temporal | 313.513 ± 14.164 | 321.540 ± 13.271 | 0.007 |
| inferior | 322.795 ± 15.732 | 331.000 ± 14.323 | 0.012 |
| nasal | 327.462 ± 15.456 | 333.420 ± 14.486 | 0.065 |
| Foveal+Parafoveal | 309.267 ± 14.089 | 314.920 ± 14.270 | 0.066 |
SD, standard deviation. P < 0.05, independent sample t-test
Fig. 5.
Full retinal thickness
Fig. 6.
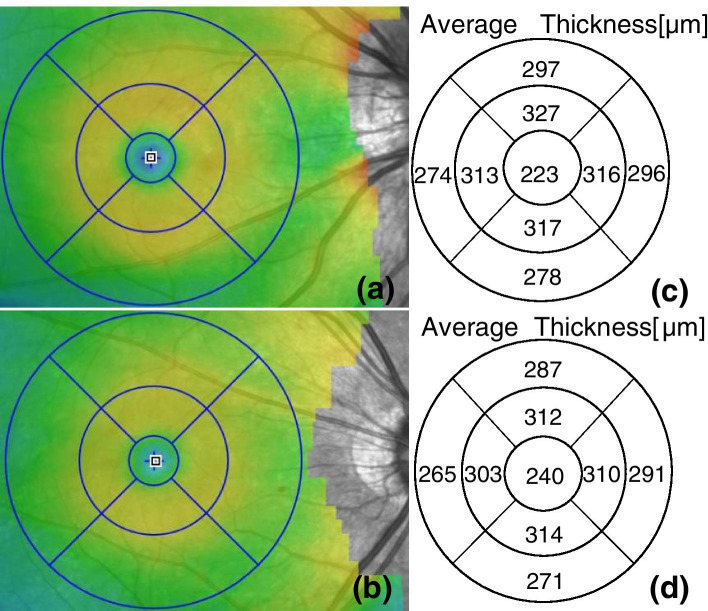
Full retinal thickness of an study eye (a) and a control eye (b). (c) and (d) are the results of each quadrant thickness of full retina automatically measured by the system software (the numbers in the corresponding area in the figure) respectively
Compared with the control group, the average thickness of all quadrants of the retina in the parafoveal area except the nasal quadrant were significantly decreased in the study group (P < 0.05).
Discussion
The results of this study revealed that the average thickness of parafoveal, the average thickness of parafoveal superior, inferior, temporal quadrants of the superficial retina and the average thickness of the foveal and parafoveal of the superficial retina were significantly decreased in the study group compared with the control group. The average thickness of all quadrants of the retina in the parafoveal area except the nasal quadrant were significantly decreased in the study group compared with the control group.
There are few studies on HM pregnant women, and the results of existing studies on retinal thickness of healthy pregnant women are still controversial. In a prospective study of 60 pregnant and 20 non-pregnant women, Cankaya et al. found an increase in total macular volume and foveal retinal thickness in women in the second and third trimester compared to those in the first trimester and non-pregnant women [8]. Demir et al. included 40 women in the third trimester of pregnancy in a prospective study,which found an increase in superior, inferior, temporal parafoveal areas of the macular thickness compared to non-pregnant women [9]. Contradictionally, Ulusoy et al. recruited 29 women in a prospective cohort study in the third trimester of pregnancy and found that there was no difference in macular thickness between the third trimester of pregnancy and non-pregnant women and 3 months postpartum [10]. Atas et al. enrolled 25 women in the third trimester of pregnancy in a prospective study and found that compared to non-pregnant women, the macular thickness decreased in the third trimester of pregnancy [ [6]]. This is similar to the results in our study.
According to the studies, the inconsistency of the research results may be caused by the difference in the measurement area. Cankaya et al. and Demir et al. studied the superior, temporal, inferior and nasal retinal thickness within 1 mm and 3 mm of the macular region. Ulusoy et al. and Atas et al. measured retinal thickness within 1 mm of the macular. In addition, the small number of pregnant women, differences in gestational age and measurement equipment may also have influenced the results.
The changes in hormone levels during pregnancy are one of the fundamental reasons that affect ocular blood flow. The cornea, tarsal gland, lacrimal gland, choroid, retina and other tissues all contain sex hormone receptors. There are sex hormone mRNA expressions in some structures of these tissues [11]. Serum levels of estrogen and progesterone increase throughout pregnancy [12]. These hormones have different effects through their receptors and/or mRNA expression [11, 13]. Estrogen regulates ocular blood flow by regulating vasodilation [14, 15]. Elevated estrogen levels will lead to an increase in the synthesis of nitrous oxide and a decrease in the synthesis of endothelin-1, both of which will lead to a decrease in vasodilation and vascular resistance [16]. As an estrogen antagonist, progesterone can cause vasoconstriction. However, estrogen has a major impact on the human circulatory system [17]. Centofanti et al. found that pregnant women had higher ocular blood flow, which may be due to the endothelium-dependent vasodilation effect of estrogen [18]. Similarly, Sato et al. used laser speckle imaging technology demonstrated a reduction in retinal vascular resistance during pregnancy [19].
Another reason that affects the ocular vascular system during pregnancy is the changes in the cardiovascular system, which cater to the increased metabolic demands of the mother and fetus. It mainly includes changes in heart rate, systemic vascular resistance and blood volume [20]. During pregnancy, systemic vascular resistance decreases and blood volume increases [21, 22]. Systolic and diastolic blood pressure usually drop by 5-10 mmHg. The drop in blood pressure is caused by a decrease in systemic vascular resistance [23]. The above changes in the cardiovascular system can increase the blood flow to different organs such as the kidneys, brain and uterus [24–26]. However, the blood flow may be redistributed to other important organs (such as the uterus and kidneys) and skin, resulting in a relative decrease in ocular blood flow in the third trimester of pregnancy [27]. Therefore, the effect of HM and pregnancy on retinal thickness and its underlying mechanism are still unclear. Further studies are needed to confirm.
Our study has the following limitations. First of all, the sample size of this study was small and it was a single-center study. Considering the safety of mothers and infants, and the acceptance of the subjects, only the relatively safe third trimester are selected for observation. There was no follow-up to observe the dynamic changes of retinal thickness in pregnant women from early pregnancy to postpartum. In the future, more large-scale longitudinal studies are needed to confirm the effect of pregnancy on retinal blood flow and structure in HM patients.
Conclusions
In conclusion, the retinal thickness of patients with high myopia during the third trimester of pregnancy was thinner than that of non-pregnant women with age-matched high myopia. Further studies are needed to determine the potential mechanisms and clinical relevance of this finding.
Acknowledgements
Thanks for contribution of XPG in measuring the retinal thickness.
Abbreviations
- AL
Axial length
- BCVA
best corrected visual acuity
- HM
High myopia
- ILM
internal limiting membrane
- INL
inner nuclear layer
- IOP
Intraocular pressure
- IPL
inner plexiform layer
- LogMAR
logarithm of the minimum angle of resolution
- OCT
optical coherence tomography
- RPE
Retinal pigment epithelium
- SD
Standard deviation
Authors’ contributions
JL and CCL were responsible for the study design. PYW measured the retinal thickness. CCL collected the data. CCL contributed to the data analysis. CCL made major contributions to writing the manuscript. JL revised and edited the manuscript. All authors read and approved the final manuscript.
Funding
None.
Availability of data and materials
The data that support the findings of this study are available from the corresponding author on reasonable request.
Declarations
Ethics approval and consent to participate
This study was approved by the Ethics Committee of Peking University First Hospital and complied with the Declaration of Helsinki. All subjects signed the informed consent form.
Consent for publication
Not applicable.
Competing interests
The authors declare that they have no competing interests.
Footnotes
Publisher’s Note
Springer Nature remains neutral with regard to jurisdictional claims in published maps and institutional affiliations.
Contributor Information
Chenchen Liu, Email: l18810655982@163.com.
Puying Wei, Email: 1334168235@qq.com.
Jun Li, Email: Bjmu_lijunf@163.com.
References
- 1.Holden BA, Fricke TR, Wilson DA, et al. Global prevalence of myopia and high myopia and temporal trends from 2000 through 2050. Ophthalmol. 2016;123(5):1036–1042. doi: 10.1016/j.ophtha.2016.01.006. [DOI] [PubMed] [Google Scholar]
- 2.Kubicka-Trzaska A, Karska-Basta I, Kobylarz J, et al. Pregnancy and the eye. Klin Ocz. 2008;110(10):401–404. [PubMed] [Google Scholar]
- 3.Mackensen F, Paulus WE, Max R, et al. Ocular changes during pregnancy. Dtsch Arztebl Int. 2014;111(33–34):567–575. doi: 10.3238/arztebl.2014.0567. [DOI] [PMC free article] [PubMed] [Google Scholar]
- 4.Parver LM, Auker C, Carpenter DO. Choroidal blood flow as a heat dissipating mechanism in the macula. Am J Ophthalmol. 1980;89(5):641–646. doi: 10.1016/0002-9394(80)90280-9. [DOI] [PubMed] [Google Scholar]
- 5.Gabriele ML, Wollstein G, Ishikawa H. Et a1. Optical coherence tomography: history, current status, and laboratory work. Invest Ophthalmol Vis Sci. 2011;52(5):2425–2436. doi: 10.1167/iovs.10-6312. [DOI] [PMC free article] [PubMed] [Google Scholar]
- 6.Atas M, Ac Maz G, Aksoy H, et al. Evaluation of the macula, retinal nerve fiber layer and choroid in preeclampsia, healthy pregnant and healthy non-pregnant women using spectral-domain optical coherence tomography. Hypertens Pregnancy, 2014, 33(3):299–310. [DOI] [PubMed]
- 7.Rosenfeld PJ, Durbin MK, Roisman L, et al. Zeiss Angioplex spectral domain optical coherence tomography angiography: technical aspects. Dev Ophthalmol. 2016;56:18–29. doi: 10.1159/000442773. [DOI] [PubMed] [Google Scholar]
- 8.Cankaya C, Bozkurt M, Ulutas O. Total macular volume and foveal retinal thickness alterations in healthy pregnant women. Seminars Ophthalmol. 2013;28(2):103–111. doi: 10.3109/08820538.2012.760628. [DOI] [PubMed] [Google Scholar]
- 9.Demir M, Oba E, Can E, et al. Foveal and parafoveal retinal thickness in healthy pregnant women in their last trimester. Clin Ophthalmol. 2011;5:1397–1400. doi: 10.2147/OPTH.S23944. [DOI] [PMC free article] [PubMed] [Google Scholar]
- 10.Ulusoy DM, Duru N, Atas M, et al. Measurement of choroidal thickness and macular thickness during and after pregnancy. International Journal of Ophthalmology. 2015;8(2):321–325. doi: 10.3980/j.issn.2222-3959.2015.02.19. [DOI] [PMC free article] [PubMed] [Google Scholar]
- 11.Gupta PD, Johar K, Sr, Nagpal K, et al. Sex hormone receptors in the human eye. Surv Ophthalmol. 2005;50(3):274–284. doi: 10.1016/j.survophthal.2005.02.005. [DOI] [PubMed] [Google Scholar]
- 12.Soldin OP, Guo T, Weiderpass E, et al. Steroid hormone levels in pregnancy and 1 year postpartum using isotope dilution tandem mass spectrometry. Fertil Steril. 2005;84(3):701–710. doi: 10.1016/j.fertnstert.2005.02.045. [DOI] [PMC free article] [PubMed] [Google Scholar]
- 13.Wickham LA, Gao J, Toda I, et al. Identification of androgen, estrogen and progesterone receptor mRNAs in the eye. Acta Ophthalmol Scand. 2000;78(2):146–153. doi: 10.1034/j.1600-0420.2000.078002146.x. [DOI] [PubMed] [Google Scholar]
- 14.Keaney JF, Jr, Shwaery GT, Xu A, et al. 17 beta-estradiol preserves endothelial vasodilator function and limits low-density lipoprotein oxidation in hypercholesterolemic swine. Circulation. 1994;89(5):2251–2259. doi: 10.1161/01.CIR.89.5.2251. [DOI] [PubMed] [Google Scholar]
- 15.Toker E. Y enice O, Akpinar I, et al. the influence of sex hormones on ocular blood flow in women. Acta Ophthalmol Scand. 2003;81(6):617–624. doi: 10.1111/j.1395-3907.2003.00160.x. [DOI] [PubMed] [Google Scholar]
- 16.Mikkola T, Viinikka L, Ylikorkala O. Estrogen and postmenopausal estrogen/progestin therapy: effect on endothelium-dependent prostacyclin, nitric oxide and endothelin-1 production. Eur J Obstet Gynecol Reprod Biol. 1998;79(1):75–82. doi: 10.1016/S0301-2115(98)00050-5. [DOI] [PubMed] [Google Scholar]
- 17.Mather KJ, Norman EG, Prior JC, et al. Preserved forearm endothelial responses with acute exposure to progesterone:a randomized cross-over trial of 17-beta estradiol, progesterone,and 17-beta estradiol with progesterone in healthy menopausal women. J Clin Endocrinol Metab, 2000, 85(12):4644–4649. [DOI] [PubMed]
- 18.Centofanti M, Migliardi R, Bonini S, et al. Pulsatile ocular blood flow during pregnancy. Eur J Ophthalmol. 2002;12(4):276–280. doi: 10.1177/112067210201200404. [DOI] [PubMed] [Google Scholar]
- 19.Sato T, Sugawara J, Aizawa N, et al. Longitudinal changes of ocular blood flow using laser speckle flowgraphy during normal pregnancy. PLoS One. 2017;12(3):e0173127. doi: 10.1371/journal.pone.0173127. [DOI] [PMC free article] [PubMed] [Google Scholar]
- 20.Carlin A, Alfirevic Z. Physiological changes of pregnancy and monitoring. Best Pract Res Clin Obstet Gynaecol. 2008;22(5):801–823. doi: 10.1016/j.bpobgyn.2008.06.005. [DOI] [PubMed] [Google Scholar]
- 21.Meah VL, Cockcroft JR, Backx K, et al. Cardiac output and related haemodynamics during pregnancy: a series of meta-analyses. Heart. 2016;102(7):518–526. doi: 10.1136/heartjnl-2015-308476. [DOI] [PubMed] [Google Scholar]
- 22.de Haas S, Ghossein-Doha C, van Kuijk SM, et al. Physiological adaptation of maternal plasma volume during pregnancy: a systematic review and meta-analysis. Ultrasound Obstet Gynecol. 2017;49(2):177–187. doi: 10.1002/uog.17360. [DOI] [PubMed] [Google Scholar]
- 23.Lang RM, Pridjian G, Feldman T, et al. Left ventricular mechanics in preeclampsia. Am Heart J. 1991;121(6):1768–1775. doi: 10.1016/0002-8703(91)90024-C. [DOI] [PubMed] [Google Scholar]
- 24.Belfort MA, Tooke-Miller C, Allen JC Jr, et al. Changes in flow velocity,resistance indices, and cerebral perfusion pressure in the maternal middle cerebral artery distribution during normal pregnancy. Acta Obstet Gynecol Scand, 2001, 80(2):104–112. [PubMed]
- 25.Conrad KP, Davison JM. The renal circulation in normal pregnancy and preeclampsia: is there a place for relaxin? Am J Physiol Renal Physiol. 2014;306(10):F1121–F1135. doi: 10.1152/ajprenal.00042.2014. [DOI] [PMC free article] [PubMed] [Google Scholar]
- 26.Flo K, Wilsgaard T, Vartun A, et al. A longitudinal study of the relationship between maternal cardiac output measured by impedance cardiography and uterine artery blood flow in the second half of pregnancy. BJOG. 2010;117(7):837–844. doi: 10.1111/j.1471-0528.2010.02548.x. [DOI] [PubMed] [Google Scholar]
- 27.Thornburg KL, Jacobson SL, Giraud GD, et al. Hemodynamic changes in pregnancy. Semin Perinatol. 2000;24(1):11–14. doi: 10.1016/S0146-0005(00)80047-6. [DOI] [PubMed] [Google Scholar]
Associated Data
This section collects any data citations, data availability statements, or supplementary materials included in this article.
Data Availability Statement
The data that support the findings of this study are available from the corresponding author on reasonable request.


