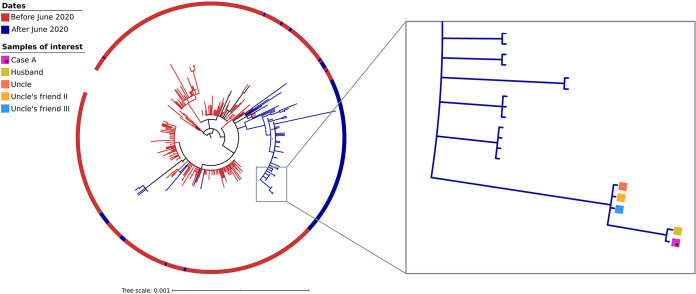
FIG 3.
Maximum likelihood phylogenetic tree that includes the 348 sequences from samples collected from the Madrid population in the study and uploaded to GISAID on 8 October 2020. The color code in the ring indicates the sequences corresponding to the first or second COVID-19 waves (before or after June 2020). The five clustered strains, corresponding to the cases in the study (Case A, husband, uncle, and the two friends of the uncle), are highlighted with colored squares.

