

Abstract
Carbon fiber microelectrodes (CFMEs) have been extensively used to measure neurotransmitters with fast-scan cyclic voltammetry (FSCV) due to their ability to adsorb cationic monoamine neurotransmitters. Although FSCV, in tandem with CFMEs, provides high temporal and spatial resolution, only single-channel potentiostats and electrodes have been primarily utilized. More recently, the need and use of carbon fiber multielectrode arrays has risen to target multiple brain regions. Previous studies have shown the ability to detect dopamine using multielectrode arrays; however, they are not readily available to the scientific community. In this work, we interfaced a carbon fiber multielectrode array (MEA or multielectrode array), to a commercially available four-channel potentiostat for multiplexing neurochemical measurements. The MEA’s relative performance was compared to single CFMEs where dopamine detection was found to be adsorption controlled to the electrode’s surface. Multiple waveforms were applied to each fiber of the multielectrode array simultaneously to detect different analytes on each electrode of the array. A proof of concept ex vivo experiment showed that the multielectrode array could record redox activity in different areas within the mouse caudate putamen and detect dopamine in a 3-mm2 area. To our knowledge, this is the first use of the multielectrode array paired with a commercially available multichannel potentiostat for multi-waveform application and neurotransmitter co-detection. This novel array may aid in future studies to better understand complex brain heterogeneity, the dynamic neurochemical environment, and how disease states or drugs affect separate brain areas concurrently.
Keywords: FSCV, Neurotransmitters, Microelectrodes, Carbon fiber
Introduction
Carbon fiber microelectrodes (CFMEs) have been extensively used for neurochemical detection. These electrodes are relatively small in size with a < 10-μm diameter and have low impedance in comparison to metal microelectrodes [1]. They are biocompatible with well-characterized electrochemical properties that make them ideal for biological sensing applications [2, 3]. CFMEs can be easily batch constructed in most lab settings and can be used to make rapid measurements of neurotransmitters (NTs) when used in tandem with the analytical technique, fast-scan cyclic voltammetry (FSCV) [4]. FSCV was first developed by Millar in the late 1970s and expanded by Wightman et al. with the use of carbon microelectrodes [5]. This technique allows for application of high sampling rates onto CFMEs to measure redox kinetics of neurotransmitters, nucleotides, and even neuropeptides [3, 6–8]. CFMEs are highly efficacious for making measurements in brain slices ex vivo and in vivo in anesthetized animals. These electrodes do not elicit an immune response when chronically implanted and their small size mitigates tissue damage [9]. With fast, subsecond temporal and spatial resolution, CFMEs are used with FSCV to monitor the dynamics of neurotransmitter release and reuptake [10]. The shape and current peak positions of the resulting cyclic voltammogram (CV) serve as a fingerprint for biomolecule detection and facilitate the differentiation of analytes. Neurotransmitters such as dopamine (DA) [11], as well as the indoleamine serotonin (5-HT) [12, 13], have been detected using FSCV and CFMEs. However, as these NTs are not solely found within a singular region, brain sensors must be able to co-detect NTs in multiple areas simultaneously.
To target multiple brain areas simultaneously, metal electrodes have been used; however, such electrodes are limited to measuring electrical activity or performing electrical stimulation. Moreover, metal microelectrode arrays have limited applicability as neurotransmitter sensors. They have been known to elicit an immune response when chronically implanted and have lower overpotentials for water oxidation. To counter some of these drawbacks and enhance functionality as biosensors, metal electrodes have also been electrodeposited with conductive carbon-based polymer coatings to increase biocompatibility and longevity of recording capabilities [14]. Polymers, such as PEDOT, carbon nanotubes (CNTs) [15], and Nafion [16], an anionic, cation exchange polymer, have been electrodeposited onto metal surfaces for increased selectivity [17–19]. More recently, metal microelectrodes modified with CNTs [20] and carbon nanospikes [21] have also been used as neurotransmitter sensors with FSCV in addition to using gold-based multielectrodes arrays [22]. Although these coated metal arrays show promise in vivo, it is often difficult to deposit thin and uniform carbon coatings onto metal electrode surfaces [23]. Further development requires electrodes with carbonaceous surfaces to enable neurotransmitter adsorption and subsequent oxidation where various regions can be studied concurrently.
More recently, researchers have developed multielectrode arrays and multichannel potentiostats for multiple channels of detection [24]. For example, carbon-based arrays have been developed with multiple protruding fibers embedded into a single array [25]. In some fabrications, eight-channel [26] and 16-channel [24, 27] electrodes have been used to detect dopamine across all available channels. This newer technology aids in reducing the physical foot print of the implantable array, minimizing immune inflammatory responses, and the ability to spatially sample dopamine [24]. These advanced sensors have also been implanted in non-human primates for long-term recording in multiple striatal sites [28]. Additionally, dopamine measurements using such arrays can be paired with electrophysiology in rats in a multi-faceted approach to measure neuronal activity [29]. These novel electrodes are currently engineered in research laboratories, but are limited to public use by the accompanying hardware [30, 31].
Here, we developed a novel use for the carbon fiber multielectrode array (MEA). This MEA has four separate fibers protruding from a custom printed, polyimide circuit board. The carbon fibers are reinforced with a layer of Parylene C and soldered to a head stage [27]. Although currently limited to four channels, this multielectrode array is able to make simultaneous measurements spatially resolved and with the capability to apply four separate waveforms onto each fiber when paired with a commercially available potentiostat from Pine Research (WaveNeuro FSCV multichannel potentiostat) and High Definition Cyclic Voltammetry (HDCV) software. Using an Omnetics connector, we interfaced the MEA to the potentiostat hardware and compared the multielectrode array’s selectivity and sensitivity to single CFMEs. Optical characterization displayed a uniform carbon surface and thin parylene coating. Dopamine and other biologically relevant NTs were found to be adsorption controlled to the surface of the electrode. Additionally, multiple waveforms were applied to the four different fibers to multiplex NT detection and target multiple brain subregions simultaneously. We also performed proof of principle testing in brain slices. Potassium-stimulated release of extracellular dopamine was measured in an approximately 3-mm2 area of the mouse caudate putamen. This technology may help monitor complex brain neurochemistry by measuring changes in NT concentration concurrently in different brain regions in response to disease and pharmacological states in additional to behavioral changes. Additionally, the availability of commercial hardware will facilitate the accessibility of these applications on a larger scale.
Materials and methods
CFMEs and chemicals
CFMEs were produced by aspirating a single carbon fiber (GoodFellow, Huntingdon, England) into a 1.2-mm-diameter glass capillary tube (1.2–0.68 mm, A-M Systems, Inc., Carlsberg, WA) via a vacuum pump (Gast) and pulled to a fine taper using a pipette puller (PC-100, Narishige Puller, Narishige Group, Japan). The tapered end was epoxied with Epon Resin 828 resin (Miller-Stephenson, Morton Grove, IL) and diethylenetriamine hardener (Fisher Scientific, Waltham, MA) at a ratio of 3:1 to form a seal and cured in an oven at 125 °C for approximately 4 h. The protruding fiber was trimmed under a compound microscope to approximately 100 μm in length initially and further trimmed to match the length of the multielectrode array.
The electrode was backfilled with a 0.1-M KCl and placed with an electrode holder with a silver wire (Universal Pipette Holder, Dagan, Minneapolis, MN) that was interfaced with the Malli Adapter from Pine Research. The electrode was then placed into the flow cell setup. A 200-A head stage connected to the holder and then interfaced to a Wave Neuro potentiostat (Pine Research Instrumentation, Durham, North Carolina). A manual micromanipulator (WPI, Sarasota, FL) attached to the flow cell was used to lower the CFME to make consistent contact with a buffer solution flowing over the electrodes tip. Artificial cerebrospinal fluid (aCSF) was used as the buffer solution and made from the following: 145 mM NaCl, 2.68 mM KCl, 1.40 mM CaCl2·2H2O, 1.01 mM MgSO4·7H2O, 15.5 mM Na2HPO4, and 0.45 mM NaH2PO4·H2O. The salts were sequentially dissolved into deionized water (Millipore, Billerica, MA) and the pH adjusted to 7.4. Similarly, phosphate-buffered saline (PBS) was used as an alternative buffer consisting of 137 mM NaCl. 2.7 mM KCl, 10 mM Na2HPO4, and 1.8 mM KH2PO4. The aCSF or PBS solution was applied over the electrode tip using a 50-mL syringe (BD, Franklin Lakes, NJ) and the NE-1000 programmable syringe pump (New Era Pump Systems Inc. Farmingdale, NY) with solutions and injected analytes flowing through the FSCV Flow Cell (Pine Research, Durham, NC) at a rate of 1 mL/min.
Neurochemicals such DA, 5-HT, and adenosine (Adn) were purchased from Fisher Scientific and Sigma-Aldrich (St. Louis, MO). A 10-mM solution of NTs was prepared in perchloric acid. [3] During the day of an experiment, the 10-mM stock solution of NT was diluted to a desired concentration, ranging from 100 nM to 100 μM.
Carbon fiber multielectrode arrays
Carbon fiber multielectrode arrays (abbreviated to MEA) were obtained from the University of Michigan and used in the flow cell in a similar fashion to the CFME [27, 32]. In brief, the multielectrode array is made up of 4 carbon fibers (T-650/35: 3K, Cytec Thornel, Woodland Park, NJ) arranged in a row, but can be custom made to fit a variety of different arrangements. Each fiber is spaced approximately 400 to 600 μm apart, lengthwise, and are cut to a length of approximately 200 μm. These protruding fibers may be trimmed shorter or left at longer lengths. The distance between the fibers can also be customized. With this iteration of the multielectrode array, the horizontal distance between all four fibers was asymmetrical. The fibers were attached to a custom printed circuit board using silver epoxy and the electronics covered in a protective, insulating epoxy. The exposed fibers were also coated with Parylene C for support and 45 μm were re-exposed using 532 nm Karl Suss green laser to uncover the electroactive carbon fiber microelectrode [27].
Statistics
Statistical data analysis and was completed using Graph Pad Prism 9 and significance testing performed using Student’s t test. Figures and illustrations were also made using the same software.
Tissue extraction
Tissue samples were collected from C57BL/6J in accordance with IACUC and animal facility protocols at American University and Protocol #20-04. Mice were housed in 12-h light and dark cycles and provided food and water ad libitum. Mice were removed from their home cage one at a time and placed in an isoflurane chamber for anesthetization. Once reflexes were assessed via toe and tail pinch, euthanasia was completed by cervical dislocation. The head was decapitated, and tissue cut away using surgical scissors to expose the skull. Surgical rongeurs were used to quickly peel away the skull bones to expose and remove the brain. For slice preparation [33], a coronal cut as made at approximately bregma + 1.0 to uncover the caudate putamen. Coordinates and anatomical landmarks were located using Allen Mouse Brain Atlas (2004) and Franklin and Paxinos Atlas [34, 35]. The brain slice sample was placed into ice cold aCSF until use.
For tissue sample recording, the set up procedure was adapted from Papouin and Haydon [36] where a 600-mL plastic beaker was filled with ice cold aCSF solution. Within the beaker, an empty 50 mL conical tube, with the bottom removed, was superglued to the side. An open bottom petri dish had nylon hosiery glued to it and also superglued to the beaker [36]. To oxygenate the buffer and brain tissue, an aquarium air stone was used to bubble oxygen into the beaker using tubing and an air pump (Tetra, Blacksburg, VA) [37]. The bubbler was sufficient for the short duration and small volume size in this experiment, as previously performed [38]. The beaker was then placed in an ice bath to maintain a cooler the temperature of the aCSF solution. To perform measurements from the tissue, the MEA was lowered by 100 μm into the tissue sample. After a 30-min equilibrating period, neurochemical release was elicited by pipetting on 1 μL of 0.1 M KCl near the MEA via a micropipette.
Multielectrode array setup
From the potentiostat, an adapter was used to connect the four-channel WaveNeuro to a head stage cable and then to a head stage coupler. This directly connected to another adapter which linked the Omnetics head stage on the multielectrode array to the head stage coupler of the potentiostat. All four-channel accessories were also purchased from Pine Research with the exception of the array adapter which linked the Omnetics head stage to the stage coupler. Images of the setup can be seen in Fig. 1d and Fig. S1 (see the Supplementary Information, ESM).
Fig. 1.
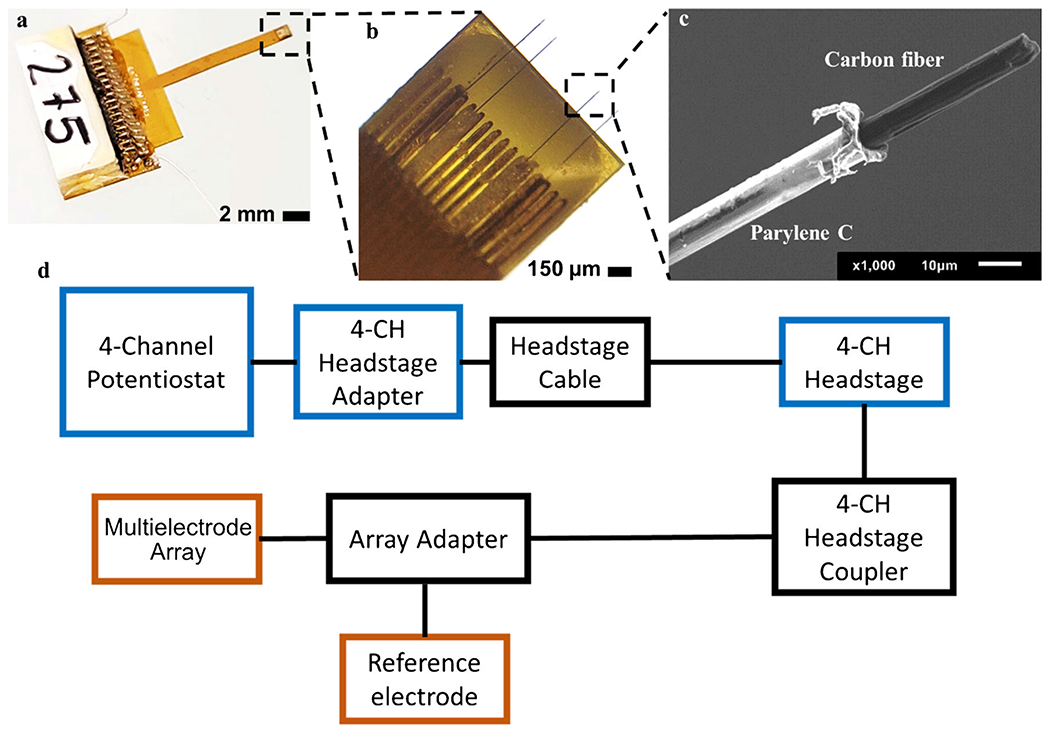
(a) The multielectrode array taken by a Samsung camera (Samsung Note 20 Ultra, 108-MP wide-angle camera). Approximate scale bar is shown. (b) The four carbon fibers of the multielectrode array viewed under a light microscope, at 20× magnification. (c) SEM image of a single fiber of the multielectrode array with a 10-μm scale bar. The carbon fiber (black) protrudes out, and the white insulating material is the Parylene C coating. (d) Connection schematic of multielectrode array showing the separate pieces of hardware that is required for adapting it to a commercial potentiostat. See ESM Fig. S1 for setup and parts photos
A three-prong extension clamp was inserted into the micromanipulator arm where clamp was able to hold the multielectrode array in place. Using the adjustments knobs on the micromanipulator, the multielectrode array was lowered into the flow cell or the brain slice until the oscilloscope showed the applied waveform on the electrode. For in vitro experiments, 10 min were allotted for equilibrating and 30 min for the tissue sample. To elicit NT release from the tissue sample, 1 μL of 0.1 M KCl [39] was pipetted (Eppendorf, Enfield, CT) onto the surface of the tissue and near the carbon fibers. The same software was used to record the CV data. Trials were repeated until the signal was degraded.
Scanning electron microscopy
SEM images were obtained using a JEOL JSM-IT100 (JEOL, Tokyo, Japan). Gold sputtering of the MEA was not required as the protruding carbon and parylene were clearly visible. The entire array was placed on an SEM sample holder and secured with carbon tape. The specimen mount was placed into the SEM stage and the working distance set to 10 mm and adjusted as needed for focus and resolution. The accelerating voltage was set to 5.0 kV.
Results
Setup and characterization
To connect the MEA to the WaveNeuro Potentiostat, minor modifications and additional adapters were utilized. As shown in Fig. 1 and in the ESM, an Omnetics adapter was used to couple the electrode array to the multichannel potentiostat. Figure 1a, b shows the custom-made MEA in increasing magnification to visualize the protruding carbon fibers. From the surface of the array, the full protruding length is approximately 200 μm (Fig. 1b). Using high-magnification scanning electron microscopy (SEM), the parylene polymer coating (Parylene C), observed in a black and white color, was visible (Fig. 1c). Parylene C provided rigidity and stability by encasing the carbon fiber. The designated electroactive carbon fiber surface area was later exposed using laser treatment; approximately 45 μm in length and ~7 μm in diameter. Figure 1d provides a schematic of how the MEA was connected and interfaced to the WaveNeuro FSCV multichannel potentiostat. An illustration of the schematic is also provided in ESM Fig. S1. Colored wires (ESM Fig. S1c) were soldered with silver epoxy to gold pins which connected to the 4-CH (channel) headstage coupled to the Omnetics array adapter. This allowed for the MEA to interface with the WaveNeuro Potentiostat in order to make measurements.
In vitro
Following optical characterization, the MEA (with comparable protruding carbon fiber lengths) was compared to conventional, single-channel CFMEs with respect to sensitivity (peak oxidative current) for the detection of dopamine. To ensure comparable conditions, the single-channel CFME was further trimmed down to 45 μm to match the protruding length of the multielectrode array. A triangle a waveform that scans from – 0.4 to 1.3 V at 400 V/s [40] was applied onto the electrodes, and sensitivity for DA was determined by detecting 100 nM dopamine. The DA triangle waveform was applied onto each fiber of the MEA and a single run produced four separate CVs, corresponding to channels 1 through 4. The experiments lasted 30 s and DA was injected at the 5-s mark. The resulting CVs yielded peak oxidation currents at approximately 0.7 V and a reduction peak at approximately – 0.2 V. Following background subtraction, both electrodes produced CVs with redox peaks at the appropriate voltages as seen in the literature [40]. The single-channel CFMEs (Fig. 2a) and MEAs (Fig. 2b) did not significantly differ in sensitivity, thus, showing similar performance between the array and single-channel electrode in measuring dopamine (Fig. 2c).
Fig. 2.
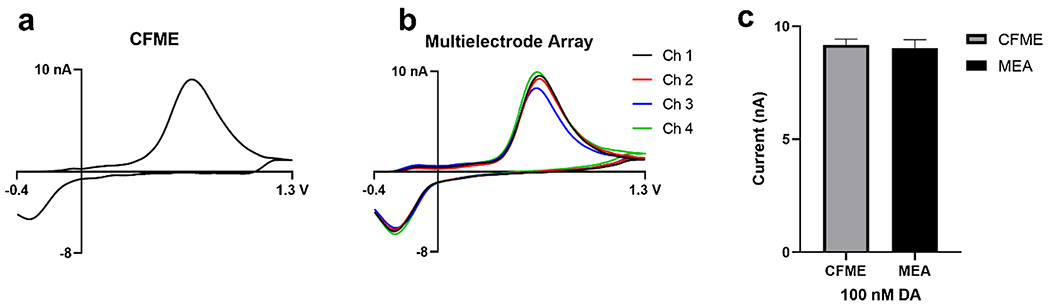
Cyclic voltammograms (CVs) of the a CFME compared to the b 4 channels of the multielectrode array overlaid on one another. The CVs indicated no differences in the peak oxidative current of the electrodes for dopamine detection. c Bar graph showing no statistical significance (NS) between peak oxidative current. Standard error of the mean used for error bars. (N = 3 for each electrode type)
In order to determine whether dopamine was adsorption controlled to the surface of the MEAs, scan rate experiments were performed. If an analyte is adsorption controlled onto the surface of the CFME, the peak oxidative current will have a linear relationship with respect to increasing scan rate [41]; 10 μM DA was tested on both electrodes at increasing scan rates ranging from 50 to 1000 V/s (Fig. 3a, c). Both electrodes yielded a linear relationship between peak oxidative current and scan rate, illustrating that dopamine was adsorption controlled [40]. Additionally, the signal response of both electrodes over time was also shown to be stable as observed by testing over a period of 4 h (Fig. 3b, d). The duration of the stability experiments was set to 4 h as that is the typical time of an electrochemical in vivo experiment. Again, using 10 μM DA, electrodes were applied with the triangle waveform for four consecutive hours, and DA was injected every hour. A stable response also showed that the analyte was not polymerizing or fouling the electrode surface, which would decrease sensitivity over time. As previously seen, the multielectrode array behaved comparably to the CFME and did not have a significant difference in normalized oxidative current (nA) over the duration of stability experiments.
Fig. 3.
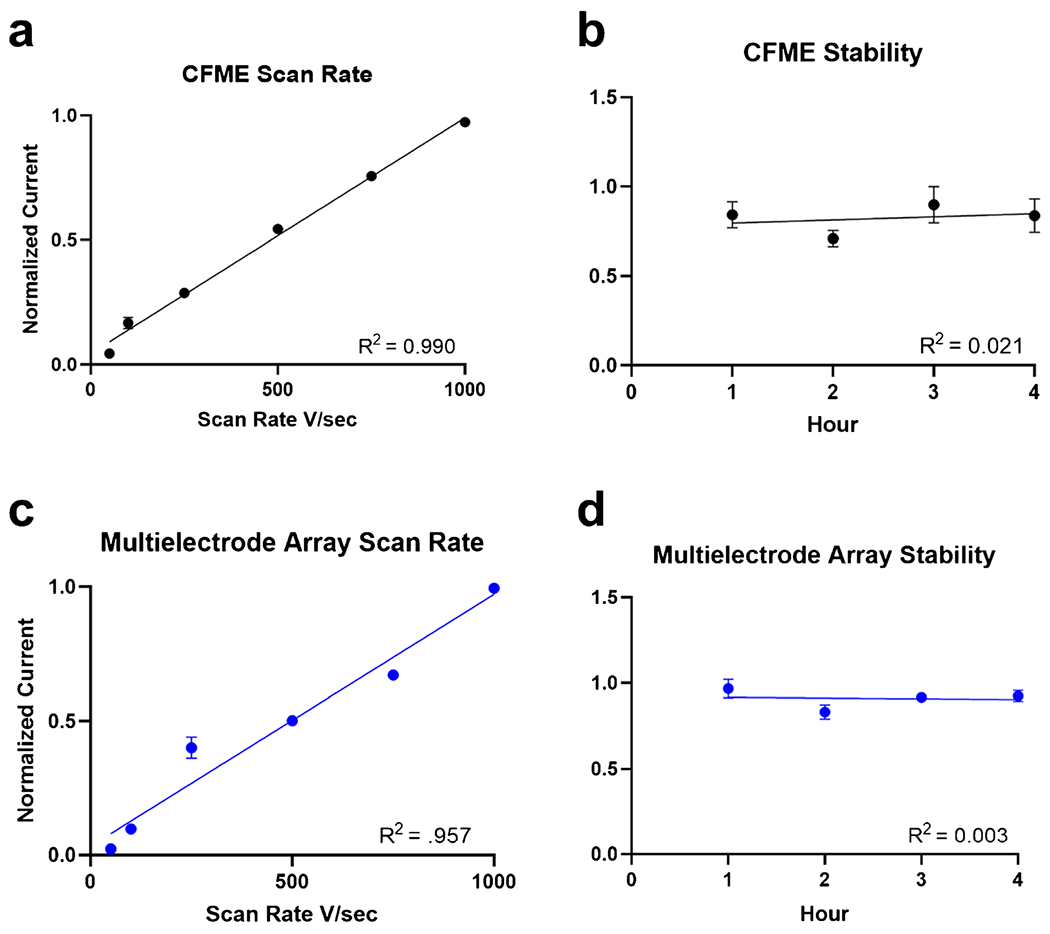
Comparison of a CFME to c multielectrode array showing the linear relationship of normalized current versus increasing scan rate ranging from 50 to 1000 V/s. Peak oxidative current was found to be linearly dependent and proportional to scan rate. Stability experiments of b CFME and d multielectrode array over the course of 4 h showed no significant difference in peak oxidative current over time. Error bars are shown as standard error of the mean. (N = 3 for each electrode type)
Furthermore, in vitro calibration experiments were performed where a concentration range of 100 nM to 100 μM of DA was tested on both electrodes (Fig. 4). The CFME and multielectrode array both had clear plateaus above 10 μM (Fig. 4a, c). There was also a strong linear relationship between peak oxidative current and concentration when testing at the lower concentrations (Fig. 4b, d). This indicated that DA is saturated at the surface of the electrode at higher concentrations, occupying sites for further adsorption, which led to the asymptotic curve. The calibration curves are utilized for electrode pre-calibration and, in turn, used to extrapolate in vivo concentrations of known analytes using the non-normalized current after pre- and post-calibrations. In addition to DA, several other neurochemicals were detected using the MEA, which illustrated the utility of these arrays for other biologically relevant neurochemicals in addition to dopamine. Norepinephrine (NE) was measured using the DA triangle waveform and the MEA, which produced a CV similar to that of dopamine (ESM Fig. S2a). Hydrogen peroxide (H2O2) was also measured using a triangle waveform that scanned from – 0.4 to + 1.4 V [42] (ESM Fig. S2b) [43].
Fig. 4.
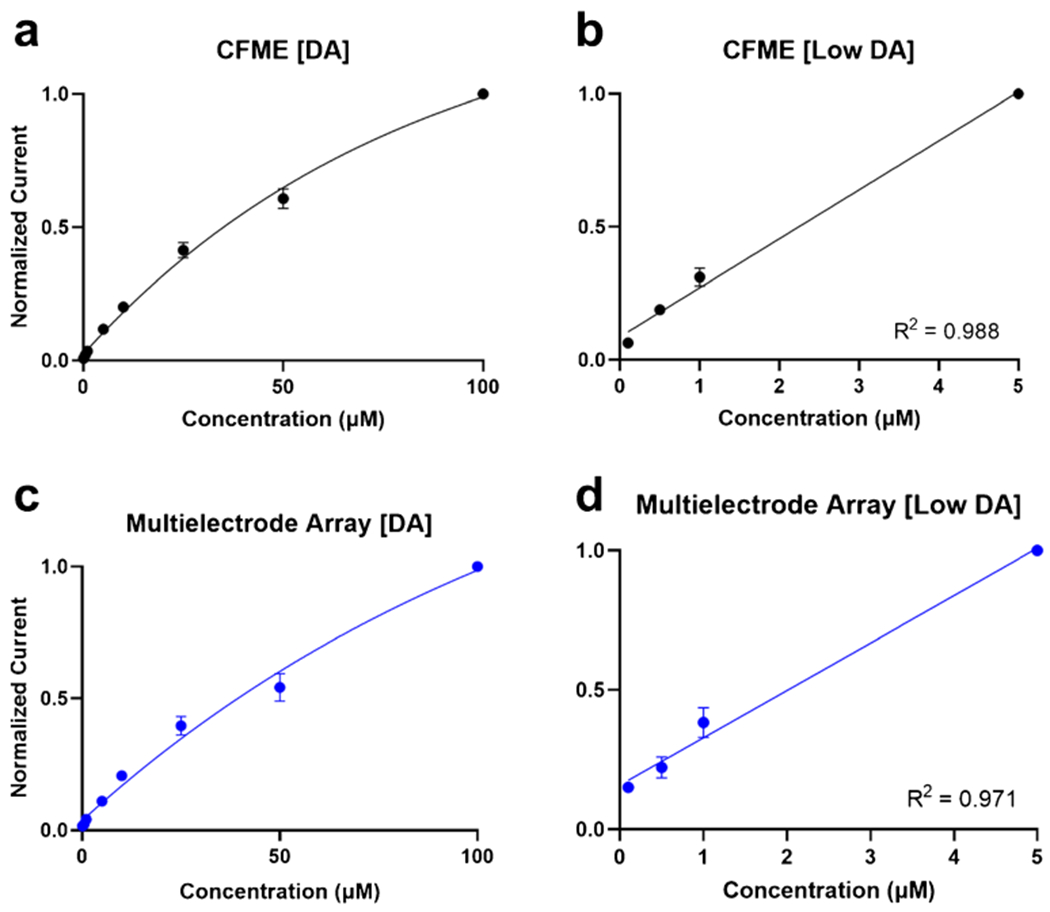
Dopamine concentration curve ranging from 1 to 100 μM for the a CFME and c multielectrode array, highlighting the lower concentration linear relationship of the CFME (b) and multielectrode array (d). Error bars are shown as standard error of the mean (N = 3 for each electrode type)
Multi-waveform application
Aside from DA, other analytes such as serotonin (5-HT) [44, 45] required unique waveform modification to differentiate the analytes from other neurochemicals. Adjusting the waveform leads to enhanced detection by allowing the analyte to sufficiently adsorb onto the CFME surface and prevent electrode fouling. In other instances, a single waveform has been developed to measure two biomolecules concurrently, such as the nucleosides adenosine and guanosine [46, 47]. However, a major limitation of the single-channel CFMEs is that only a single waveform can be tested at once.
An advantageous feature of the MEA is that multiple waveforms can be applied to each of the four different channels to aid in the co-detection and testing of multiple waveforms without electrode crosstalk. The WaveNeuro Potentiostat along with the HDCV software enabled the application of separate waveforms onto each fiber of the MEA. We applied the dopamine triangle dopamine waveform [48] to channel 1. Channel 2 was applied with the 5-HT Jackson waveform [44], created originally to reduce in vivo fouling. The Jackson waveform (JWF) scanned from a holding potential of 0.2 V to the switching potentials of 1.0, to – 0.1, and back to 0.2 V at 1000 V/s. For channel 3, we applied the extended waveform (EWF), where the switching potential was increased to 1.3 V. Lastly, the extended hold waveform (EHWF) which scanned from 0.2 to 1.3 V was applied to channel 4. It was held at 1.3 V for 1 ms, then scanned back down to – 0.1 then to 0.2 V. The dopamine, Jackson, extended, and hold waveforms were simultaneously applied to the different channels of the MEA. Figure 5a shows the MEA oscilloscope with all 4 waveforms applied. Figure 5b displays the waveform shapes separately and Fig. 5c shows the aforementioned waveforms superimposed with the oscilloscope response from each electrode as seen in the HDCV software.
Fig. 5.
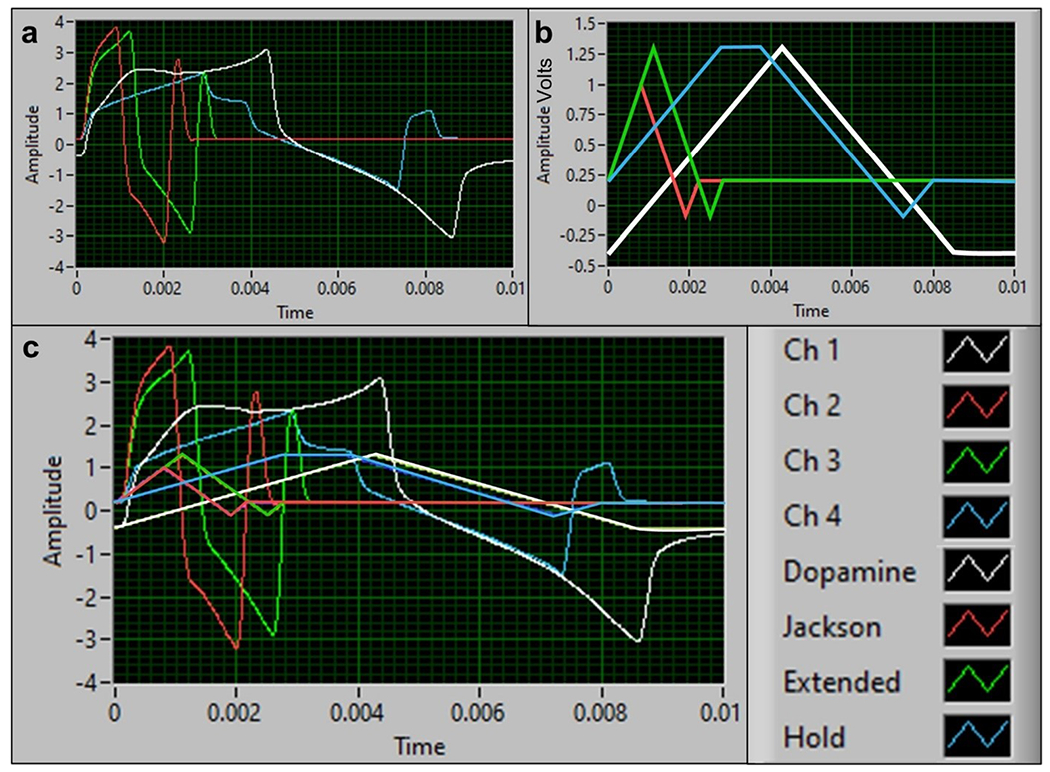
Multiple waveform applications onto the multielectrode array. a Oscilloscope of waveforms applied onto each multielectrode array channel and b the waveform shapes: triangle, Jackson, extended, and hold. c Overlay of waveforms applied onto the multielectrode array and the oscilloscope of channels 1–4. Channel 1 corresponds to the DA triangle waveform. Channel 2 is applied with the 5-HT Jackson waveform. Channel 3 displays the 5-HT extended waveform, and channel 4 shows the 5-HT extended hold waveform, as seen in the legend on the right-hand side of c
After application of the three 5-HT waveforms and DA triangle waveform, 1 μM 5-HT was measured with the MEA (Fig. 6). 5-HT was successfully detected with peak oxidative potentials comparable to single-channel glass insulated CFMEs [49]. The peak oxidative current was observed at approximately at 0.6 V for channels 1 and 4 and 0.9 V for channels 2 and 3. The different waveforms applied changed the shape and position of the respective cyclic voltammograms by manipulating electron transfer at the surface of the electrode. Waveforms with faster scan rates had more positively shifted peak oxidative potentials due to the outrunning of electron transfer at faster scan rates. The triangle waveform yielded a broader reduction peak for serotonin, while the 5-HT waveforms had sharper reduction peaks shifted to more positive potentials. These data indicate that different waveforms, such as triangle versus piecewise or sawhorse waveforms, could be applied onto the multielectrode array simultaneously and still produce comparable cyclic voltammograms to single-channel CFMEs without interference or crosstalk between different fibers.
Fig. 6.
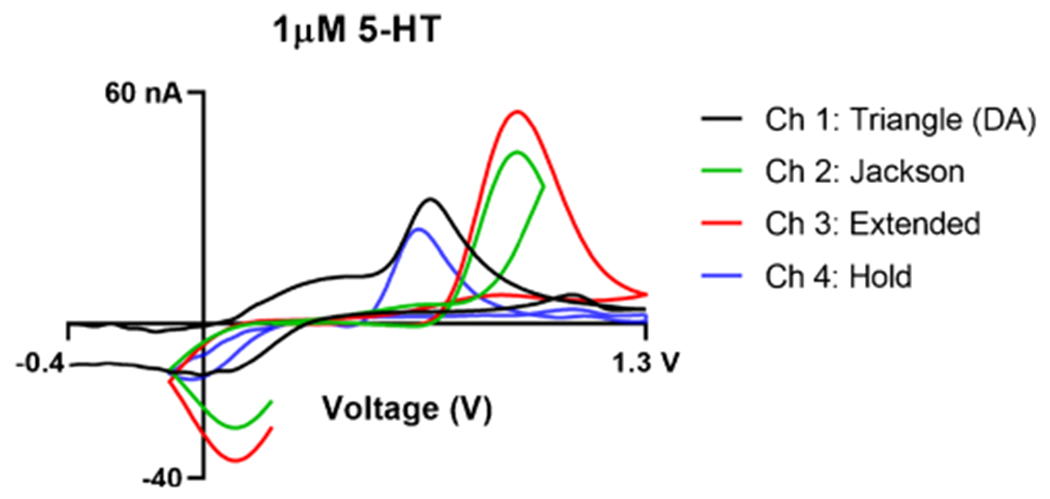
Multi-waveform detection of serotonin where each channel corresponds to the applied waveform for 5-HT detection as seen in the legend (triangle, Jackson, extended, and hold). The oscilloscope signals seen in Fig. 5 correspond to the shape of the electrode
Co-detection of dopamine, serotonin, and adenosine
After confirming multiple waveform application was feasible, we then co-detected several compounds using separate waveforms. We applied channel 1 with the DA triangle waveform, and channel 4 was applied with the adenosine (Adn) triangle waveform to measure the nucleoside. The adenosine waveform scanned from – 0.4 to 1.45 V and back at 400 V/s [50]. The waveform for channel 2 was changed to the 5-HT EWF, and channel 3 was applied with the EHWF. The oscilloscope and applied waveforms can be seen in ESM Fig. S3. The aim for these experiments was to determine how the CV shapes of each analyte changed in response to the different waveforms applied while performing co-detection experiments using varying concentration ratios. DA, 5-HT, and adenosine were measured by increasing the concentration of one analyte at a time upon applying different waveforms.
First, we tested increasing DA concentration (Fig. 7a) in a fixed mixture of 100 nM μM 5-HT and 10 μM adenosine. Increasing the concentration of DA from 100 nM to 10 μM showed a clear increase in peak oxidative current at approximately 0.7 V. Reduction peaks indicated that both DA and 5-HT were present as seen with the sharper peak close to – 0.2 V and broader peak at approximately 0 V, for DA and 5-HT respectively. Similarly, an increasing concentration of 5-HT, from 100 nM to 1 μM, was measured with a fixed concentration of 1 μM DA and 10 μM adenosine solution using the EWF on channel 2 (Fig. 7b). Although the lower concentrations were difficult to detect in the mixture, upon increasing the concentration of 5-HT, an increasing peak oxidative current was observed at 0.9 V. A small secondary peak observed at around 0.7 V was hypothesized to be DA. This was confirmed by testing increasing concentrations of DA with the same 5-HT and adenosine mixture seen in Fig. 7a, by using the EWF. The results (ESM Fig. S4e) indicate an increasing peak oxidative current at 0.7 V.
Fig. 7.
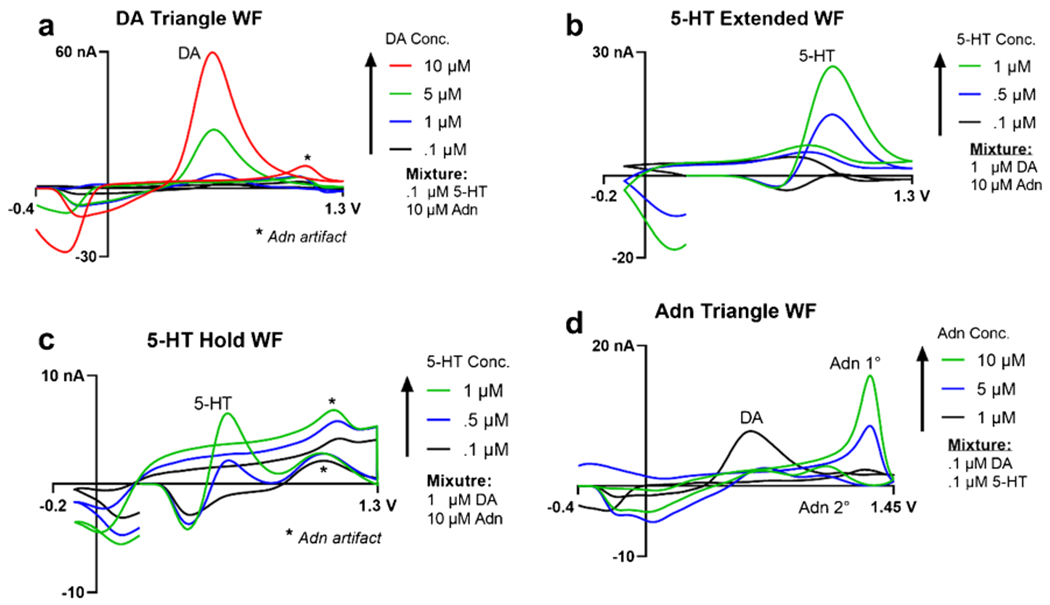
Co-detection of DA, 5-HT, and adenosine (Adn) using their respective waveforms and with varying concentration ratios. a DA was co-detected using the DA triangle waveform on channel 1 with increasing concentrations from 100 nM to 10 μM and in a mixture of 100 nM 5-HT and 10 μM adenosine. Asterisks in a and b indicate artifact signal from the adenosine analyte. b 100 nM to 1 μM 5-HT was co-detected using the EWF on channel 2 and the c EHWF on channel 3 with 1 μM DA and 10 μM adenosine. d Adenosine was co-detected from 1 to 10 μM in a mixture of 100 nM 5-HT and DA, each, on channel 4 using the triangle waveform
The signal for 5-HT was also assessed using the EHWF on channel 3 (Fig. 7c). The resulting CVs showed increasing peak oxidative current for 5-HT but were not as sensitive as the previous EWF. Additionally, two peaks were observed at approximately 1.0 V on the forward scan and 1.1 V on the backwards scan, respectively. As DA is not detectable using this waveform [45], the peak oxidative current most likely resulted from the presence of 10 μM adenosine. Additionally, the time spent holding at the switching potential of 1.3 V may have allowed for more of the analyte to adsorb onto the electrode. To determine if the peaks observed at 1.1 and 1.3 V were attributed to adenosine, increasing adenosine concentrations, from 1 to 10 μM, were tested on the EHWF (ESM Fig. S4j). Using this 5-HT waveform, both peaks were present at their approximate voltage positions and increased in peak oxidative current upon increasing concentration. This suggested that holding the voltage at the switching potential provided for sufficient time for etching the electrode surface. This enabled adenosine to adsorb on to the surface of the MEA, thus allowing for the detection of both primary and secondary peaks of adenosine.
Lastly, increasing concentrations of adenosine were measured in mixtures with 100 nM DA and 100 nM 5-HT, respectively (Fig. 7d) resulting in increases in peak oxidative currents at approximately 1.3 V, which was determined to be the primary adenosine peak and a smaller secondary peak at 1.1 V. Although the CV results were shifted from previous studies [50], the peaks were attributed to adenosine as evident from the increasing peak oxidative current while increasing the adenosine (Adn) concentration and keeping DA and 5-HT concentrations constant. Interestingly, the secondary peak of adenosine was occluded during co-detection with a low adenosine concentration. When 5-HT was co-detected with 10 μM adenosine and 1 μM DA using the adenosine triangle waveform (ESM Fig. S41), the 5-HT peak was dwarfed compared to adenosine and adenosine’s primary peak that were still present. When DA is co-detected with adenosine, the carbon fibers are more sensitive towards DA than adenosine [51], a phenomenon explained as increasing the switching potential over oxidizes the CFMEs which enhances sensitivity [2].
Although some peaks had shifted in these co-detection experiments, compared to their values in literature, cross analyzing each increasing analyte’s concentration with respect to the four separate waveforms allowed us to visualize how these peaks shifted. Figure S4 (see the ESM) shows how the peak oxidative currents were altered when DA, 5-HT, and adenosine were detected using different waveforms. For example, an increasing concertation of adenosine on the EWF indicated the inability to detect adenosine at all (ESM Fig. S4g). We were able to confirm and identify each peak by testing increasing analyte concentrations on the four different waveforms. This highlighted a substantial advantage of the MEA paired with commercial hardware and software where the application of multiple waveforms significantly enhanced and facilitated the multiplexing and co-detection of multiple analytes.
Mouse striatum
Finally, the MEAs were used to perform proof of principle measurements and assess signal strength and durability in animal tissue. After extracting a mouse brain, it was sliced at approximately bregma + 1 to expose the striatum. The specified area is indicated by a black circle (Fig. 8f). The striatum is innervated by neuronal fibers that release various neurotransmitters, such as dopamine, 5-HT, and norepinephrine [52]. Therefore, an area of the caudate putamen (CPu), a subcortical region within the striatum, was targeted. Upon stimulating with potassium chloride, the resulting CVs (Fig. 8a, b–e) indicate an oxidation peak at approximately 0.7 V, which is most likely oxidation peak of DA. However, channels 1 and 2 (Fig. 8b, c) had sharp reduction peaks around 0 V, indicative of 5-HT detection with a triangle waveform applied to a CFME. As NT release was non-specific through potassium stimulation, most likely other biochemicals, such as norepinephrine, may have been detected that cause large broad peaks, as seen with channel 4 (Fig. 8e).
Fig. 8.
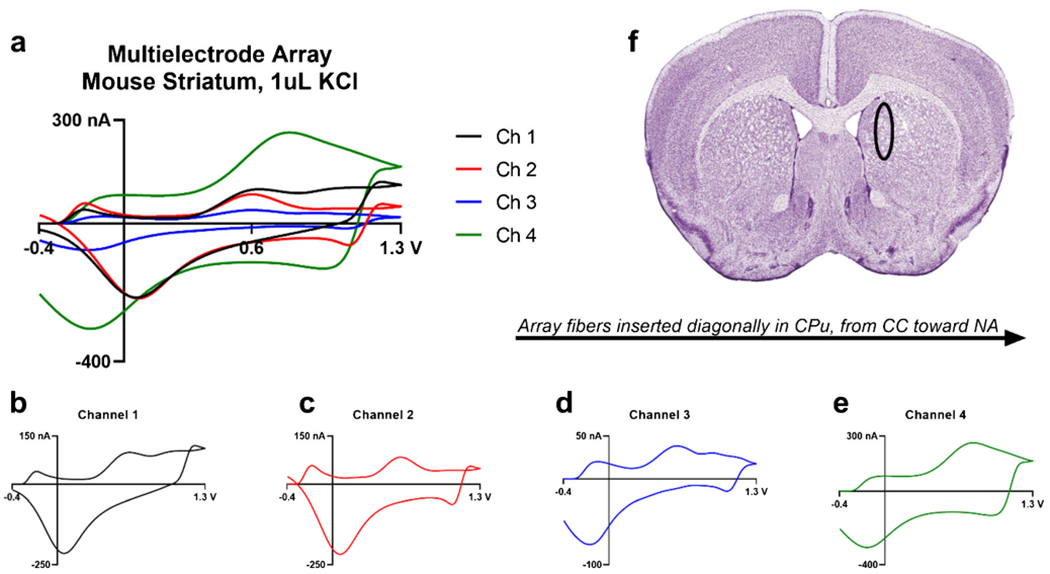
a The cyclic voltammograms of neurotransmitter release stimulated by the application of KCl ex vivo of the MEA. CVs of channel 1 (b), channel 2 (c), channel 3 (d), and channel 4 (e) that were measured in the brain slice. f The multielectrode array targeted the caudate putamen or dorsal striatum, as indicated by the black circle [53]. The mouse brain atlas was adapted from Allen Mouse Brain Atlas (2004) and the Franklin and Paxinos Atlas [34, 35]. Neurotransmitter release was elicited by applying 1 μL of 0.1 M KCl and a full schematic of the apparatus can be seen in ESM Fig. S5
Conclusion
In this work, the novel MEA was characterized and compared to the single-channel CFME. For electrodes with similar protruding lengths and electroactive surface areas, the MEA had a comparable sensitivity to glass insulated CFMEs. The kinetics of DA adsorption were similar on both types of electrodes as observed in the stability and scan rate experiments. The most prominent feature of the multielectrode array was the ability to simultaneously apply multiple waveforms to the different carbon fibers with minimal crosstalk between the exposed carbon fibers. Additionally, measurements with the MEAs were performed in brain tissue ex vivo that showed that more than one subregion within the caudate putamen could be targeted. MEAs could not only target different brain regions, but also the same region simultaneously if the electrodes were closely positioned and spaced together. Eliciting neurotransmitter release via potassium chloride stimulation produced nonspecific neurotransmitter release as measured by the MEA. The ability to simultaneously measure neurotransmission in several areas within the brain will aid in understanding complex brain heterogeneity instead of monitoring one region at a time. To our knowledge, this was the first use of a MEA with a commercially available multichannel potentiostat applied with multiple waveforms. This will hopefully allow for neurochemical measurements in multiple brain regions simultaneously and help understand complex brain heterogeneity and neurochemistry.
Supplementary Material
Acknowledgements
The authors would like to acknowledge the NSF 1707316 grant along with Dr. Paras Patel and Julianna Richie from the Department of Biomedical Engineering at the University of Michigan for the technical assistance and with providing electrode materials.
Funding
The authors would like to acknowledge the following funding sources: American University Faculty Research Support Grant (AGZ), Faculty Mellon Grant, NASA DC Space Grant, NIH 1R41NS113702–01 (AGZ), SACP Pittcon Starter Grant, NSF I-Corps #1936173 (AGZ), NSF MRI # 1625977 (scanning electron microscopy), and American University Fall 2020 Graduate Student Research Grant (HR).
Footnotes
Supplementary Information The online version contains supplementary material available at https://doi.org/10.1007/s00216-021-03526-x.
Code availability Not applicable.
Declarations
Ethics approval All ex vivo animal experiments were conducted in accordance with IACUC guidelines, protocol #20–04.
Consent to participate Not applicable
Consent for publication Consent from all authors was obtained prior to submission.
Conflict of interest The authors declare no competing interests.
Data availability
All materials noted in this manuscript include the name and company from where they were purchased to aid in replication.
References
- 1.Armstrong-James M, Millar J. Carbon fibre microelectrodes. J Neurosci Methods. 1979;1(3):279–87. [DOI] [PubMed] [Google Scholar]
- 2.Zestos AG. Carbon nanoelectrodes for the electrochemical detection of neurotransmitters [Internet]. Vol. 2018, International Journal of Electrochemistry. Hindawi; 2018. [cited 2021 Feb 9]. p. e3679627. Available from: https://www.hindawi.com/journals/ijelc/2018/3679627/ [DOI] [PMC free article] [PubMed] [Google Scholar]
- 3.Huffman ML, Venton JB. Carbon-fiber microelectrodes for in vivo applications. Analyst. 2009;134(1):18–24. [DOI] [PMC free article] [PubMed] [Google Scholar]
- 4.Rafi H, Zestos AG Review—recent advances in FSCV detection of neurochemicals via waveform and carbon microelectrode modification. J Electrochem Soc. 2021. May;168(5):057520. [DOI] [PMC free article] [PubMed] [Google Scholar]
- 5.Howell JO, Wightman RM. Ultrafast voltammetry and voltammetry in highly resistive solutions with microvoltammetric electrodes. Anal Chem. 1984;56(3):524–9. [Google Scholar]
- 6.Asrat TM, Cho W, Liu FA, Shapiro SM, Bracht JR, Zestos AG. Direct detection of DNA and RNA on carbon fiber microelectrodes using fast-scan cyclic voltammetry. ACS Omega. 2021;6(10):6571–81. [DOI] [PMC free article] [PubMed] [Google Scholar]
- 7.Calhoun SE, Meunier CJ, Lee CA, McCarty GS, Sombers LA. Characterization of a multiple-scan-rate voltammetric waveform for real-time detection of met-enkephalin. ACS Chem Neurosci. 2019;10(4):2022–32. [DOI] [PMC free article] [PubMed] [Google Scholar]
- 8.Mendoza A, Asrat T, Liu F, Wonnenberg P, Zestos AG. Carbon nanotube yarn microelectrodes promote high temporal measurements of serotonin using fast scan cyclic voltammetry. Sensors. 2020;20(4):1173. [DOI] [PMC free article] [PubMed] [Google Scholar]
- 9.Clark JJ, Sandberg SG, Wanat MJ, Gan JO, Horne EA, Hart AS, et al. Chronic microsensors for longitudinal, subsecond dopamine detection in behaving animals. Nat Methods. 2010;7(2):126–9. [DOI] [PMC free article] [PubMed] [Google Scholar]
- 10.Kuhr WG, Wightman RM. Real-time measurement of dopamine release in rat brain. Brain Res. 1986;381(1):168–71. [DOI] [PubMed] [Google Scholar]
- 11.Berridge KC. The debate over dopamine’s role in reward: the case for incentive salience. Psychopharmacology. 2007;191(3):391–431. [DOI] [PubMed] [Google Scholar]
- 12.González-Flores D, Belén V, Garrido M, Gonzalez-Gomez D, Lozano M, Ayuso M, et al. Ingestion of Japanese plums (Prunus salicina Lindl. cv. Crimson Globe) increases the urinary 6 sulfatoxymelatonin and total antioxidant capacity levels in young, middle-aged and elderly humans: nutritional and functional characterization of their content. J Food Nutr Res. 2011;50:229–36. [Google Scholar]
- 13.Young SN. How to increase serotonin in the human brain without drugs. J Psychiatry Neurosci. 2007;32(6):394–9. [PMC free article] [PubMed] [Google Scholar]
- 14.Yeager JD, Phillips DJ, Rector DM, Bahr DF. Characterization of flexible ECoG electrode arrays for chronic recording in awake rats. J Neurosci Methods. 2008;173(2):279–85. [DOI] [PMC free article] [PubMed] [Google Scholar]
- 15.Zestos AG, Venton BJ. Communication—carbon nanotube fiber microelectrodes for high temporal measurements of dopamine. J Electrochem Soc. 2018;165(12):G3071–G3073. [DOI] [PMC free article] [PubMed] [Google Scholar]
- 16.Raju D, Mendoza A, Wonnenberg P, Mohanaraj S, Sarbanes M, Truong C, Zestos AG. Polymer modified carbon fiber-microelectrodes and waveform modifications enhance neurotransmitter metabolite detection. Anal Methods. 2019;11(12):1620–1630. [DOI] [PMC free article] [PubMed] [Google Scholar]
- 17.Wonnenberg PM, Cho W, Liu F, Asrat T, Zestos AG. Polymer modified carbon fiber microelectrodes for precision neurotransmitter metabolite measurements. J Electrochem Soc. 2020;167(16): 167507. [DOI] [PMC free article] [PubMed] [Google Scholar]
- 18.Wonnenberg PM, Zestos AG. Polymer-modified carbon fiber microelectrodes for neurochemical detection of dopamine and metabolites. ECS Trans. 2020;97(7):901–27. [DOI] [PMC free article] [PubMed] [Google Scholar]
- 19.Cho W, Liu F, Hendrix A, McCray B, Asrat T, Connaughton V, et al. Timed electrodeposition of PEDOT:Nafion onto carbon fiber-microelectrodes enhances dopamine detection in zebrafish retina. J Electrochem Soc. 2020;167(11):115501. [DOI] [PMC free article] [PubMed] [Google Scholar]
- 20.Yang C, Jacobs CB, Nguyen MD, Ganesana M, Zestos AG, Ivanov IN, et al. Carbon nanotubes grown on metal microelectrodes for the detection of dopamine. Anal Chem. 2016;88(1):645–52. [DOI] [PMC free article] [PubMed] [Google Scholar]
- 21.Zestos AG, Yang C, Jacobs BC, Hensley D, Jill Venton B. Carbon nanospikes grown on metal wires as microelectrode sensors for dopamine. Analyst. 2015;140(21):7283–92. [DOI] [PMC free article] [PubMed] [Google Scholar]
- 22.Wei H, Li L, Jin J, Wu F, Yu P, Ma F, et al. Galvanic redox potentiometry based microelectrode array for synchronous ascorbate and single-unit recordings in rat brain. Anal Chem. 2020;92(14):10177–82. [DOI] [PubMed] [Google Scholar]
- 23.Alba NA, Du ZJ, Catt KA, Kozai TDY, Cui XT. In vivo electrochemical analysis of a PEDOT/MWCNT neural electrode coating. Biosensors. 2015;5(4):618–46. [DOI] [PMC free article] [PubMed] [Google Scholar]
- 24.Schwerdt HN, Kim M, Amemori S, Homma D, Yoshida T, Shimazu H, et al. Subcellular probes for neurochemical recording from multiple brain sites. Lab Chip. 2017;17(6):1104–15. [DOI] [PMC free article] [PubMed] [Google Scholar]
- 25.Demuru S, Nela L, Marchack N, Holmes SJ, Farmer DB, Tulevski GS, et al. Scalable nanostructured carbon electrode arrays for enhanced dopamine detection. ACS Sens. 2018;3(4):799–805. [DOI] [PubMed] [Google Scholar]
- 26.Schwerdt HN, Kim M, Karasan E, Amemori S, Homma D, Shimazu H, et al. Subcellular electrode arrays for multisite recording of dopamine in vivo. In: 2017 IEEE 30th International Conference on Micro Electro Mechanical Systems (MEMS). 2017. p. 549–52. [Google Scholar]
- 27.Patel PR, Popov P, Caldwell CM,Welle EJ, Egert D, Pettibone JR, et al. High density carbon fiber arrays for chronic electrophysiology, fast scan cyclic voltammetry, and correlative anatomy. J Neural Eng. 2020;17(5):056029. [DOI] [PubMed] [Google Scholar]
- 28.Schwerdt HN, Shimazu H, Amemori K, Amemori S, Tierney PL, Gibson DJ, et al. Long-term dopamine neurochemical monitoring in primates. Proc Natl Acad Sci. 2017;114(50):13260. [DOI] [PMC free article] [PubMed] [Google Scholar]
- 29.Schwerdt HN, Gibson DJ, Amemori K, Stanwicks LL, Yoshida T, Cima MJ, et al. Chronic multi-modal monitoring of neural activity in rodents and primates. In: Integrated sensors for biological and neural sensing [Internet]. International Society for Optics and Photonics; 2021. [cited 2021 Jun 11]. p. 1166308. Available from: https://www.spiedigitallibrary.org/conference-proceedings-of-spie/11663/1166308/Chronic-multi-modal-monitoring-of-neural-activity-in-rodents-and/10.1117/12.2583029.short [Google Scholar]
- 30.Marsh MP, Koehne JE, Andrews RJ, Meyyappan M, Bennet KE, Lee KH. Carbon nanofiber multiplexed array and wireless instantaneous neurotransmitter concentration sensor for simultaneous detection of dissolved oxygen and dopamine. Biomed Eng Lett. 2012;2(4):271–7. [DOI] [PMC free article] [PubMed] [Google Scholar]
- 31.Zachek MK, Park J, Takmakov P, Mark Wightman R, McCarty SG. Microfabricated FSCV-compatible microelectrode array for real-time monitoring of heterogeneous dopamine release. Analyst. 2010;135(7):1556–63. [DOI] [PMC free article] [PubMed] [Google Scholar]
- 32.Richie JM, Patel PR, Welle EJ, Dong T, Chen L, Shih AJ, et al. Benchtop carbon fiber microelectrode array fabrication toolkit bioRxiv 2021 Mar 22;2021.03.22.436422. [DOI] [PMC free article] [PubMed] [Google Scholar]
- 33.Spijker S Dissection of rodent brain regions. In: Li KW, editor. Neuroproteomics [Internet]. Totowa, NJ: Humana Press; 2011. [cited 2021 Apr 6]. p. 13–26. (Neuromethods). Available from: 10.1007/978-1-61779-111-6_2. [DOI] [Google Scholar]
- 34.Lein ES, Hawrylycz MJ, Ao N, Ayres M, Bensinger A, Bernard A, et al. Genome-wide atlas of gene expression in the adult mouse brain. Nature. 2007;445(7124):168–76. [DOI] [PubMed] [Google Scholar]
- 35.Paxinos G, Franklin KBJ. Paxinos and Franklin’s the mouse brain in stereotaxic coordinates. 4th ed. Amsterdam: Academic Press; 2012. 360 p [Google Scholar]
- 36.Papouin T, Haydon PG. Obtaining acute brain slices. Bio-Protoc [Internet]. 2018. Jan 20 [cited 2020 Dec 23];8(2). Available from: https://www.ncbi.nlm.nih.gov/pmc/articles/PMC5856250/ [DOI] [PMC free article] [PubMed] [Google Scholar]
- 37.Butcher JT, Goodwill AG, Frisbee JC. The ex vivo isolated skeletal microvessel preparation for investigation of vascular reactivity. J Vis Exp JoVE [Internet]. 2012. Apr 28 [cited 2021 May 5];(62). Available from: https://www.ncbi.nlm.nih.gov/pmc/articles/PMC3466634/ [DOI] [PMC free article] [PubMed] [Google Scholar]
- 38.Dorris DM, Hauser CA, Minnehan CE, Meitzen J. An aerator for brain slice experiments in individual cell culture plate wells. J Neurosci Methods. 2014;238:1–10. [DOI] [PubMed] [Google Scholar]
- 39.Araujo CBL, Bendhack LM. High concentrations of KCl release noradrenaline from noradrenergic neurons in the rat anococcygeus muscle. Braz J Med Biol Res. 2003;36(1):97–104. [DOI] [PubMed] [Google Scholar]
- 40.Venton BJ, Cao Q. Fundamentals of fast-scan cyclic voltammetry for dopamine detection. Analyst. 2020;145(4):1158–68. [DOI] [PMC free article] [PubMed] [Google Scholar]
- 41.Bard AJ, Faulkner LR. Electrochemical methods: fundamentals and applications. 2nd ed. New York: Wiley; 2000. 864 p [Google Scholar]
- 42.Sanford AL, Morton SW, Whitehouse KL, Oara HM, Lugo-Morales LZ, Roberts JG, et al. Voltammetric detection of hydrogen peroxide at carbon fiber microelectrodes. Anal Chem. 2010;82(12): 5205–10. [DOI] [PMC free article] [PubMed] [Google Scholar]
- 43.Giniatullin A, Petrov A, Giniatullin R Action of hydrogen peroxide on synaptic transmission at the mouse neuromuscular junction. Neuroscience. 2019;399:135–45. [DOI] [PubMed] [Google Scholar]
- 44.Jackson BP, Dietz SM, Wightman RM. Fast-scan cyclic voltammetry of 5-hydroxytryptamine. Anal Chem. 1995;67(6):1115–20. [DOI] [PubMed] [Google Scholar]
- 45.Dunham KE, Venton BJ. Improving serotonin fast-scan cyclic voltammetry detection: new waveforms to reduce electrode fouling. Analyst. 2020;145(22):7437–46. [DOI] [PMC free article] [PubMed] [Google Scholar]
- 46.Cryan MT, Ross AE. Scalene waveform for codetection of guanosine and adenosine using fast-scan cyclic voltammetry. Anal Chem. 2019;91(9):5987–93. [DOI] [PubMed] [Google Scholar]
- 47.Cryan MT, Ross AE. Subsecond detection of guanosine using fast-scan cyclic voltammetry. Analyst. 2018;144(1):249–57. [DOI] [PubMed] [Google Scholar]
- 48.Takmakov P, Zachek MK, Keithley RB, Walsh PL, Donley C, McCarty GS, et al. Carbon microelectrodes with a renewable surface. Anal Chem. 2010;82(5):2020–8. [DOI] [PMC free article] [PubMed] [Google Scholar]
- 49.Dunham KE, Venton BJ. Improving serotonin fast-scan cyclic voltammetry detection: new waveforms to reduce electrode fouling. Analyst [Internet]. 2020. Sep 11 [cited 2020 Oct 8]; Available from: https://pubs.rsc.org/en/content/articlelanding/2020/an/d0an01406k [DOI] [PMC free article] [PubMed] [Google Scholar]
- 50.Nguyen MD, Venton BJ. Fast-scan cyclic voltammetry for the characterization of rapid adenosine release. Comput Struct Biotechnol J. 2015;13:47–54. [DOI] [PMC free article] [PubMed] [Google Scholar]
- 51.Shon Y-M, Chang S-Y, Tye SJ, Kimble CJ, Bennet KE, Blaha CD, et al. Comonitoring of adenosine and dopamine using the wireless instantaneous neurotransmitter concentration system: proof of principle. J Neurosurg. 2010;112(3):539–48. [DOI] [PMC free article] [PubMed] [Google Scholar]
- 52.Nicolai EN, Trevathan JK, Ross EK, Lujan JL, Blaha CD, Bennet KE, et al. Detection of norepinephrine in whole blood via fast scan cyclic voltammetry. IEEE Int Symp Med Meas Appl Proc IEEE Int Symp Med Meas Appl. 2017;2017:111–6. [DOI] [PMC free article] [PubMed] [Google Scholar]
- 53.Zhang Y, Liang Y, Randesi M, Yuferov V, Zhao C, Kreek MJ. Chronic oxycodone self-administration altered reward-related genes in the ventral and dorsal striatum of C57BL/6J mice: an RNA-seq analysis. Neuroscience. 2018;393:333–49. [DOI] [PubMed] [Google Scholar]
Associated Data
This section collects any data citations, data availability statements, or supplementary materials included in this article.
Supplementary Materials
Data Availability Statement
All materials noted in this manuscript include the name and company from where they were purchased to aid in replication.