Abstract
We report a comprehensive evaluation of a full field-of-view (FOV) photon-counting detector (PCD) CT system using phantoms, and qualitatively assess image quality in patient examples. A whole-body PCD-CT system with 50 cm FOV, 5.76 cm z-detector coverage and two acquisition modes (standard: 144 × 0.4 mm collimation and ultra-high resolution, UHR: 120 × 0.2 mm collimation) was used in this study. Phantom scans were acquired to assess image uniformity, CT number accuracy, noise power spectrum, spatial resolution, material decomposition and virtual monoenergetic imaging (VMI) performance. Four patients were scanned on the PCD-CT system with matched or lower radiation dose than their prior clinical CT scans performed using energy-integrating detector (EID) CT, and the potential clinical impact of PCD-CT was qualitatively evaluated. Phantom results showed water CT numbers within ±5 HU, and image uniformity measured between peripheral and central ROIs to be within ±5 HU. For the UHR mode using a dedicated sharp kernel, the limiting in-plane spatial resolution was 40 line-pairs/cm, which corresponds to a 125 μm spatial resolution. The full-width-at-half-maximum for the section sensitivity profile was 0.33 mm for the smallest slice thickness (0.2 mm) using the UHR mode. Material decomposition in a multi-energy CT phantom showed accurate material classification, with a root-mean-squared-error of 0.3 mg/cc for iodine concentrations (2 to 15 mg/cc) and 14.2 mg/cc for hydroxyapatite concentrations (200 and 400 mg/cc). The average percent error for CT numbers corresponding to the iodine concentrations in VMI (40–70 keV) was 2.75 %. Patient PCD-CT images demonstrated better delineation of anatomy for chest and temporal bone exams performed with the UHR mode, which allowed the use of very sharp kernels not possible with EID-CT. VMI and virtual non-contrast images generated on a patient head CT angiography exam using the standard acquisition mode demonstrated the multi-energy capability of the PCD-CT system.
Keywords: X-ray Computed Tomography, spatial resolution, photon-counting detector, image analysis
1. Introduction
Photon-counting detector (PCD) based computed tomography (CT) has attracted extensive attention in recent years and substantial progress has been made in various aspects of detector materials, electronics, algorithms, imaging systems and potential clinical applications. PCDs based on cadmium telluride (CdTe), cadmium zinc telluride (CdZnTe), and silicon semiconductors have been reported for investigational use (da Silva et al., 2019, Kappler et al., 2013, Kopp et al., 2018, Panta et al., 2018). Fundamentally, the direct-conversion PCD technology enables uniform photon weighting across x-ray energies, small detector-pixel design, and energy thresholding and photon binning for multi-energy imaging. This has led to superior imaging capabilities compared to conventional CT which uses energy integrating detectors (EIDs), such as elimination of electronic noise (Yu et al., 2016b), facilitation of ultra-high resolution (UHR) imaging using smaller detector pixels (Leng et al., 2016, Pourmorteza et al., 2018), reduction of metal artifacts (Do et al., 2020, Zhou et al., 2019), and improvement of iodine contrast-to-noise ratio (Gutjahr et al., 2016, Schmidt, 2009). In addition, the energy-binning feature of PCDs allows measurements above and below the K-edge of high-Z materials. Targeted imaging has been demonstrated in small-animal models using PCD-CT and nanoparticle-based K-edge contrast agents (Cormode et al., 2010, Ostadhossein et al., 2020, Si-Mohamed et al., 2017).
To date, several research PCD CT systems have been built and evaluated. A PCD-CT system using edge-on silicon detectors in a modified clinical CT scanner has demonstrated single-slice, full field-of-view (FOV) PCD-CT in phantoms (da Silva et al., 2019). PCD-CT systems using CdZnTe have been reported for extremity imaging (Panta et al., 2018), and for dual-contrast applications in phantoms and small animals (Cormode et al., 2017, Si-Mohamed et al., 2017, Muenzel et al., 2017). Recently, a whole-body PCD-CT system with a CdZnTe PCD array and 50 cm FOV (at isocenter) capable of human imaging was reported and feasibility was demonstrated in phantoms and one patient (Boccalini et al., 2021). Investigations involving a whole-body research PCD-CT system built using a modified 2nd generation dual-source CT platform, with the B-subsystem equipped with a CdTe PCD array (Kappler et al., 2014, Leng et al., 2018, Pourmorteza et al., 2016, Symons et al., 2016, Yu et al., 2016a), have shown superior imaging performance relative to EID-CT in phantoms, animals, and patients. In humans, this system has demonstrated dose-efficient ultra-high resolution (UHR) imaging without comb/grid filters (Bartlett et al., 2019, Leng et al., 2016, Pourmorteza et al., 2018), radiation dose reduction (Klein et al., 2020, Rajendran et al., 2020, Symons et al., 2016), metal artifact reduction using high-energy thresholding and a tin filter (Do et al., 2020, Zhou et al., 2019), and multi-energy capabilities (Leng et al., 2018, Pourmorteza et al., 2016, Symons et al., 2018) focusing on neurological, musculoskeletal, thoracic, vascular and abdominal imaging applications. Additionally, phantom and animal studies using this system have shown the potential for multi-contrast imaging (Ren et al., 2020, Symons et al., 2017) and improved stent delineation (Mannil et al., 2018, von Spiczak et al., 2018). While these studies have clearly demonstrated the potential benefits of this technology for clinical imaging tasks, the system had several major limitations: 1) the z-coverage of the detector was limited to 0.8–1.6 cm depending on the acquisition mode, resulting in longer scan times; 2) the in-plane FOV of the PCD array was limited to 27.5 cm (at isocenter), often resulting in data truncation when scanning body regions of size > 27.5 cm, requiring an additional low-dose, data-completion scan using the EID array of the A-subsystem; and 3) automatic exposure control was available only in the longitudinal direction – angular tube current modulation was not available. Although these were acceptable limitations for investigating the benefits of PCD technology in a research system, they present major roadblocks towards routine clinical use.
In 2020, a whole-body, full FOV, PCD-CT system (Figure 1) capable of patient scanning at clinical dose levels and dose rates was installed at our institution (Rajendran et al., 2021). This system overcomes the primary limitations of the previous dual-source based PCD-CT by offering a 50 cm scan FOV and 5.76 cm longitudinal detector coverage, with automatic exposure control in both angular and longitudinal directions. The aim of this study was to evaluate the imaging performance of this investigational PCD-CT system using a range of phantom experiments, and qualitatively demonstrate the potential clinical benefits using four patient examples. Improvements in spatial resolution from the PCD-CT system were compared to a 3rd generation dual-source CT system (SOMATOM Force, Siemens Healthineers GmbH, Forchheim, Germany).
Figure 1:
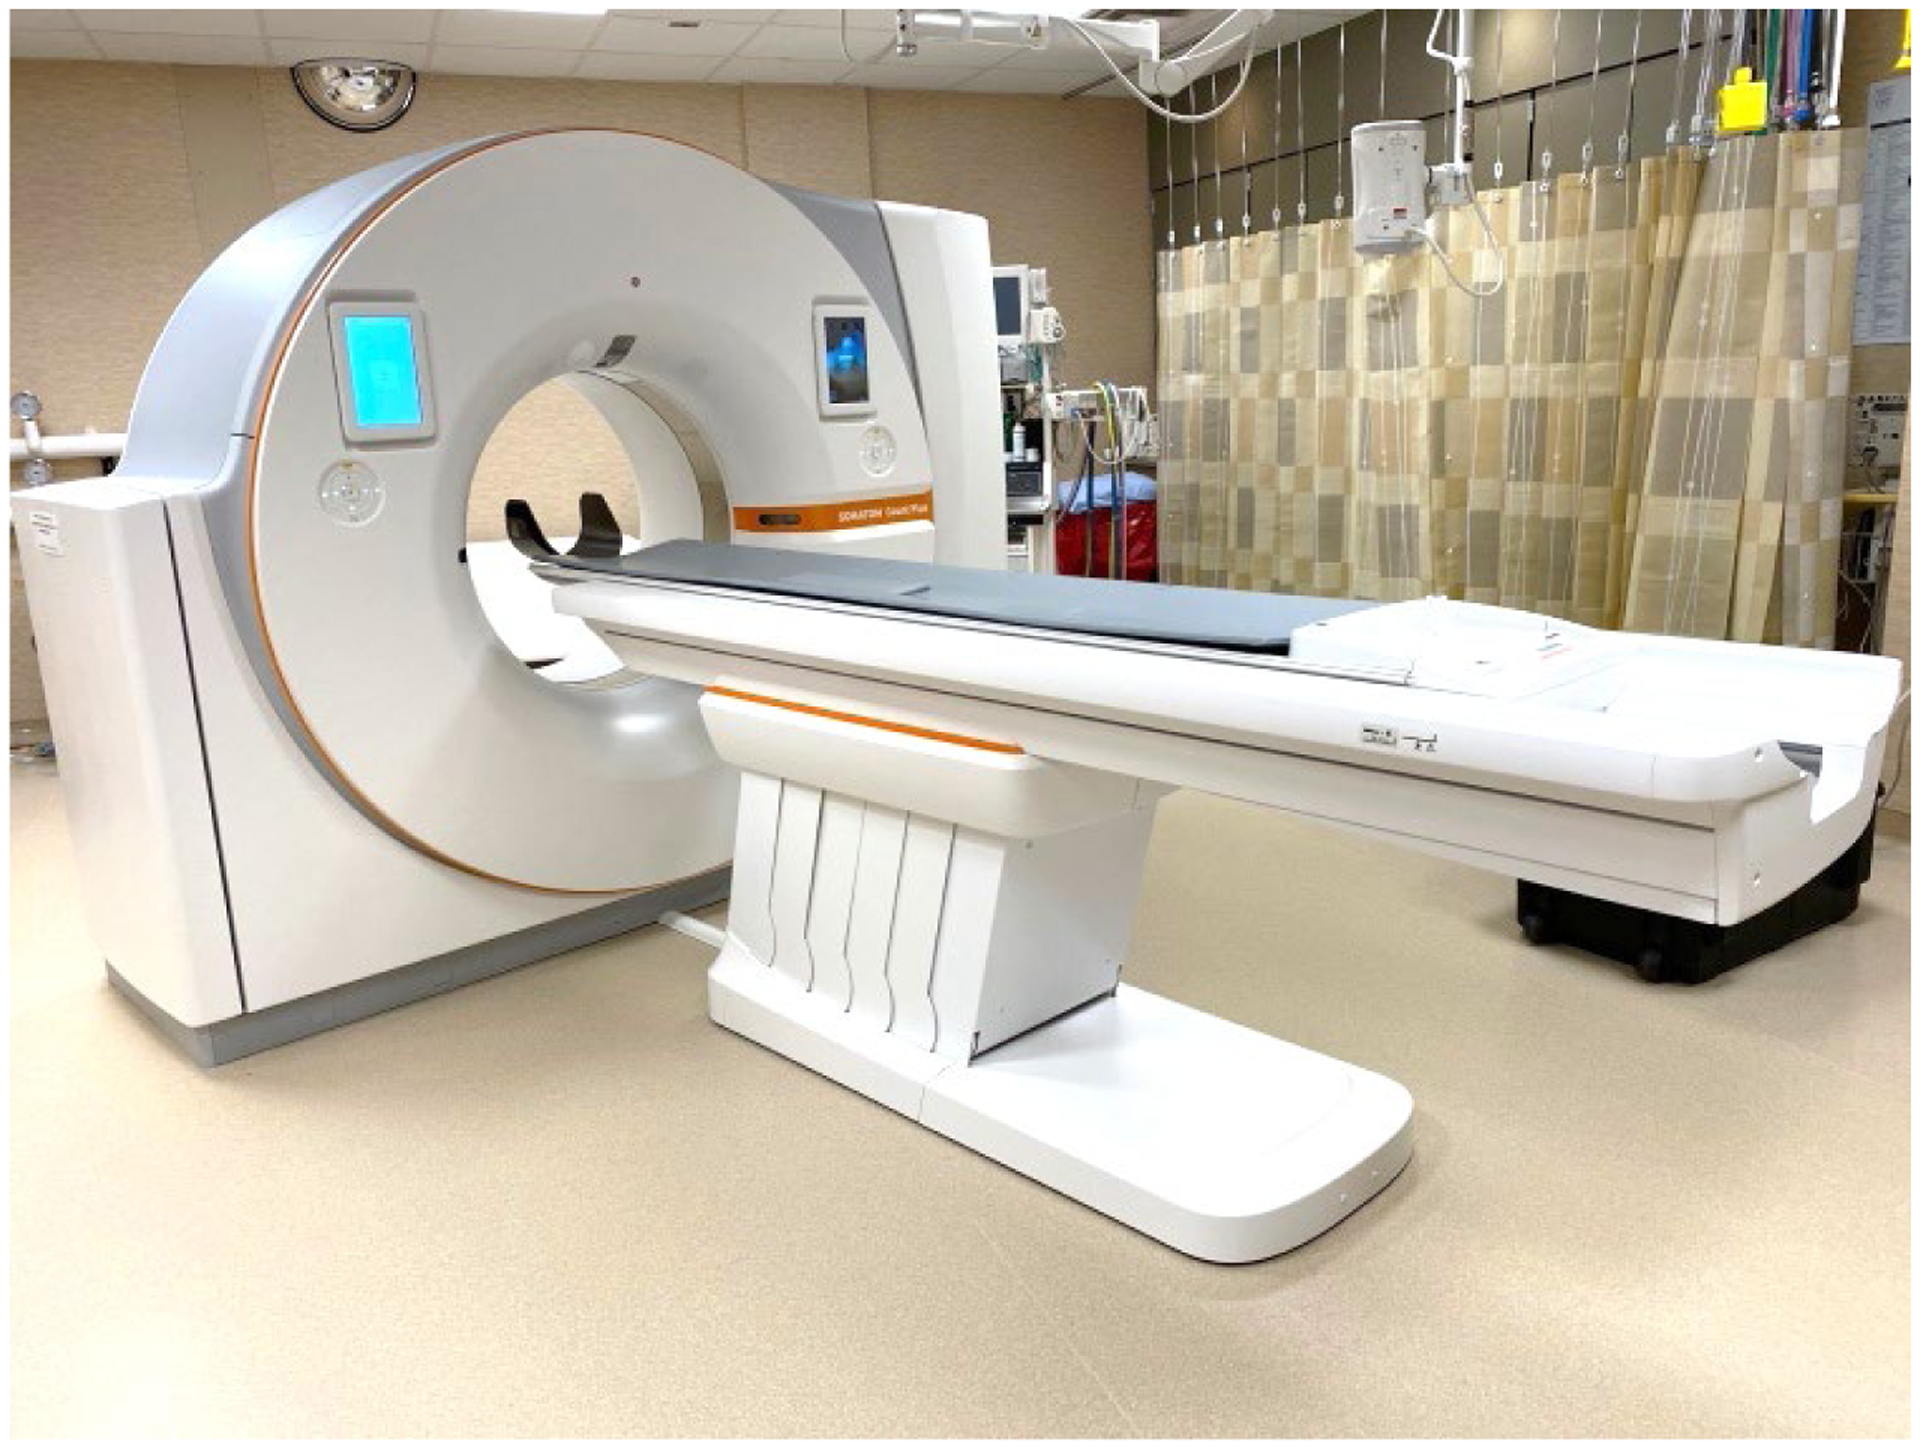
Photograph of the whole-body PCD-CT scanner.
2. Materials and Methods
2.1. Full FOV PCD-CT system
A whole-body PCD-CT system (SOMATOM Count Plus, Siemens Healthineers GmbH, Forchheim, Germany) was used in this study. This single-source PCD-CT scanner is equipped with a 1.6 mm-thick CdTe PCD array; the scan FOV (50 cm) and detector z-coverage (5.76 cm) are comparable to current state-of-the-art clinical CT systems. The system is equipped with a Vectron X-ray tube (Siemens Healthineers GmbH), as is used in 3rd generation dual-source CT scanners (SOMATOM Force). The focal spot size is automatically selected based on the acquisition mode (standard vs. UHR). Filtered back projection (weighted-filtered back projection (Stierstorfer et al., 2004)) and iterative reconstruction (prior-based noise reduction, Siemens Healthineers GmbH) techniques are available for CT image reconstruction. Angular and longitudinal tube current modulation (CARE Dose4D, Siemens Healthineers GmbH) are available for automatic exposure control and patient dose optimization. The technical specifications of the PCD-CT scanner are given in Table 1.
Table 1:
Overview of technical specifications of the PCD-CT system
| Tube voltage | 90 kV, 120 kV, 140 kV |
| Tube power | Up to 120 kW |
| Collimation (no. detector rows × slice width) | 144 × 0.4 mm - standard multi-energy mode 120 × 0.2 mm - UHR mode |
| Shaped filter | Standard and narrow |
| Energy thresholds | 2 thresholds for multi-energy mode 1 threshold for UHR mode |
| Rotation time | 0.33s, 0.5s, 1.0s |
| Pitch range | 0.35 – 1.20 |
| Focal spot size | 0.4 × 0.5 mm2 (small) 0.6 × 0.7 mm2 (medium) 0.8 × 1.1 mm2 (large) |
The PCD array consists of sub-pixels each of physical size 0.275 × 0.322 mm2, which corresponds to 0.150 × 0.176 mm2 at isocenter. The sub-pixels are grouped and read out in 2 × 2 grids for the standard multi-energy mode (at present 2 energy thresholds) or read out individually for the UHR mode (at present at only 1 threshold). Due to the collimator blades present in between every 6 sub-pixels in the z direction (see Figure 2), the effective sub-pixel size in the z-direction is 1.13× the native sub-pixel size (i.e. 1.13 × 0.176 mm at isocenter), yielding an effective minimum slice width of 0.2 mm for the UHR mode and 0.4 mm for the standard mode (Flohr et al., 2020). There is no charge-sharing correction at present for either of the acquisition modes.
Figure 2:
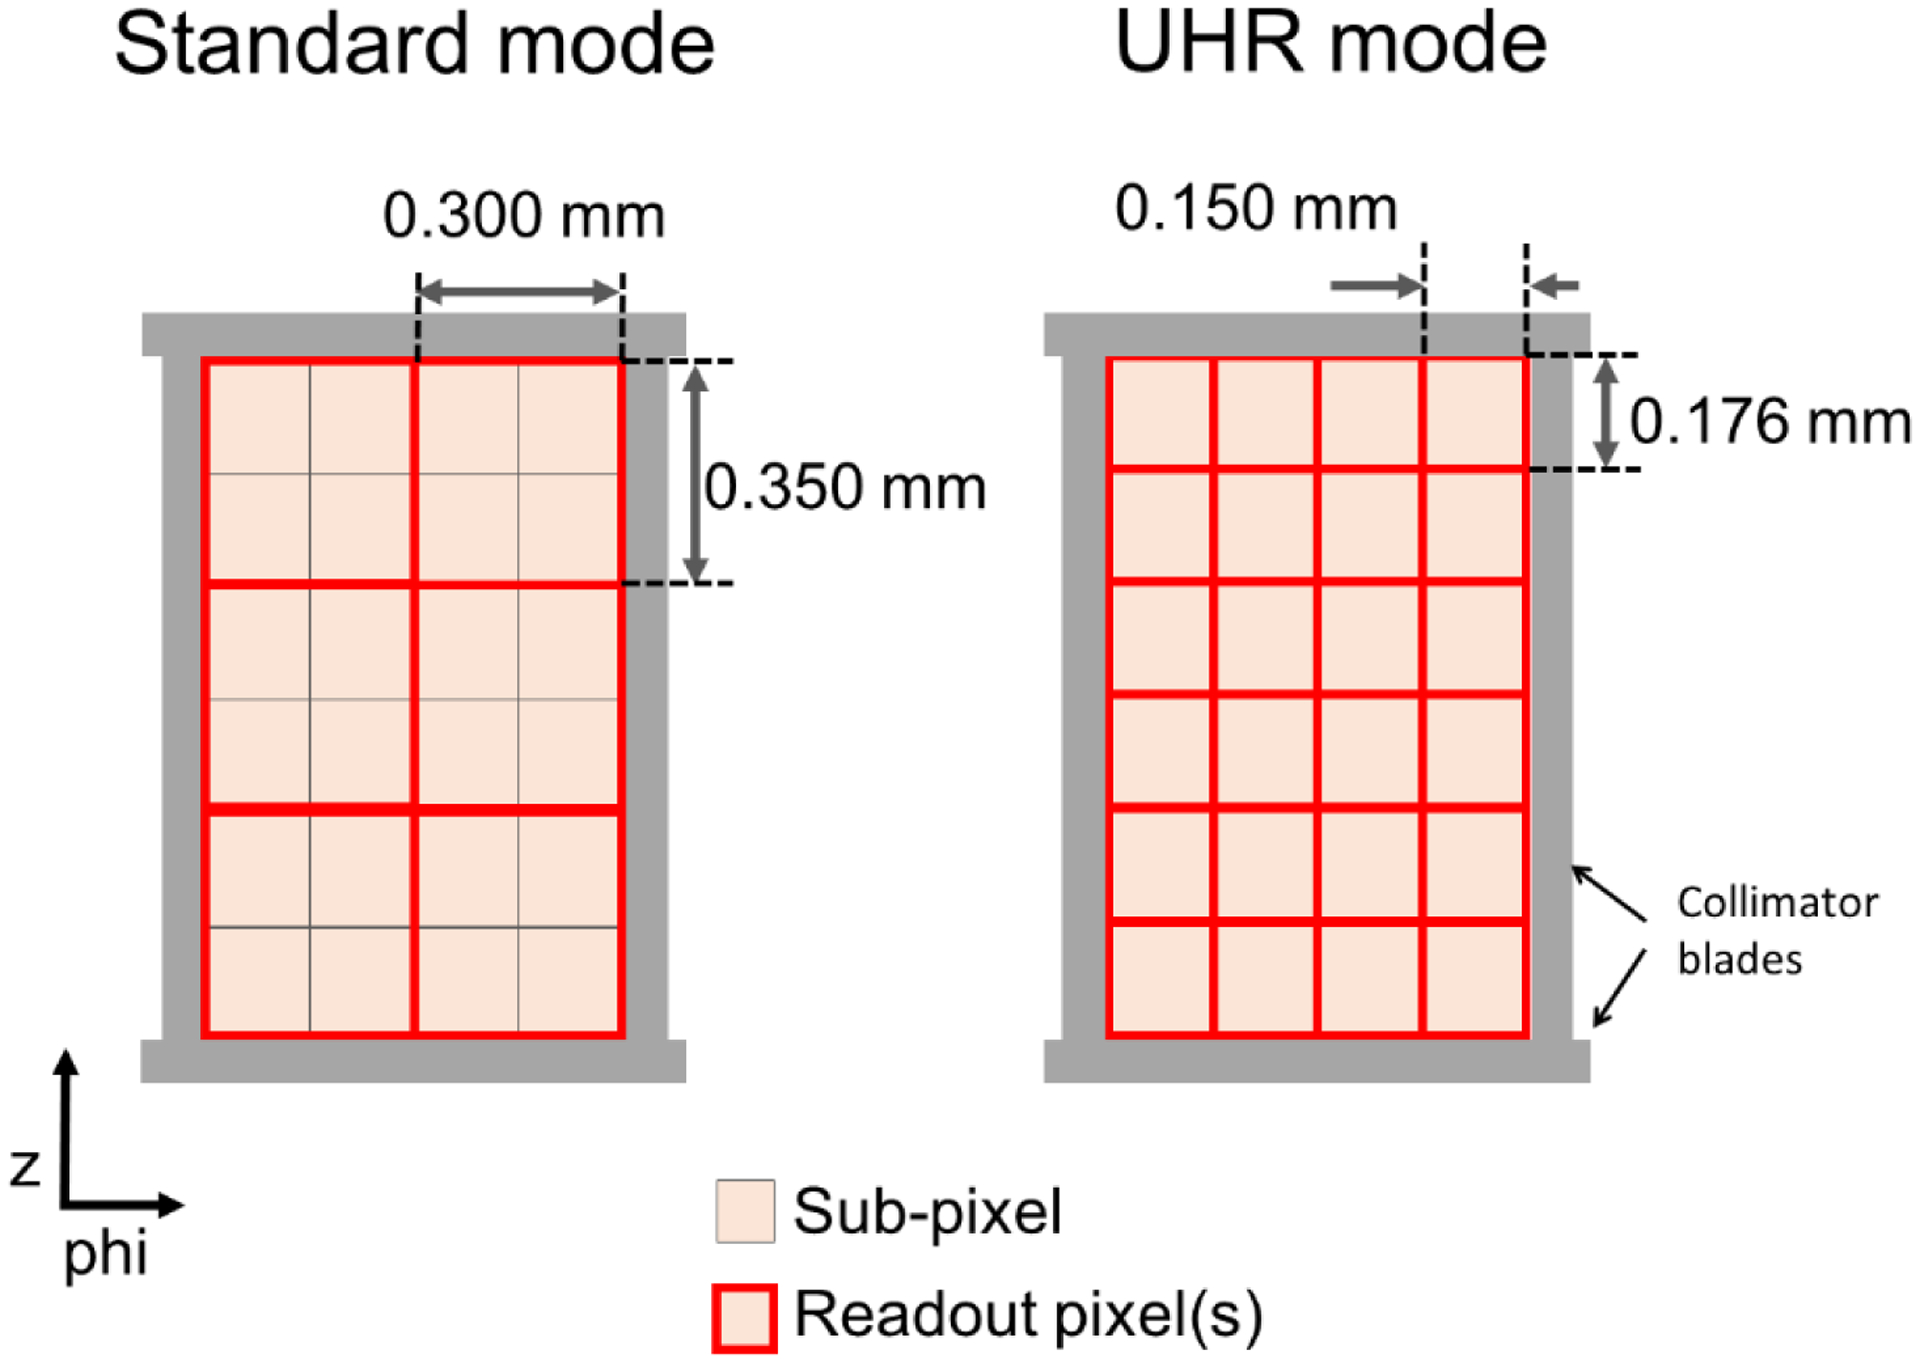
Schematic diagram of pixel layout in the standard and UHR modes of the full FOV PCD-CT system. Each sub-pixel is read out individually for the UHR mode or binned into 2×2 groups for the standard mode. The displayed pixel dimensions are at isocenter.
2.2. Image uniformity, CT number accuracy, image noise and noise power spectra
Image uniformity and CT number accuracy were assessed using the image uniformity module of the American College of Radiology (ACR) CT accreditation phantom (CT ACR 464, Sun Nuclear Corporation, WI, USA). The phantom was scanned using 144 × 0.4 mm collimation, 120 kV, 20 and 65 keV energy thresholds, 152 effective mAs, 0.5s rotation time and 0.6 pitch, with radiation dose matched to that of the routine abdomen CT protocol used in our clinical practice (12 mGy CTDIvol-32 cm). PCD-CT images were reconstructed with the medium-sharp body kernel (Br44) used in our clinical practice for routine abdomen CT exams. Images were reconstructed at 3.0 mm slice thickness, 512×512 matrix size using iterative reconstruction (IR, strength 3). CT number accuracy and image uniformity were measured as per the ACR CT accreditation guidelines; circular regions-of-interests (ROIs) were placed in the central (1 ROI) and peripheral (4 ROIs) uniform regions of the phantom and the difference between peripheral ROIs and the central ROI were measured for the low- and high-energy threshold images (20–120 keV and 65–120 keV, respectively).
The same scan data were used to compute the noise power spectrum (NPS) for both WFBP and IR images to evaluate the influence of the latter on image noise texture. Images were reconstructed with Br44 at 3 mm slice thickness using both WFBP and IR (strengths 1 and 3). NPS was calculated using 20 independent square ROIs (13.1 × 13.1 mm2) equi-radially placed in a 114.8 mm-diameter circle corresponding to the uniform region of the low-energy threshold image (20–120 keV). The NPS was calculated for each square ROI separately using the method described by Siewerdsen et al. (Siewerdsen et al., 2002), and averaged to obtain the final NPS.
For visual assessment of spatial resolution (bar pattern) and image noise between EID-CT and PCD-CT, we scanned the ACR CT accreditation phantom on an EID-CT system (SOMATOM Force, 192 × 0.6 mm, abdomen protocol, 120 kV, 180 effective mAs, 0.5s rotation time, and 0.6 pitch). The same phantom was scanned on the PCD-CT system using the standard mode (with the same scan parameters used for image uniformity test described earlier) and the UHR mode (120 × 0.2 mm collimation, 20 keV energy threshold, 150 effective mAs, 0.33s rotation time, and 0.6 pitch). The EID-CT scan and PCD-CT scans were acquired at matched dose (12 mGy CTDIvol-32 cm). All images were reconstructed with a Br44 kernel (matched between EID-CT and PCD-CT), 3 mm slice thickness, 1024×1024 matrix size using FBP. Additionally, a dedicated sharp kernel, Br89 was used to reconstruct PCD-CT UHR images. The purpose of this test was to visually compare the spatial resolution (bar pattern module) and image noise between PCD-CT and EID-CT at matched spatial resolution (Br44 kernel), and at increased spatial resolution (Br89 kernel) for the PCD-CT system operating in UHR mode.
2.3. Spatial resolution – modulation transfer function and section sensitivity
In-plane spatial resolution was measured using a thin wire phantom (25 μm diameter tungsten) and the Modulation Transfer Function (MTF) was calculated. The phantom was scanned with the wire positioned parallel to the z-direction. Images were acquired using the UHR mode (120 × 0.2 mm collimation, 120 kV, 320 effective mAs, 0.33s rotation and 0.5 pitch). PCD-CT images (20–120 keV) were reconstructed using WFBP at 1024×1024 matrix size, 0.4 mm slice thickness, and three kernels: the sharpest kernel available in the standard acquisition mode (Br68), and two dedicated sharp kernels available only for the UHR mode – Br89 and Br96. The MTF curves were calculated using the Fourier transform of the point-spread function and the 10% MTF values are reported for each kernel. For comparison, the same phantom was also scanned on a state-of-the-art commercial EID-CT system (SOMATOM Force) using a standard abdomen protocol (192 × 0.6 mm collimation, 120 kV, 400 effective mAs, 0.5 s rotation and 0.6 pitch). EID-CT images were reconstructed at 0.6 mm slice thickness using WFBP, 1024×1024 matrix size, and the sharpest body kernel (Br69) available on the EID-CT scanner.
Section Sensitivity Profile (SSP) was used to assess the longitudinal resolution of the PCD-CT system. A gold foil (a disc of 25 μm thickness and 1 mm diameter) embedded in a Lucite cylindrical phantom (slice sensitivity phantom, QRM GmbH, Möhrendorf, Germany) was scanned using the PCD-CT system. PCD-CT data were acquired for a UHR head protocol (120 × 0.2 mm, 120 kV, 180 effective mAs, 1.0s rotation time). For comparison, the same phantom was scanned using a routine head protocol on EID-CT (SOMATOM Force, 192 × 0.6 mm, 120 kV, 250 effective mAs, 0.5s rotation time). WFBP and a 512×512 matrix were used to reconstruct PCD-CT with the Hr89 head UHR kernel and EID-CT images with the Hr69 head kernel. The smallest slice thickness available (0.2 mm for PCD-CT and 0.6 mm for EID-CT) and smallest slice increment (0.05 mm for PCD-CT and 0.1 mm for EID-CT) were used for SSP measurements.
2.4. Material decomposition and virtual monoenergetic imaging
A multi-energy CT phantom (MECT phantom, Sun Nuclear Corporation, WI, USA) was scanned on the PCD-CT system to evaluate material decomposition and virtual monoenergetic imaging (VMI) performance. Solid iodine inserts at concentrations of 2, 5, 10 and 15 mg/mL provided by the phantom vendor were placed in the cylindrical holes of the MECT phantom. The phantom also included solid cylinders containing 200 and 400 mg/cc of hydroxyapatite. The phantom was scanned using the standard multi-energy acquisition mode (144 × 0.4 mm collimation) at 120 kV, 20 and 65 keV energy thresholds, 210 effective mAs, 36 mGy CTDIvol-16 cm and 0.5s rotation time, similar to the routine head protocol used in our clinical practice. PCD-CT images were reconstructed using IR (strength 3) with a quantitative kernel (Qr40) at 3 mm slice thickness and 512×512 image matrix size. Vendor-specific iodine and bone beam hardening corrections were applied to the multi-energy data during image reconstruction. Material decomposition was performed using a prior knowledge aware iterative denoising (MD-PKAID) technique (Tao et al., 2018). This image-domain material decomposition utilizes data redundancy between the full spectrum low-energy threshold image and the decomposed material maps to achieve noise reduction. Details of this technique can be found elsewhere (Tao et al., 2018). The low-energy threshold image (20–120 keV) was used as the image prior, and material decomposition was performed to obtain iodine, hydroxyapatite and water maps. Mass densities (mean and standard deviation) of iodine and hydroxyapatite were measured using ROIs placed in individual material inserts, and are reported in units of mg/cc. The estimated mass densities were compared with the known values of material concentrations (ground truth) and root-mean-squared-errors (RMSE) were calculated.
The multi-energy CT phantom images were also used to evaluate the quantitative accuracy of VMIs from the PCD-CT system at multiple energy levels. VMIs corresponding to 40, 50, 60 and 70 keV energy levels were synthesized using vendor-provided software (ReconCT, Siemens Healthineers GmbH, Forchheim, Germany). The selected keV range is suitable for assessing iodine quantification accuracy in VMI images, since low-keV VMIs (e.g. 40–60 keV) are typically used for contrast-enhanced DECT applications (Albrecht et al., 2019). The CT numbers from VMIs were compared with reference standard values based on the iodine concentrations and the corresponding attenuation coefficients at the specified VMI energy level obtained from the U.S. National Institutes of Standards and Technology (NIST) (Berger et al., 2010). Mean and standard deviation of CT numbers using representative ROIs were measured and the percent changes in mean iodine CT numbers for VMIs compared to the threshold low image are reported. The deviation between measured VMI CT numbers and reference values (NIST) for each iodine concentration are reported using percentage error.
2.5. Demonstration of potential clinical benefits using patient examples
Four patients referred for clinically indicated chest, temporal bone, contrast-enhanced abdomen, and head CT angiography (CTA) exams were scanned on the PCD-CT system after their clinical scans using the EID-CT scanner. This prospective study was approved by the institutional review board (Mayo Clinic, Rochester, MN, USA) with written informed consent obtained from the patients prior to scanning on the PCD-CT system. Details of data acquisition and image reconstruction are given in Table 2.
Table 2:
Scan and reconstruction parameters for patient exams
| Chest | Temporal bone | Contrast-enhanced abdomen | Head CTA | ||||
|---|---|---|---|---|---|---|---|
| Modality | EID-CT | PCD-CT | EID-CT | PCD-CT | PCD-CT | PCD-CT | |
| Scanner platform | SOMATOM Force | SOMATOM Count Plus | SOMATOM Force | SOMATOM Count Plus | SOMATOM Count Plus | SOMATOM Count Plus | |
| Acquisition mode | Standard (single-energy) | UHR | UHR (comb-filter) | UHR | Standard (multi-energy) | Standard (multi-energy) | |
| Collimation (mm) | 192 × 0.6 | 120 × 0.2 | 64 × 0.6 | 120 × 0.2 | 144 × 0.4 | 144 × 0.4 | |
| X-ray focal spot size (mm2) | 0.8 × 1.1 | 0.6 × 0.7 | 0.4 × 0.5 | 0.4 × 0.5 | 0.8 × 1.1 | 0.8 × 1.1 | |
| Tube voltage (kV) | 120 | 120 | 120 | 120 | 140 | 140 | |
| Automatic Exposure (CARE Dose4D) | ON | ON | ON | OFF | ON | ON | |
| Tube current time product (mAs) | 80 (QRM) | 70 (QRM) | 400 (QRM) | 182 (effective) | 140 (QRM) | 150 (QRM) | |
| CTDIvol (mGy, size) | 5.3 (32 cm) | 5.3 (32 cm) | 49.9 (16 cm) | 31.6 (16 cm) | 11.7 (32 cm) | 16.1 (16 cm) | |
| Pitch | 1.2 | 1.2 | 0.35 | 1.2 | 0.8 | 1.2 | |
| Rotation time (s) | 0.25 | 0.33 | 1.0 | 1.0 | 0.5 | 0.33 | |
| Energy threshold (keV) | NA | 20 | NA | 20 | 20, 70 | 20, 70 | |
| Reconstruction technique | ADMIRE | PNR | ADMIRE | PNR | WFBP | PNR | PNR |
| Reconstruction kernel (IR strength) | Qr54 (3) | Qr76 (1,3) | Ur77 (3), Ur89 (3) | Hr76 (3), Hr89 (3) | Br44 | Br44 (1,3) | Qr40 (3) |
| Slice thickness (mm) | 0.6 | 0.6, 0.2 | 0.4 | 0.4 | 3.0 | 3.0 | |
| Slice increment (mm) | 0.5 | 0.5, 0.1 | 0.3 | 0.3 | 3.0 | 3.0 | |
| Reconstruction FOV (mm) | 340 | 340 | 80 | 80 | 380 | 250 | |
| Image matrix size | 1024 | 1024 | 512 | 512 | 512 | 512 | |
EID-CT: Energy-integrating detector-based computed tomography; PCD-CT: Photon-counting detector-based computed tomography; CTA: CT angiography; FOV: Field of view; CTDIvol: volume CT dose index; QRM: Quality reference mAs; IR: Iterative reconstruction; WFBP: Weighted filtered back projection; ADMIRE: Advanced modeled iterative reconstruction; PNR: Prior-based noise reduction
EID-CT images from the chest exam were reconstructed using a Qr54 kernel (standard chest kernel used in our clinical practice) at 0.6 mm slice thickness. The PCD-CT images were reconstructed with a dedicated sharp Qr76 kernel at 0.6 mm. This dedicated kernel preserves high spatial frequencies that are not present on the EID CT and is used to demonstrate the additional capabilities of the PCD-CT system; matching the reconstruction kernels between PCD and EID systems would result in blurring of the additional high frequency information available on the PCD CT, masking the higher resolution performance available with that system. The 0.6 mm images were reconstructed with WFBP and IR (strengths 1 and 3) to demonstrate the performance of IR in comparison to WFBP in preserving anatomic details while reducing image noise (measured in uniform ROIs). Additionally, 0.2 mm slice thickness images, available only on the PCD-CT system, were reconstructed to assess anatomic delineation in thin slice images that are beyond the capability of commercial EID-CT.
The temporal bone scan on EID-CT was performed using the comb-filter-based UHR mode. The comb filter reduces the detector pixel aperture to enable UHR imaging (Flohr et al., 2007). However, this approach is dose inefficient since the comb filter blocks x-rays that have already passed through the patient. In comparison, PCD-CT achieves UHR capability using smaller detector pixels (120 × 0.2 mm collimation) without the need for comb filters (Leng et al., 2016). Right temporal bone EID-CT images were reconstructed with Ur77 (routine UHR kernel used in our clinical practice). The corresponding kernel (matched sharpness) for PCD-CT was Hr76 based on MTF measurements. Additionally, EID-CT and PCD-CT images were also reconstructed with Ur89 and Hr89 kernels, respectively, to compare the imaging performance using dedicated, very-sharp kernels beyond Ur77.
For the contrast-enhanced abdomen scan, a 100 mL bolus of iodinated contrast (Omnipaque 300, GE Healthcare, WI, USA) was intravenously injected at 3 mL/s. The PCD-CT scan was performed 70s after the start of the contrast injection. PCD-CT images were reconstructed with a medium sharp Br44 kernel (standard kernel used in our clinical practice) using WFBP and IR (strengths 1 and 3) to assess the influence of IR on noise texture and overall image quality. Image noise was measured using circular ROIs placed in a homogeneous region in the liver.
For the head CTA scan, a 100 mL bolus of iodinated contrast (Omnipaque 350, GE Healthcare, WI) was intravenously injected at 4 mL/s for the PCD-CT scan. Real-time bolus tracking with a trigger threshold of 100 HU at the ascending aorta and a 7s post-trigger scan delay was used. PCD-CT images were reconstructed using a quantitative Qr40 kernel with IR technique (strength 3) and 50 keV virtual monoenergetic images and virtual non-contrast (VNC) images were generated to demonstrate the multi-energy performance of the PCD-CT system. The VNC image was generated using vendor-provided software (ReconCT, Siemens Healthineers GmbH, Forchheim, Germany) based on a two-material decomposition (iodine and water). Iodine and bone beam hardening corrections were applied to the multi-energy images prior to the generation of VMI and VNC images. The CT images from all four patient exams were qualitatively assessed by one radiologist. Spatial resolution and anatomic delineation, and image noise and artifacts were qualitatively evaluated.
3. Results
3.1. Image uniformity, CT number accuracy, image noise and noise power spectra
CT number and uniformity measurements from the uniformity module of the ACR CT phantom are shown in Figure 3. PCD-CT images corresponding to low energy threshold (20–120 keV) and high energy threshold (65–120 keV) are displayed. The mean CT numbers for water in all ROIs were within the ±5 HU range, meeting the ACR accreditation requirements. The maximum difference between a peripheral ROI and the central ROI was 2.6 HU and −1.1 HU for the low energy and high energy threshold images, respectively, again meeting the ACR CT accreditation requirements.
Figure 3:
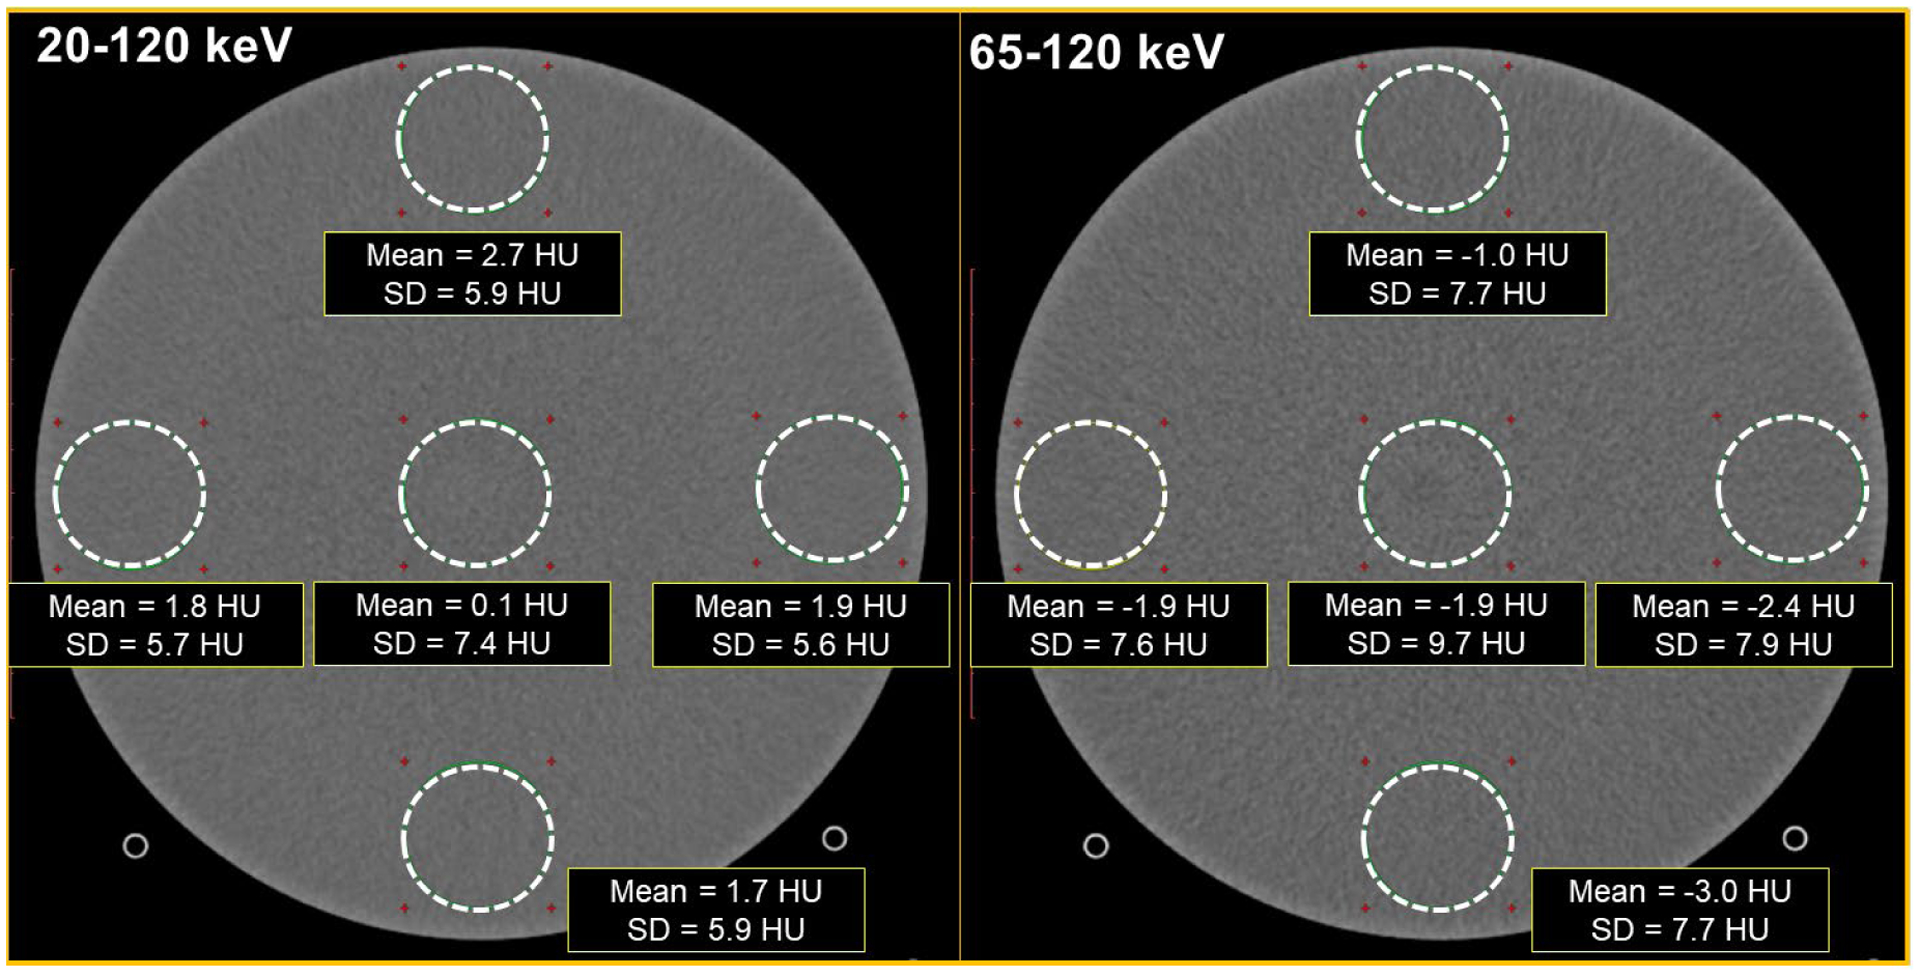
PCD-CT images from the image uniformity module of the ACR CT accreditation phantom. The mean CT number in the ROIs, and the CT number difference between the peripheral ROIs and the central ROI were within the ±5HU limit for the ACR image uniformity criteria. Display FOV = 210 mm, matrix size = 512 × 512, reconstructed with IR (strength 3), Br44 kernel at 3.0 mm slice thickness. Window width/level = [400/40] HU
Figure 4 shows the ROI placement for NPS calculation and the corresponding NPS curves for images reconstructed using WFBP and IR at strengths 1 and 3. The NPS magnitude progressively decreased with increasing IR strength in comparison to WFBP. The overall shape of the NPS curves from IR was similar to that of WFBP with no shifts in the frequency shifts of the NPS peak values, suggesting that the IR technique for PCD-CT yields similar noise texture as WFBP while also reducing image noise. Figure 5 shows the bar pattern module and image noise measurements from the uniformity module for EID-CT and PCD-CT. At matched kernel resolution (Br44 kernel), the PCD-CT standard mode demonstrated similar image noise compared to EID-CT (8.6 HU vs. 8.7 HU), whereas the UHR mode from PCD-CT demonstrated lower image noise (7.4 HU). This reduction in image noise can be attributed to the smaller detector pixel and finer detector sampling from the UHR mode of PCD-CT, which has shown to reduce image noise if the final image resolution (determined by the reconstruction kernel) is matched to that of EID-CT, or consequently reduce dose when the image noise and kernels are matched between PCD-CT UHR and EID-CT (Klein et al., 2020, Leng et al., 2018, Rajendran et al., 2020). When using a dedicated sharp kernel for the UHR mode in PCD-CT, increased image noise was observed because of higher spatial frequencies being resolved by the Br89 kernel. Spatial resolution assessed using the bar pattern module demonstrated that up to 8 lp/cm can be resolved using the Br44 kernel, for both EID-CT and PCD-CT (standard and UHR), and all bar patterns (up to 12 lp/cm) are resolved when the images from PCD-CT UHR mode are reconstructed with a dedicated sharp kernel, Br89.
Figure 4:
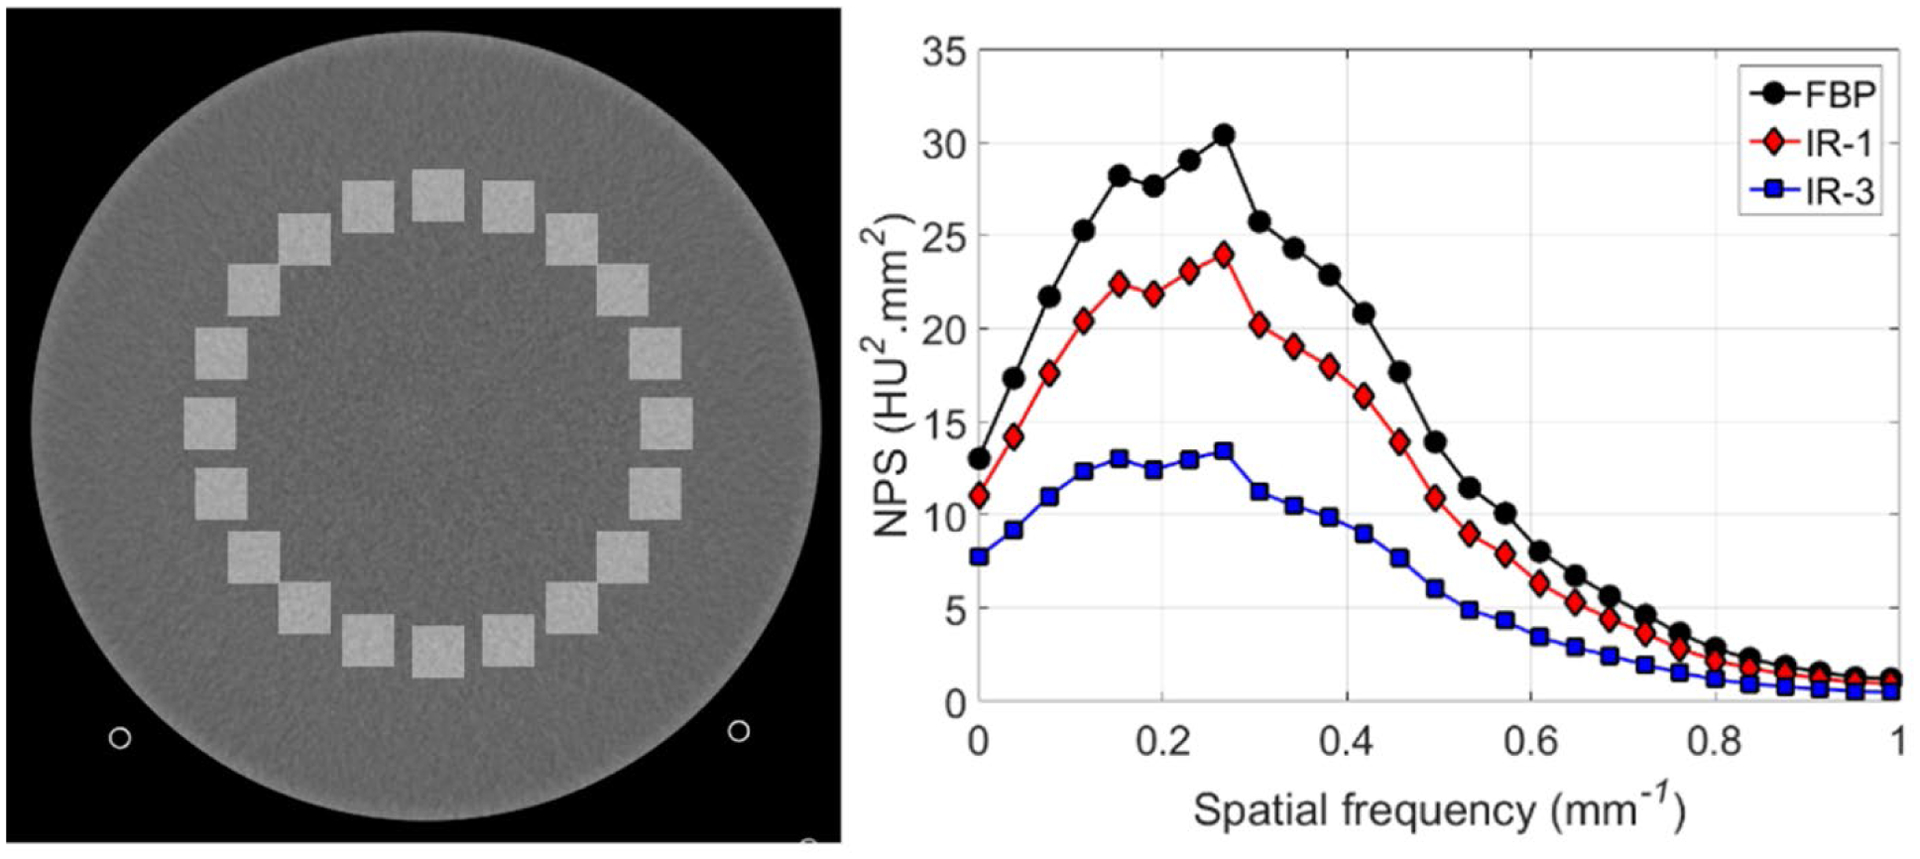
Square ROI placement (left) for NPS calculation using the 20–120 keV image from the uniformity module of the ACR CT phantom, and the corresponding NPS plots (right) from WFBP and IR images (strengths 1 and 3). Display FOV = 210 mm, matrix size = 512 × 512, Reconstructed with WFBP and IR-1 and IR-3, Br44 kernel at 3.0 mm slice thickness. Display window/level = [400/40] HU
Figure 5:
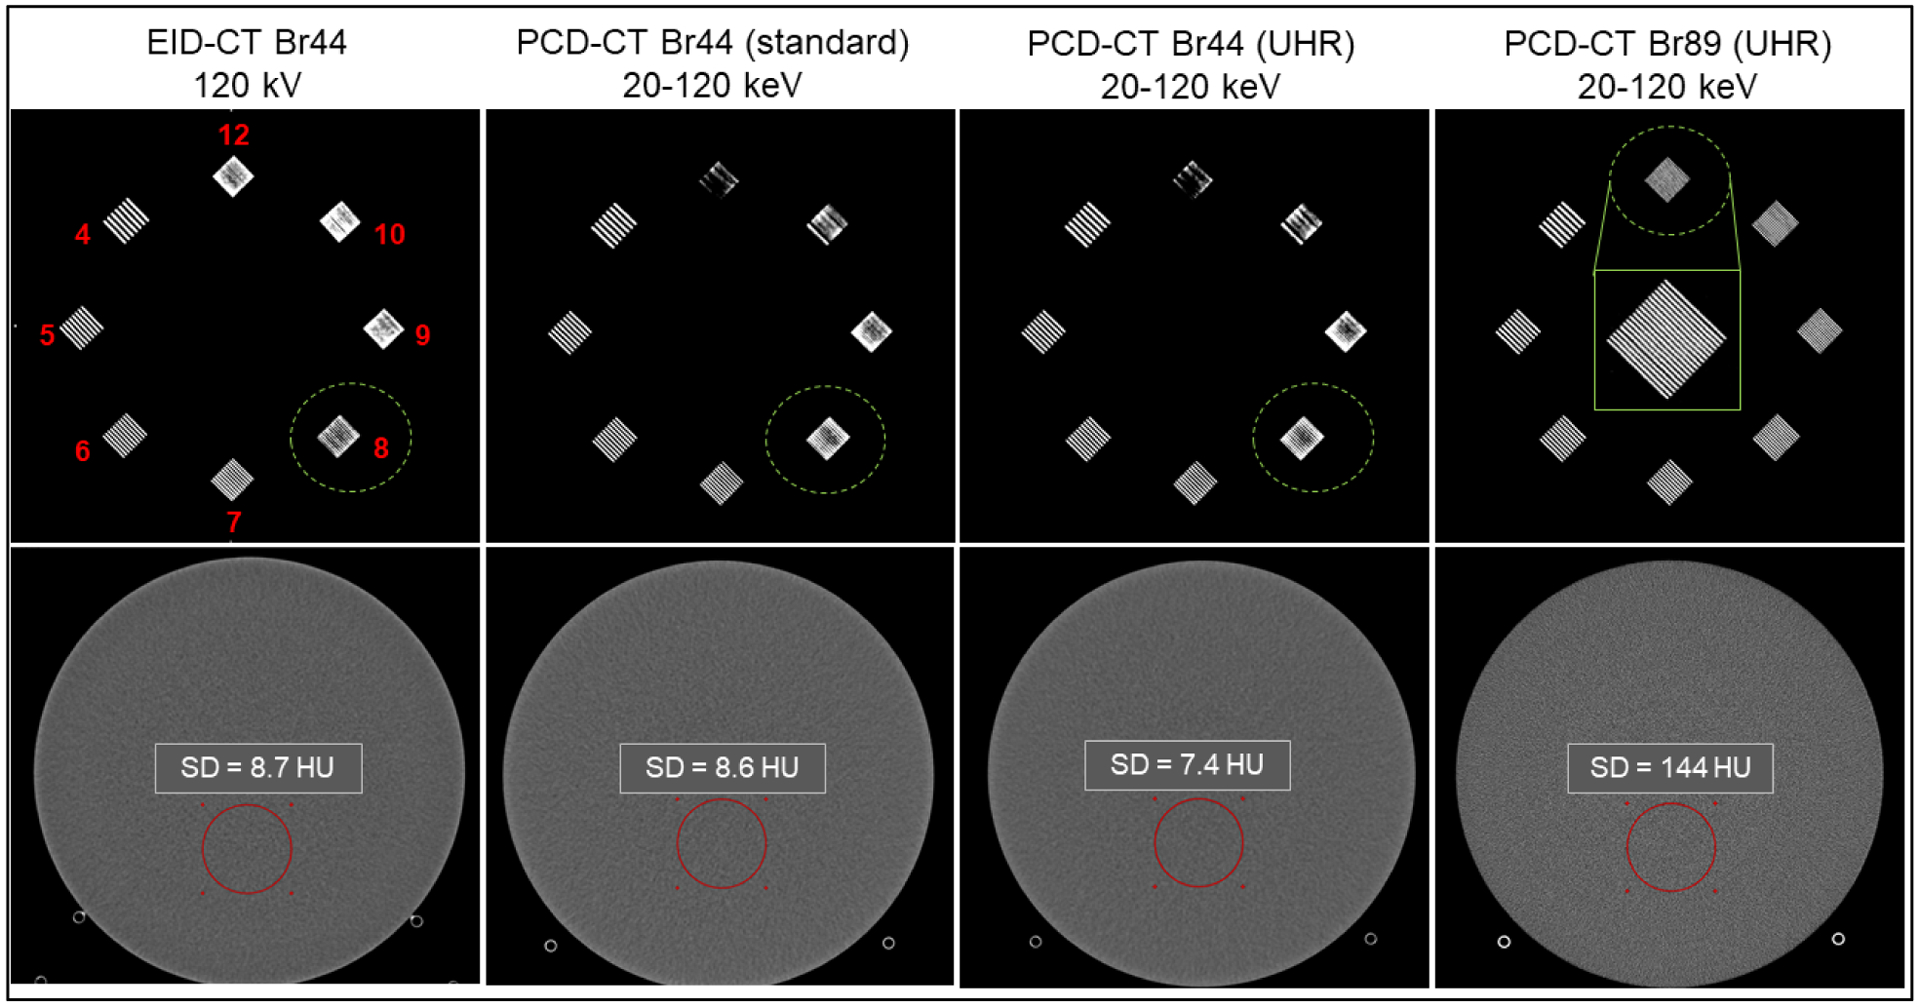
The spatial resolution module (top row, line-pairs/cm numbered in top left image) and the uniformity module (bottom row) from the ACR CT phantom acquired using EID-CT and PCD-CT. Up to 8 lp/cm were resolved using EID-CT, PCD-CT (standard and UHR mode) when a medium smooth kernel (Br44) is used. All bar patterns (up to 12 lp/cm shown in the inset image in row 1, column 4) were resolved using the PCD-CT UHR mode when a dedicated sharp kernel Br89 was used. ROI standard deviation measured in the Br44 images was similar between EID-CT and PCD-CT (standard mode), however lower image noise was observed in PCD-CT UHR Br44 image. The Br89 image showed substantially higher image noise compared to Br44 images.
3.2. Spatial resolution – modulation transfer function and section sensitivity profile
Spatial resolution measured using MTF and SSP is shown in Figure 6. The MTF curves are shown for three body kernels from PCD-CT namely Br68, Br89 and Br96 which had 10% MTF values of 14.2 cm−1, 30.3 cm−1, and 36.9 cm−1, respectively. For comparison, the sharpest EID-CT kernel available for body scanning, Br69, has a 10% MTF value of 15.2 cm−1. Of note, the Br68 kernel is the sharpest available kernel in the PCD-CT standard acquisition mode, whereas Br89 and Br96 are dedicated UHR kernels available only for data acquired using the UHR acquisition mode. The spatial cut-off frequency (0% MTF) for UHR mode with the dedicated Br96 kernel was 40 cm−1, which results in a limiting spatial resolution of 125 μm. For the SSP measurement, a 0.33 mm full-width-half-maximum (FWHM) was achieved on the PCD-CT for the thinnest available slice thickness of 0.2 mm, compared to a FWHM of 0.72 mm for the thinnest available slice thickness of 0.6 mm on the EID-CT.
Figure 6:
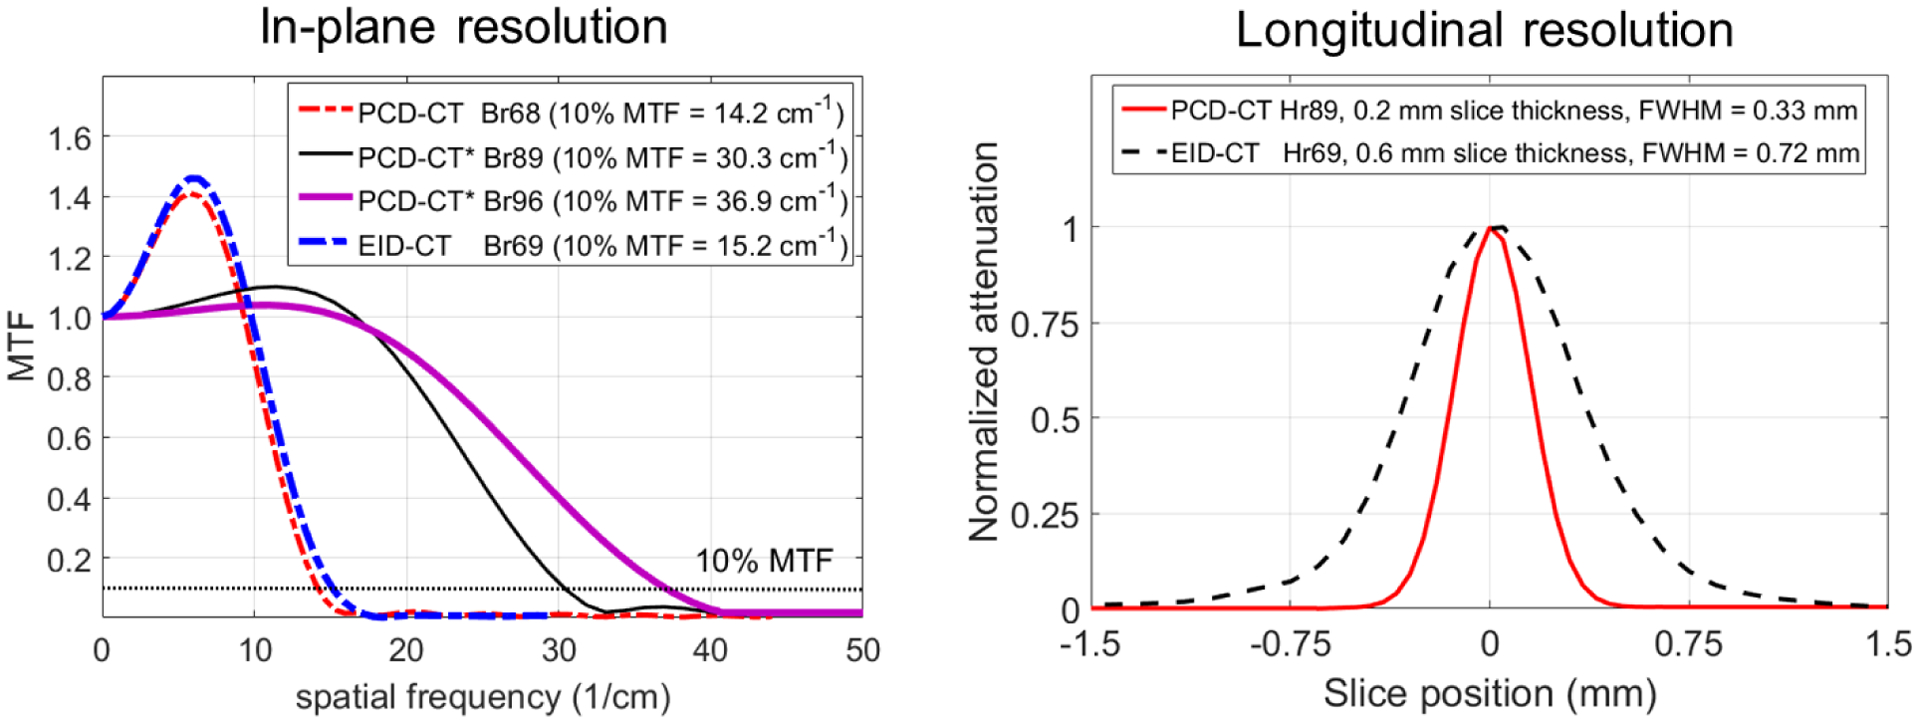
MTF curves (left) from PCD-CT (three body kernels: standard sharp kernel Br68; and dedicated UHR kernels Br89 and Br96, marked by * in the plot legend) and EID-CT (Br69, sharpest available). The Br96 from PCD-CT UHR mode demonstrated the highest spatial resolution (10% MTF = 36.9 cm−1). Section sensitivity profiles (right) showed the smallest FWHM (0.33 mm) for the UHR mode with Hr89 kernel from PCD-CT at the smallest available slice thickness of 0.2 mm. For comparison, EID-CT (Hr69, sharpest head kernel available) showed a FWHM of 0.72 mm for a minimum slice thickness of 0.6 mm available on this system.
3.3. Material decomposition and virtual monoenergetic imaging
The results from material decomposition are shown in Figure 7. The iodine and hydroxyapatite maps show clear delineation of the materials at all concentrations. The estimated iodine and hydroxyapatite concentrations compared with the ground truth (Table 3) showed an RMSE of 0.42 mg/cc and 11.73 mg/cc, respectively.
Figure 7:
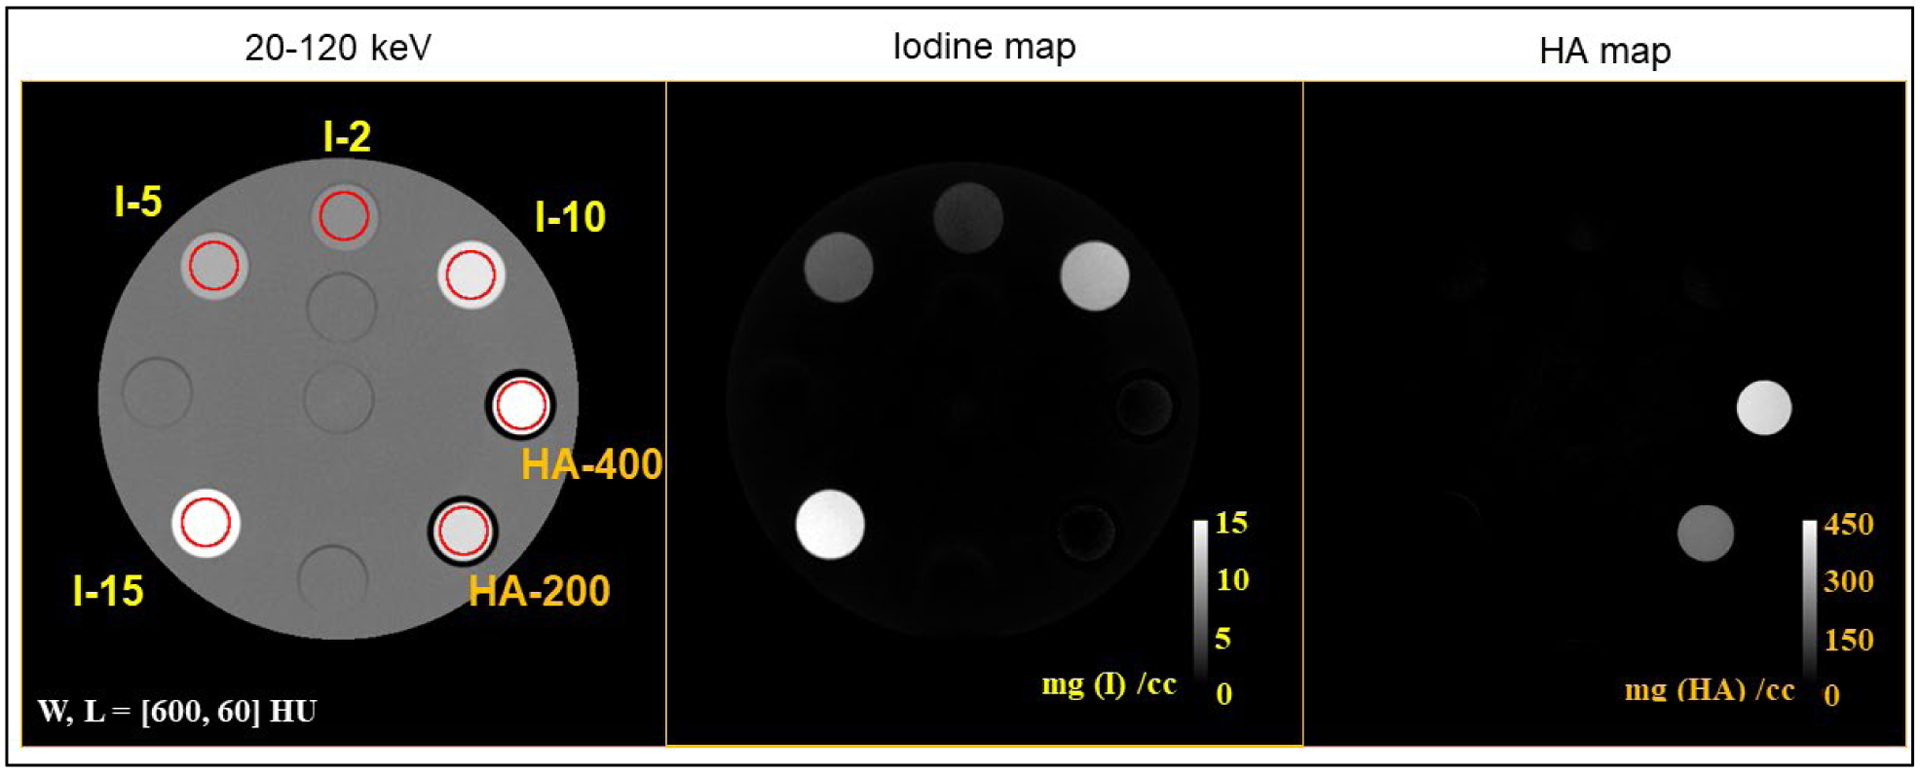
Material decomposition results for iodine solutions and solid hydroxyapatite (HA) inserts. The 20–120 keV image shows the different concentrations of iodine (labeled I-2 to I-15, with the numbers representing concentrations in mg/cc) and hydroxyapatite (labeled HA-200 and HA-400 for concentrations 200 and 400 mg/cc). The iodine and bone maps show clear delineation of iodine and hydroxyapatite at all concentrations.
Table 3:
Measured concentrations for iodine and hydroxyapatite compared with ground truth.
| Iodine | Hydroxyapatite | ||||
|---|---|---|---|---|---|
| True conc. (mg/cc) | Measured conc. Mean ± SD (mg/cc) | Difference | True conc. (mg/cc) | Measured conc. Mean ± SD (mg/cc) | Difference |
| 2.000 | 2.137 ± 0.26 | 0.137 | 200.000 | 197.090 ± 4.94 | −2.91 |
| RMSE = 0.33 mg/cc | RMSE = 14.24 mg/cc | ||||
Figure 8 shows the measured VMI CT numbers for iodine at each concentration and keV, which were compared against reference values (NIST). The VMI CT numbers of iodine agreed with the reference values, with average percentage errors (measured vs. NIST reference) of 7.54%, 1.37%, 0.95%, and 1.13% for iodine concentrations of 2, 5, 10, and 15 mg/cc, respectively.
Figure 8:
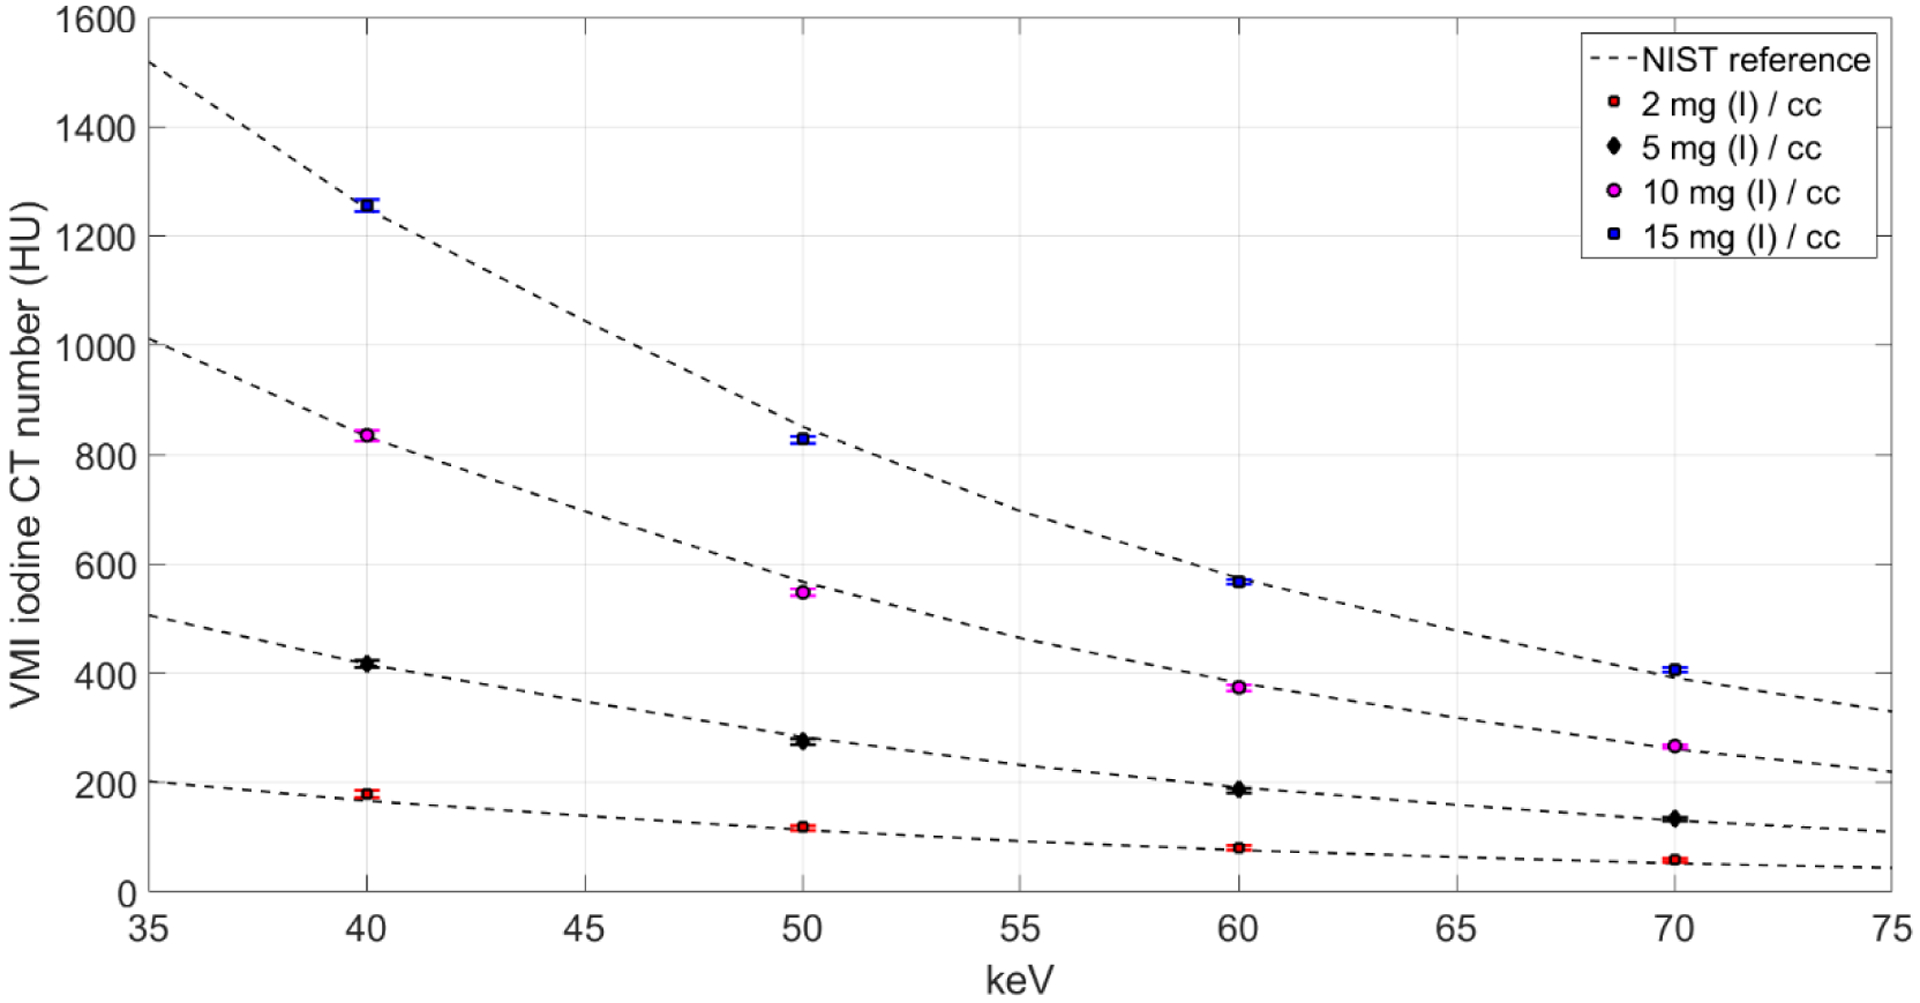
Measured VMI CT numbers for iodine concentrations compared against reference values obtained from NIST showed good agreement between expected and measured values. The overall (average) percentage error for all VMIs and all iodine concentrations was 2.75%.
3.4. Initial experience from patient imaging
EID-CT and PCD-CT lung images from a 70-year-old female patient are shown in Figure 9, where the UHR image from PCD-CT shows better delineation of bronchial walls compared to EID-CT; PCD-CT images from the same patient reconstructed with WFBP and IR are compared to EID-CT in Figure 10. Noise reduction was achieved using IR (12% with IR strength 1 and 36% with IR strength 3) compared to WFBP, with no detrimental effects observed on spatial resolution or the delineation of anatomic structures. The PCD-CT image with a dedicated sharp kernel (Qr76) and IR3 yielded comparable image noise (87 HU) to the EID-CT image with a standard Qr54 kernel and IR3 (80 HU), at matched slice thickness.
Figure 9:

EID-CT and PCD-CT images from a 70-year female patient with multifocal bronchiectasis (arrow heads, right middle lobe). The PCD-CT system allowed the use of a dedicated UHR kernel (Qr76, IR strength 3) and 0.2 mm slice thickness, which resulted in improved bronchial wall delineation (arrows) compared to the clinical EID-CT image reconstructed with Qr54 (IR strength 3) and 0.6 mm slice thickness (standard settings used in our clinical practice). Display window/level = [1500/−500] HU.
Figure 10:

EID-CT chest image reconstructed with IR at strength 3 (IR3), 0.6 mm slice thickness (top left panel), and PCD-CT chest images of the same patient reconstructed with WFBP (top right) and IR at two strengths (1 and 3, bottom left and right, respectively) at 0.6 mm slice thickness. The EID-CT reconstruction was performed according to our clinical protocol for routine chest CT. Both EID-CT and PCD-CT images showed a mildly dilated right lower lobe bronchus (arrows) with peripheral branching. PCD-CT images using the UHR mode clearly delineated the mucous plug (arrow heads) at the peripheral branching in the distal bronchus. ROI measurements displayed are the CT number standard deviation. Display window/level = [1500/−600] HU.
Temporal bone images of an 83-year old female patient obtained from EID-CT UHR mode (using a comb filter) and PCD-CT UHR mode are shown in Figure 11. For EID-CT, kernels sharper than Ur77 (e.g., Ur89) results in increased image noise appearing as grainy artifacts. Therefore, our clinical practice uses Ur77 for temporal bone image reconstruction. PCD-CT UHR allows the use of Hr89 with acceptable image noise level and without artifacts or loss of anatomic detail. Of note, the PCD-CT scan was performed at 37% lower radiation dose (31 mGy) compared to the EID-CT (50 mGy). Despite this dose reduction, the image noise was 46% lower on PCD-CT image compared to EID-CT when reconstructed with the same slice thickness and reconstruction kernels (Hr76 for PCD-CT vs. Ur77 for EID-CT).
Figure 11:
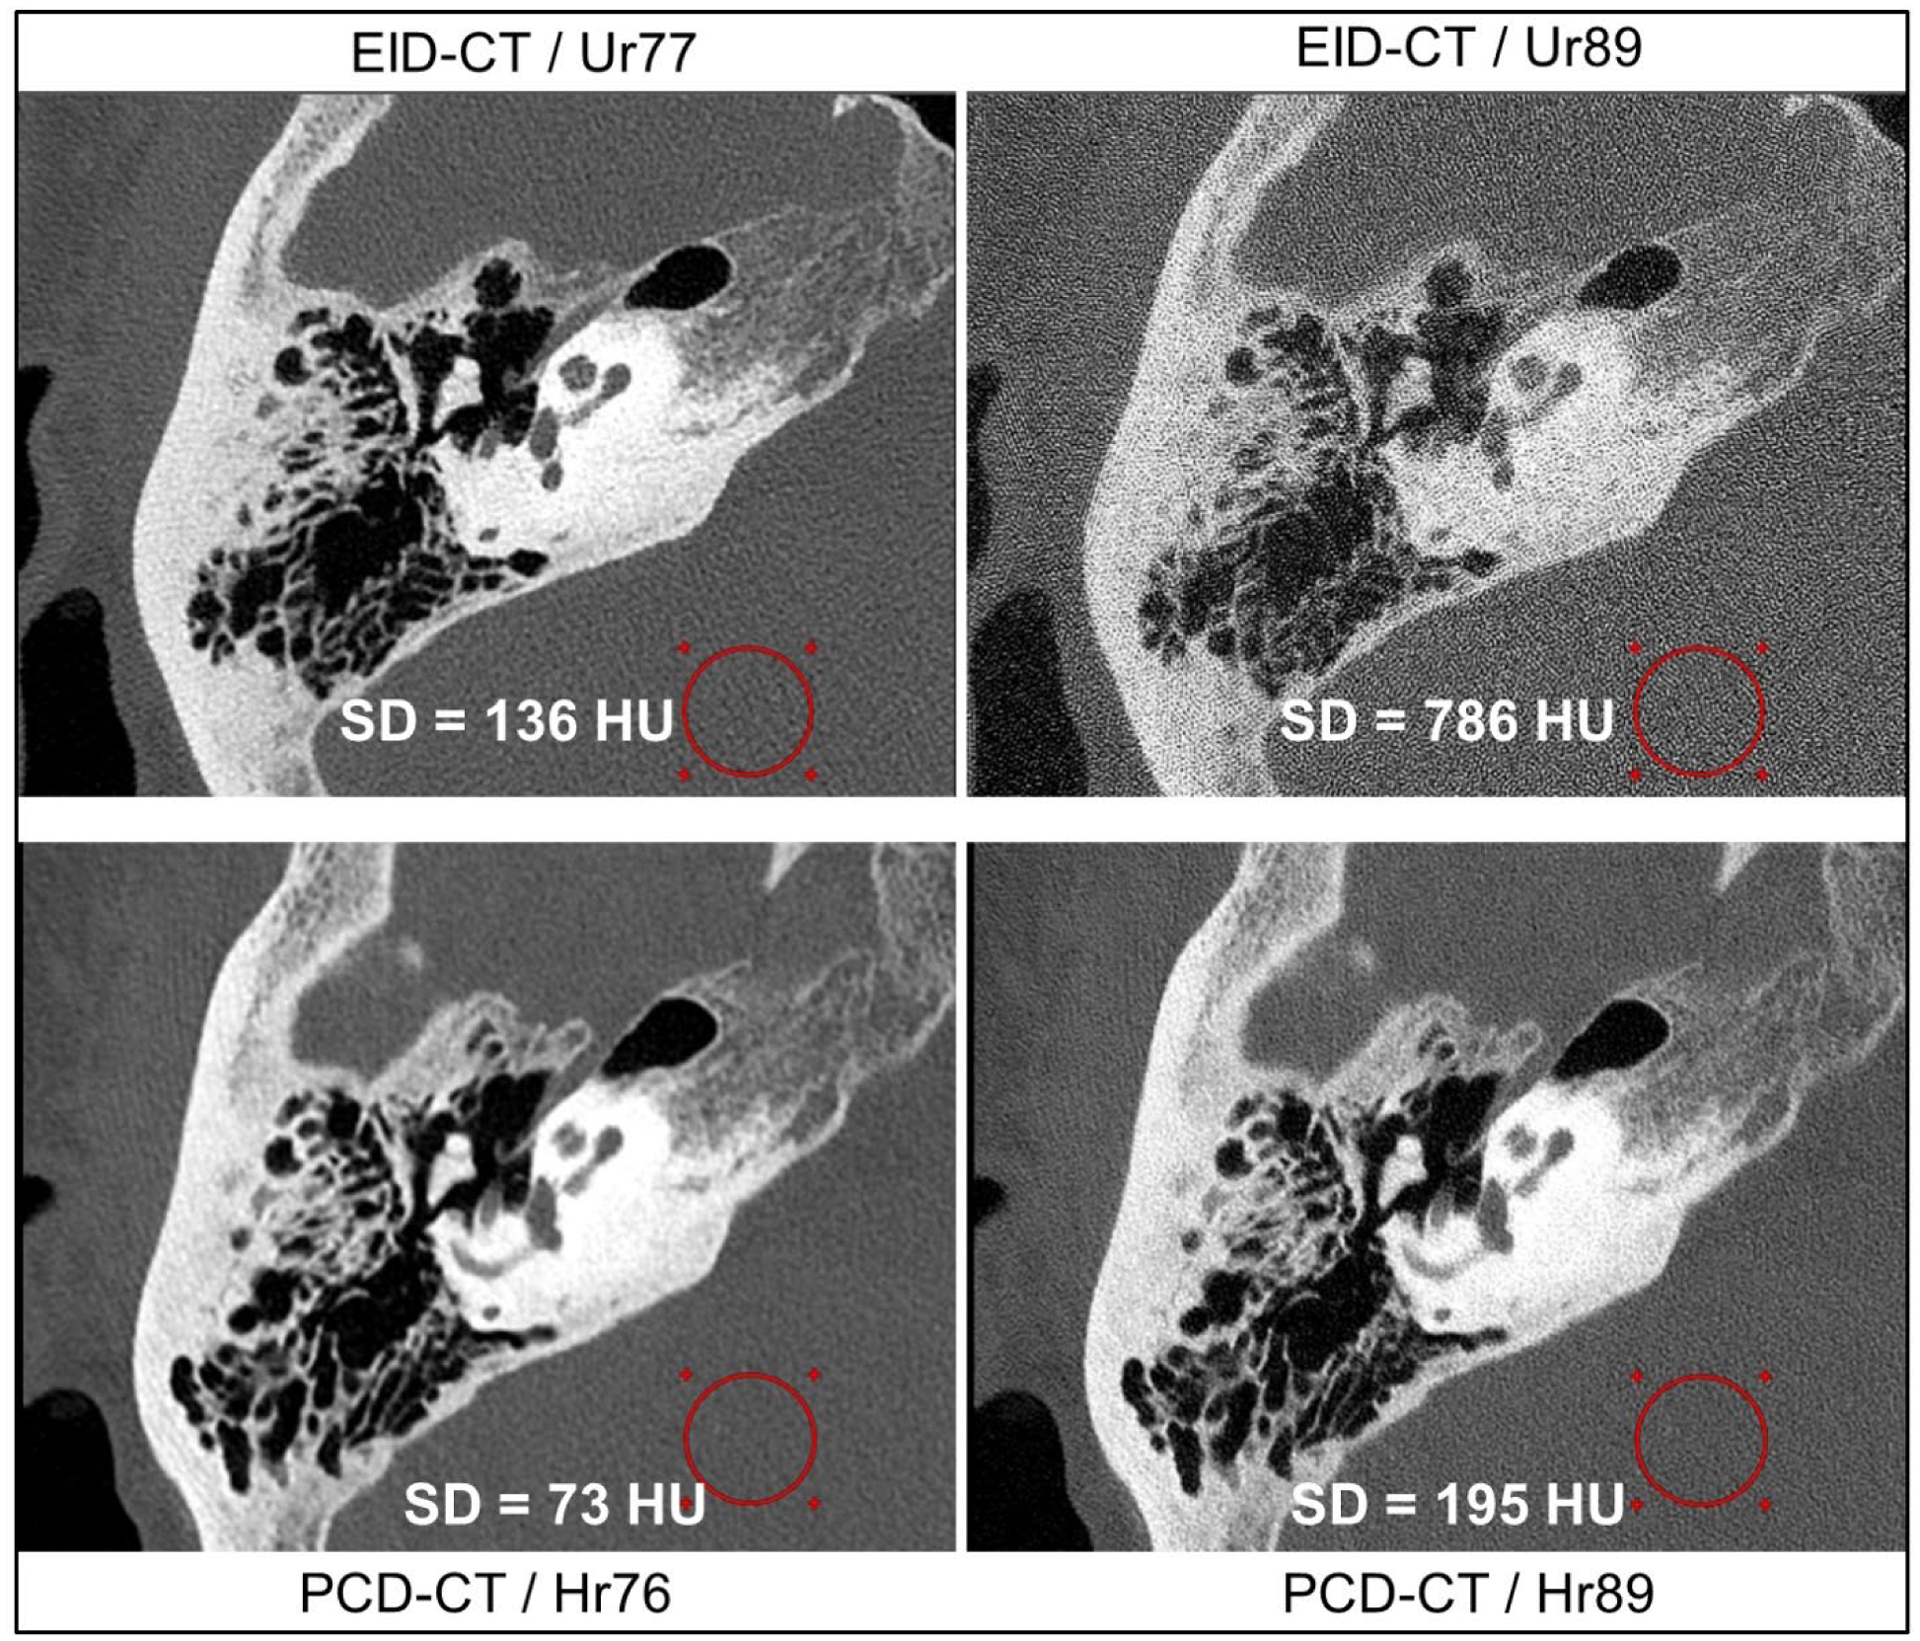
Temporal bone images from EID-CT (top row) and PCD-CT (bottom row) for the same patient. PCD-CT allows the use of sharper UHR kernels such as Hr89 whereas the EID-CT image with a similar Ur89 kernel results in increased image noise, which degrades image quality and anatomic visualization (top right). The PCD-CT scan was performed at 37% lower acquisition dose than EID-CT. The displayed measurements are CT number standard deviation in the circular ROIs. All images were reconstructed at 80 mm FOV focusing on the right temporal bone, 512×512 matrix size, and 0.4 mm slice thickness, and IR strength 3. Display window/level = [2800/500] HU.
PCD-CT images from a contrast-enhanced abdomen exam are shown in Figure 12. The threshold images (20–140 keV and 70–140 keV) were reconstructed with WFBP and IR (strengths 1 and 3) to demonstrate the influence of IR on noise texture. A noise reduction of 32% in the ROI was achieved using IR at strength 3 compared to WFBP for both threshold low and threshold high images. The radiologist who qualitatively evaluated the images found no adverse changes to the noise texture between WFBP and IR images, consistent with the NPS measurements in the phantom study.
Figure 12:
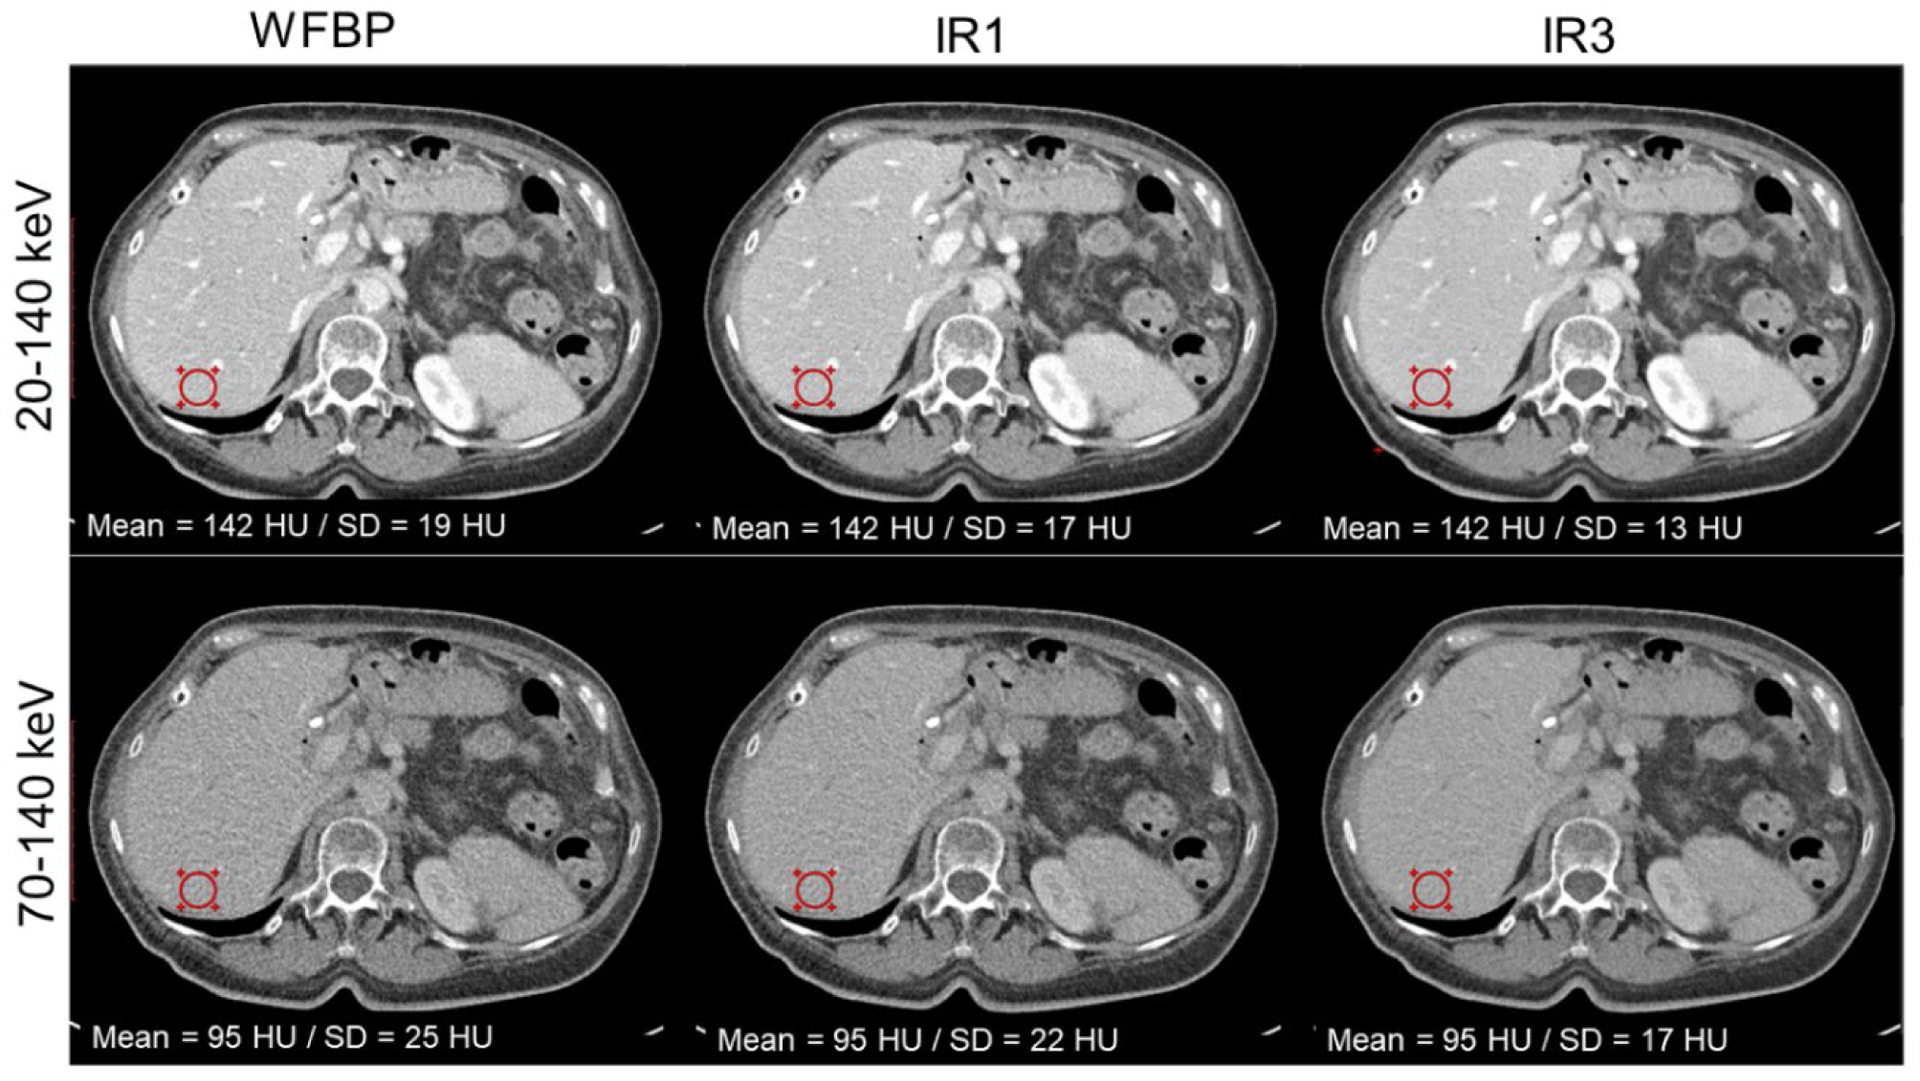
Contrast-enhanced abdomen PCD-CT images reconstructed with WFBP and IR (at strengths 1 and 3). A 32% reduction in image noise at the circular ROI was observed in both low- and high-energy threshold images. Display window/level = [400/40] HU.
For contrast-enhanced CT applications, the standard acquisition mode (144 × 0.4 mm collimation) facilitates dual-energy processing such as VMI and VNC as shown in the head CTA example in Figure 13. The VMI at 50 keV showed higher iodine enhancement (mean CT number, 154 HU) in a probable paraclinoid meningioma (arrows) compared to the low-energy threshold image (105 HU) and high-energy threshold image (66 HU). The VNC image from the PCD-CT scan mimics a non-contrast scan, with removal of iodine signal from the enhancing mass and nearby arteries.
Figure 13:

Multi-energy PCD-CT head CTA exam in a 91-year old male. The PCD-CT low- and high-energy threshold images (20–140 keV and 70–140 keV) show iodine enhancement in the arterial vasculature and a probable paraclinoid meningioma (arrow). Iodine signal was successfully removed in the VNC image emulating a non-contrast exam. The VMI at 50 keV image shows an increase in iodine signal within the mass and adjacent vasculature compared to the threshold images. Display window/level = [500/90] HU.
4. Discussion
In this study, we presented the initial experience from a full FOV, high-spatial-resolution PCD-CT system using phantom experiments and in patients. Quantitative phantom experiments provided a number of interesting findings. First, IR techniques currently employed in commercial CT scanners result in altered noise texture (a shift in the peak NPS to lower spatial frequencies) compared to conventional FBP (Chen et al., 2014, Euler et al., 2018). Our NPS measurements showed similar shape and peak location between WFBP and IR, while the latter reduced the noise magnitude, suggesting preservation of image texture in the evaluated IR algorithm.
Second, spatial resolution measurements for standard and dedicated sharp kernels revealed a limiting in-plane resolution of 125 μm for the sharpest PCD-CT UHR kernel (Br96); in comparison, the previously reported investigational PCD-CT system demonstrated a 150 μm in-plane spatial resolution (Leng et al., 2018). This improvement in resolution is attributed to the smaller detector pixel size (reduced from 0.25 mm to 0.15 mm, in-plane) and smaller x-ray source focal spot (reduced from 0.7 × 0.7 mm2 to 0.4 × 0.5 mm2). The smaller detector pixels from the full FOV PCD-CT can also be used to reduce image noise compared to EID-CT images acquired using the same dose. This occurs when the PCD-CT images are reconstructed using a kernel whose MTF is lower than the intrinsic system resolution (Baek et al., 2013, Kachelriess and Kalender, 2005, Leng et al., 2018, Rajendran et al., 2020). Alternatively, radiation dose can be reduced compared to EID-CT when the image noise is matched.
Third, the small detector pixel allows a minimum slice thickness for the UHR mode of 0.2 mm, which resulted in a FWHM of the section sensitivity profile of 0.33 mm, This can be compared to a 3rd generation dual-source CT system with 0.72 mm FWHM for a 0.6 mm minimum slice thickness.
Fourth, the multi-energy CT phantom experiments showed accurate iodine CT numbers (2.75% mean percent error compared to NIST reference) for VMIs obtained using the PCD-CT system. In comparison, a 4.6% mean percent error for VMI CT numbers (40 to 70 keV) for iodine concentrations was previously reported for a 3rd generation dual-source CT scanner using a 25 cm phantom scanned with 70/Sn-150 kV (Leng et al., 2017). For material decomposition, the PCD-CT images provided accurate mass density quantification (iodine RMSE = 0.33 mg/cc, hydroxyapatite RMSE = 14.2 mg/cc) and successfully delineated iodine and hydroxyapatite inserts.
The patient chest images reconstructed with a dedicated sharp kernel and smaller slice thickness demonstrated better bronchial wall delineation compared to conventional EID-CT. Similar to EID-CT, this PCD-CT system employs an anti-scatter grid, however, the system achieves UHR capability by use of smaller detector pixels and does not use a comb/grid filter or reflective inter-pixel septa, consequently improving the geometric dose efficiency compared to EID-CT. The final image spatial resolution depends on the intrinsic system resolution (determined by the focal spot size and the detector pixel size) and the kernel used in reconstruction (Baek et al., 2013, Kachelriess and Kalender, 2005). Due to the better intrinsic system resolution of PCD-CT compared to EID-CT and the absence of comb filter, the UHR mode from PCD-CT allows the use of very sharp kernels (e.g. Hr89) whereas the comb-filter based UHR from EID-CT had dramatically increased image noise when a similar kernel (Ur89) was used. Due to this limitation, temporal bone patient images from EID-CT are reconstructed with Ur77 in our clinical practice, despite the availability of sharper kernels such as Ur89. When the kernel is matched between EID-CT and PCD-CT, the latter yields a potential dose reduction of 82% compared to EID-CT for the same image noise. A similar level of dose reduction was previously demonstrated using the research PCD-CT system with 27.5 cm FOV (Rajendran et al., 2020).
For multi-energy applications, the full FOV PCD-CT system has 2 energy thresholds in the multi-energy acquisition mode; this allows the synthesis of VMI and VNC images. The 50 keV VMI showed increased iodine CT signal compared to the 20–140 keV low-energy threshold image, improving iodine enhancement or allowing lower contrast dosage in patients with renal insufficiency (Albrecht et al., 2019).
The described PCD-CT system overcomes the limitations of the previous research PCD-CT. An in-plane scan FOV of 50 cm (vs. 27.5 cm) accommodates both lungs in the chest and also imaging of larger patients. A longitudinal coverage of 5.76 cm (vs. 1.6 cm) permits faster scan times. For example, to scan a length of 80 cm at pitch 1.0 and rotation time 0.5s, the previous PCD-CT system required 25s whereas the same scan length can be covered in 6.9s with the new PCD-CT system (using standard mode) at matched pitch and rotation time.
The UHR mode from the full-FOV PCD-CT system can be used to image larger body parts such as the shoulders, pelvis and chest, whereas the comb-filter-based UHR mode used in EID-CT is limited to temporal bone and extremity imaging due to the dose inefficiency of the comb filters. Another EID-CT platform (Aquilion Precision, Canon Medical Systems USA, Inc.) capable of UHR imaging without the use of comb/grid filters was recently introduced (Kakinuma et al., 2015, Oostveen et al., 2020). This system uses 0.25 mm detector pixels (at isocenter) separated by a thin inter-pixel septa to achieve UHR capability, resulting in 150 μm in-plane resolution similar to the limited-FOV PCD-CT system previously described (Leng et al., 2018). In comparison, the full-FOV PCD-CT system presented in this study uses a 0.15 mm detector pixel size and can achieve 125 μm in-plane resolution; the absence of inter-pixel septa inherent to the PCD design results in increased geometric dose efficiency. PCDs also provide fundamental advantages over EIDs such as the removal of electronic noise using energy thresholding and uniform weighting of all detected photons, independent of photon energy. Another investigational full FOV PCD-CT system (iCT, Philips Healthcare, Haifa, Israel) was recently reported (Boccalini et al., 2021). This system features a pixel size of 0.27 mm at isocenter and five energy thresholds using a CdZnTe PCD array and has a detector z-coverage of 1.75 cm.
There were some limitations to our study. To present the initial experience from the PCD-CT system, we demonstrated quantitative accuracy in derived image sets (VMI and material decomposition) using a single acquisition protocol in the multi-energy CT phantom. A future study with more comprehensive evaluation of VMI accuracy using multiple kV/threshold settings and a range of phantom sizes is warranted. Similarly, example patient images were provided for visual assessment of the image quality achieved with PCD-CT for a qualitative comparison with EID-CT. A comprehensive clinical reader study is warranted to quantitatively evaluate the diagnostic benefits of the PCD-CT system for a range of body parts and clinical tasks. Such studies are currently underway at our institution.
In conclusion, we quantified the performance of a new whole-body PCD-CT system capable of achieving 125 μm in-plane resolution at a 50 cm FOV using phantoms and provided initial patient images as examples of the potential clinical impact. The higher spatial-resolution capability may provide improved clinical performance for tasks where resolving fine anatomical structures are crucial. Additionally, the multi-energy mode of the PCD-CT system can be used for imaging tasks requiring VMI and/or material decomposition.
Acknowledgements
Research reported in this work was supported by the National Institutes of Health under award number R01 EB028590 and C06 RR018898. The content is solely the responsibility of the authors and does not necessarily represent the official views of the National Institute of Health. Research support for this work was provided, in part, to Mayo Clinic from Siemens Healthineers GmbH. The research CT system used in this work was provided by Siemens Healthineers GmbH; it is not commercially available. The authors thank Nikki Weber, Holly Kasten and Bruce Lee for patient recruitment and scanning, Dr. Darin White for assessing the chest patient CT images, and Kristina Nunez for manuscript preparation and submission.
Conflicts of Interest and Source of Funding:
This study was supported by the National Institutes of Health under award numbers R01 EB028590 and C06 RR018898 and in collaboration with Siemens Healthineers GmbH. The content is solely the responsibility of the authors and does not necessarily represent the official views of the National Institute of Health. The device described is a research scanner and not commercially available. Drs. Petersilka, Henning, Schmidt and Flohr are employed with Siemens Healthineers GmbH and Dr. Shanblatt is employed with Siemens Medical Solutions, USA. Drs. McCollough and Fletcher receive industry funding to their institution from Siemens Healthineers GmbH. For the remaining authors, no conflicts were declared.
Footnotes
Ethical statement
Patient CT scans reported in this study were carried out with written informed consent obtained from participants. This Health Insurance Portability Act-compliant study was approved by the Institutional Review Board (IRB), Mayo Clinic, Rochester, MN, USA.
References
- ALBRECHT MH, VOGL TJ, MARTIN SS, NANCE JW, DUGUAY TM, WICHMANN JL, DE CECCO CN, VARGA-SZEMES A, VAN ASSEN M, TESCHE C & SCHOEPF UJ 2019. Review of Clinical Applications for Virtual Monoenergetic Dual-Energy CT. Radiology, 293, 260–271. [DOI] [PubMed] [Google Scholar]
- BAEK J, PINEDA AR & PELC NJ 2013. To bin or not to bin? The effect of CT system limiting resolution on noise and detectability. Physics in Medicine & Biology, 58, 1433. [DOI] [PubMed] [Google Scholar]
- BARTLETT DJ, KOO CW, BARTHOLMAI BJ, RAJENDRAN K, WEAVER JM, HALAWEISH AF, LENG S, MCCOLLOUGH CH & FLETCHER JG 2019. High-Resolution Chest Computed Tomography Imaging of the Lungs: Impact of 1024 Matrix Reconstruction and Photon-Counting Detector Computed Tomography. Invest Radiol, 54, 129–137. [DOI] [PMC free article] [PubMed] [Google Scholar]
- BERGER MJ, HUBBELL JH, SELTZER SM, CHANG J, COURSEY JS, SUKUMAR R, ZUCKER DS & OLSEN K 2010. NIST Standard Reference Database 8 (XGAM).
- BOCCALINI S, SI-MOHAMED S, DESSOUKY R, SIGOVAN M, BOUSSEL L & DOUEK P 2021. Feasibility of human vascular imaging of the neck with a large field-of-view spectral photon-counting CT system. Diagn Interv Imaging. [DOI] [PubMed] [Google Scholar]
- CHEN B, RAMIREZ GIRALDO JC, SOLOMON J & SAMEI E 2014. Evaluating iterative reconstruction performance in computed tomography. Med Phys, 41, 121913. [DOI] [PubMed] [Google Scholar]
- CORMODE DP, ROESSL E, THRAN A, SKAJAA T, GORDON RE, SCHLOMKA JP, FUSTER V, FISHER EA, MULDER WJ, PROKSA R & FAYAD ZA 2010. Atherosclerotic plaque composition: analysis with multicolor CT and targeted gold nanoparticles. Radiology, 256, 774–82. [DOI] [PMC free article] [PubMed] [Google Scholar]
- CORMODE DP, SI-MOHAMED S, BAR-NESS D, SIGOVAN M, NAHA PC, BALEGAMIRE J, LAVENNE F, COULON P, ROESSL E, BARTELS M, ROKNI M, BLEVIS I, BOUSSEL L & DOUEK P 2017. Multicolor spectral photon-counting computed tomography: in vivo dual contrast imaging with a high count rate scanner. Sci Rep, 7, 4784. [DOI] [PMC free article] [PubMed] [Google Scholar]
- DA SILVA J, GRONBERG F, CEDERSTROM B, PERSSON M, SJOLIN M, ALAGIC Z, BUJILA R & DANIELSSON M 2019. Resolution characterization of a silicon-based, photon-counting computed tomography prototype capable of patient scanning. J Med Imaging (Bellingham), 6, 043502. [DOI] [PMC free article] [PubMed] [Google Scholar]
- DO TD, SAWALL S, HEINZE S, REINER T, ZIENER CH, STILLER W, SCHLEMMER HP, KACHELRIEß M, KAUCZOR HU & SKORNITZKE S 2020. A semi-automated quantitative comparison of metal artifact reduction in photon-counting computed tomography by energy-selective thresholding. Scientific Reports, 10, 21099. [DOI] [PMC free article] [PubMed] [Google Scholar]
- EULER A, SOLOMON J, MARIN D, NELSON RC & SAMEI E 2018. A Third-Generation Adaptive Statistical Iterative Reconstruction Technique: Phantom Study of Image Noise, Spatial Resolution, Lesion Detectability, and Dose Reduction Potential. AJR Am J Roentgenol, 210, 1301–1308. [DOI] [PubMed] [Google Scholar]
- FLOHR T, PETERSILKA M, HENNING A, ULZHEIMER S, FERDA J & SCHMIDT B 2020. Photon-counting CT review. Phys Med, 79, 126–136. [DOI] [PubMed] [Google Scholar]
- FLOHR TG, STIERSTORFER K, SUSS C, SCHMIDT B, PRIMAK AN & MCCOLLOUGH CH 2007. Novel ultrahigh resolution data acquisition and image reconstruction for multi-detector row CT. Med Phys, 34, 1712–23. [DOI] [PubMed] [Google Scholar]
- GUTJAHR R, HALAWEISH AF, YU Z, LENG S, YU L, LI Z, JORGENSEN SM, RITMAN EL, KAPPLER S & MCCOLLOUGH CH 2016. Human Imaging With Photon Counting-Based Computed Tomography at Clinical Dose Levels: Contrast-to-Noise Ratio and Cadaver Studies. Investigative radiology. [DOI] [PMC free article] [PubMed] [Google Scholar]
- KACHELRIESS M & KALENDER WA 2005. Presampling, algorithm factors, and noise: considerations for CT in particular and for medical imaging in general. Med Phys, 32, 1321–34. [DOI] [PubMed] [Google Scholar]
- KAKINUMA R, MORIYAMA N, MURAMATSU Y, GOMI S, SUZUKI M, NAGASAWA H, KUSUMOTO M, ASO T, MURAMATSU Y, TSUCHIDA T, TSUTA K, MAESHIMA AM, TOCHIGI N, WATANABE S, SUGIHARA N, TSUKAGOSHI S, SAITO Y, KAZAMA M, ASHIZAWA K, AWAI K, HONDA O, ISHIKAWA H, KOIZUMI N, KOMOTO D, MORIYA H, ODA S, OSHIRO Y, YANAGAWA M, TOMIYAMA N & ASAMURA H 2015. Ultra-High-Resolution Computed Tomography of the Lung: Image Quality of a Prototype Scanner. PLoS One, 10, e0137165. [DOI] [PMC free article] [PubMed] [Google Scholar]
- KAPPLER S, HENNING A, KRAUSS B, SCHOECK F, STIERSTORFER K, WEIDINGER T & FLOHR T 2013. Multi-energy performance of a research prototype CT scanner with small-pixel counting detector. Proceedings of SPIE--the International Society for Optical Engineering, 8668, 86680O. [Google Scholar]
- KAPPLER S, HENNING A, KREISLER B, SCHÖECK F, STIERSTORFER K & FLOHR T 2014. Photon counting CT at elevated X-ray tube currents: contrast stability, image noise and multi-energy performance. Proceedings of SPIE--the International Society for Optical Engineering, 9033, 90331C. [Google Scholar]
- KLEIN L, DORN S, AMATO C, HEINZE S, UHRIG M, SCHLEMMER HP, KACHELRIESS M & SAWALL S 2020. Effects of Detector Sampling on Noise Reduction in Clinical Photon-Counting Whole-Body Computed Tomography. Invest Radiol, 55, 111–119. [DOI] [PubMed] [Google Scholar]
- KOPP FK, DAERR H, SI-MOHAMED S, SAUTER AP, EHN S, FINGERLE AA, BRENDEL B, PFEIFFER F, ROESSL E, RUMMENY EJ, PFEIFFER D, PROKSA R, DOUEK P & NOËL PB 2018. Evaluation of a preclinical photon-counting CT prototype for pulmonary imaging. Scientific Reports, 8, 17386. [DOI] [PMC free article] [PubMed] [Google Scholar]
- LENG S, RAJENDRAN K, GONG H, ZHOU W, HALAWEISH AF, HENNING A, KAPPLER S, BAER M, FLETCHER JG & MCCOLLOUGH CH 2018. 150-μm Spatial Resolution Using Photon-Counting Detector Computed Tomography Technology: Technical Performance and First Patient Images. Invest Radiol. [DOI] [PMC free article] [PubMed] [Google Scholar]
- LENG S, YU Z, HALAWEISH A, KAPPLER S, HAHN K, HENNING A, LI Z, LANE J, LEVIN DL, JORGENSEN S, RITMAN E & MCCOLLOUGH C 2016. Dose-efficient ultrahigh-resolution scan mode using a photon counting detector computed tomography system. J Med Imaging (Bellingham), 3, 043504. [DOI] [PMC free article] [PubMed] [Google Scholar]
- LENG S, ZHOU W, YU Z, HALAWEISH A, KRAUSS B, SCHMIDT B, YU L, KAPPLER S & MCCOLLOUGH C 2017. Spectral performance of a whole-body research photon counting detector CT: quantitative accuracy in derived image sets. Phys Med Biol, 62, 7216–7232. [DOI] [PMC free article] [PubMed] [Google Scholar]
- MANNIL M, HICKETHIER T, VON SPICZAK J, BAER M, HENNING A, HERTEL M, SCHMIDT B, FLOHR T, MAINTZ D & ALKADHI H 2018. Photon-Counting CT: High-Resolution Imaging of Coronary Stents. Invest Radiol, 53, 143–149. [DOI] [PubMed] [Google Scholar]
- MUENZEL D, BAR-NESS D, ROESSL E, BLEVIS I, BARTELS M, FINGERLE AA, RUSCHKE S, COULON P, DAERR H, KOPP FK, BRENDEL B, THRAN A, ROKNI M, HERZEN J, BOUSSEL L, PFEIFFER F, PROKSA R, RUMMENY EJ, DOUEK P & NOEL PB 2017. Spectral Photon-counting CT: Initial Experience with Dual-Contrast Agent K-Edge Colonography. Radiology, 283, 723–728. [DOI] [PubMed] [Google Scholar]
- OOSTVEEN LJ, BOEDEKER KL, BRINK M, PROKOP M, DE LANGE F & SECHOPOULOS I 2020. Physical evaluation of an ultra-high-resolution CT scanner. Eur Radiol, 30, 2552–2560. [DOI] [PMC free article] [PubMed] [Google Scholar]
- OSTADHOSSEIN F, TRIPATHI I, BENIG L, LOBATO D, MOGHISEH M, LOWE C, RAJA A, BUTLER A, PANTA R, ANJOMROUZ M, CHERNOGLAZOV A & PAN D 2020. Multi-“Color” Delineation of Bone Microdamages Using Ligand-Directed Sub-5 nm Hafnia Nanodots and Photon Counting CT Imaging. Advanced Functional Materials, 30, 1904936. [Google Scholar]
- PANTA RK, BUTLER APH, BUTLER PH, RUITER NJAD, BELL ST, WALSH MF, DOESBURG RMN, CHERNOGLAZOV AI, GOULTER BP, CARBONEZ P, DAMET J, ADEBILEJE SA, ALEXANDER SD, AMMA MR, ANJOMROUZ M, ASGHARIOMABAD F, ATHARIFARD A, BAER K, BAMFORD B, BHEESETTE S, CHAMBERS C, CHERNOGLAZOV AI, DAHAL S, DALEFIELD T, DOESBURG RMN, DUNCAN N, GIESEG SP, GURNEY S, HEALY JL, HILTON PJ, KANITHI P, KIRKBRIDE T, LANSLEY SP, LOWE C, MANDALIKA VBH, MARFO E, MATANAGHI A, MOGHISEH M, PALMER D, PREBBLE HM, RAJA AY, RAMYAR M, RENAUD P, SCHLEICH N, SEARLE E, SHAMSHAD M, SHEEJA JS, UDDIN R, BROEKE LV, VIVEK VS, WALKER EP, WIJESOORIYA M & WOODFIELD TBF First human imaging with MARS photon-counting CT. 2018 IEEE Nuclear Science Symposium and Medical Imaging Conference Proceedings (NSS/MIC), 10–17 Nov. 2018 2018. 1–7. [Google Scholar]
- POURMORTEZA A, SYMONS R, HENNING A, ULZHEIMER S & BLUEMKE DA 2018. Dose Efficiency of Quarter-Millimeter Photon-Counting Computed Tomography: First-in-Human Results. Invest Radiol, 53, 365–372. [DOI] [PubMed] [Google Scholar]
- POURMORTEZA A, SYMONS R, SANDFORT V, MALLEK M, FULD MK, HENDERSON G, JONES EC, MALAYERI AA, FOLIO LR & BLUEMKE DA 2016. Abdominal imaging with contrast-enhanced photon-counting CT: first human experience. Radiology, 279, 239–245. [DOI] [PMC free article] [PubMed] [Google Scholar]
- RAJENDRAN K, MARSH J, PETERSILKA M, HENNING A, SHANBLATT E, SCHMIDT B, FLOHR T, FLETCHER J, MCCOLLOUGH C & LENG S 2021. High resolution, full field-of-view, whole body photon-counting detector CT: system assessment and initial experience, SPIE. [DOI] [PMC free article] [PubMed] [Google Scholar]
- RAJENDRAN K, VOSS BA, ZHOU W, TAO S, DELONE DR, LANE JI, WEAVER JM, CARLSON ML, FLETCHER JG, MCCOLLOUGH CH & LENG S 2020. Dose Reduction for Sinus and Temporal Bone Imaging Using Photon-Counting Detector CT With an Additional Tin Filter. Invest Radiol, 55, 91–100. [DOI] [PMC free article] [PubMed] [Google Scholar]
- REN L, RAJENDRAN K, FLETCHER JG, MCCOLLOUGH CH & YU L 2020. Simultaneous Dual-Contrast Imaging of Small Bowel With Iodine and Bismuth Using Photon-Counting-Detector Computed Tomography: A Feasibility Animal Study. Investigative Radiology, 55, 688–694. [DOI] [PMC free article] [PubMed] [Google Scholar]
- SCHMIDT TG 2009. Optimal “image-based” weighting for energy-resolved CT. Med Phys, 36, 3018–27. [DOI] [PubMed] [Google Scholar]
- SI-MOHAMED S, CORMODE DP, BAR-NESS D, SIGOVAN M, NAHA PC, LANGLOIS JB, CHALABREYSSE L, COULON P, BLEVIS I, ROESSL E, ERHARD K, BOUSSEL L & DOUEK P 2017. Evaluation of spectral photon counting computed tomography K-edge imaging for determination of gold nanoparticle biodistribution in vivo. Nanoscale, 9, 18246–18257. [DOI] [PMC free article] [PubMed] [Google Scholar]
- SIEWERDSEN J, CUNNINGHAM I & JAFFRAY D 2002. A framework for noise-power spectrum analysis of multidimensional images. Medical physics, 29, 2655–2671. [DOI] [PubMed] [Google Scholar]
- STIERSTORFER K, RAUSCHER A, BOESE J, BRUDER H, SCHALLER S & FLOHR T 2004. Weighted FBP--a simple approximate 3D FBP algorithm for multislice spiral CT with good dose usage for arbitrary pitch. Phys Med Biol, 49, 2209–18. [DOI] [PubMed] [Google Scholar]
- SYMONS R, CORK TE, SAHBAEE P, FULD MK, KAPPLER S, FOLIO LR, BLUEMKE DA & POURMORTEZA A 2016. Low-dose lung cancer screening with photon-counting CT: a feasibility study. Physics in Medicine and Biology, 62, 202. [DOI] [PMC free article] [PubMed] [Google Scholar]
- SYMONS R, KRAUSS B, SAHBAEE P, CORK TE, LAKSHMANAN MN, BLUEMKE DA & POURMORTEZA A 2017. Photon-counting CT for simultaneous imaging of multiple contrast agents in the abdomen: An in vivo study. Med Phys, 44, 5120–5127. [DOI] [PMC free article] [PubMed] [Google Scholar]
- SYMONS R, REICH DS, BAGHERI M, CORK TE, KRAUSS B, ULZHEIMER S, KAPPLER S, BLUEMKE DA & POURMORTEZA A 2018. Photon-Counting Computed Tomography for Vascular Imaging of the Head and Neck: First In Vivo Human Results. Invest Radiol, 53, 135–142. [DOI] [PMC free article] [PubMed] [Google Scholar]
- TAO S, RAJENDRAN K, MCCOLLOUGH CH & LENG S 2018. Material decomposition with prior knowledge aware iterative denoising (MD-PKAID). Phys Med Biol, 63, 195003. [DOI] [PubMed] [Google Scholar]
- VON SPICZAK J, MANNIL M, PETERS B, HICKETHIER T, BAER M, HENNING A, SCHMIDT B, FLOHR T, MANKA R, MAINTZ D & ALKADHI H 2018. Photon Counting Computed Tomography With Dedicated Sharp Convolution Kernels: Tapping the Potential of a New Technology for Stent Imaging. Invest Radiol, 53, 486–494. [DOI] [PubMed] [Google Scholar]
- YU Z, LENG S, JORGENSEN SM, LI Z, GUTJAHR R, CHEN B, HALAWEISH AF, KAPPLER S, YU L, RITMAN EL & MCCOLLOUGH CH 2016a. Evaluation of conventional imaging performance in a research whole-body CT system with a photon-counting detector array. Physics in medicine and biology, 61, 1572–95. [DOI] [PMC free article] [PubMed] [Google Scholar]
- YU Z, LENG S, KAPPLER S, HAHN K, LI Z, HALAWEISH AF, HENNING A & MCCOLLOUGH CH 2016b. Noise performance of low-dose CT: comparison between an energy integrating detector and a photon counting detector using a whole-body research photon counting CT scanner. Journal of Medical Imaging, 3, 043503–043503. [DOI] [PMC free article] [PubMed] [Google Scholar]
- ZHOU W, BARTLETT DJ, DIEHN FE, GLAZEBROOK KN, KOTSENAS AL, CARTER RE, FLETCHER JG, MCCOLLOUGH CH & LENG S 2019. Reduction of Metal Artifacts and Improvement in Dose Efficiency Using Photon-Counting Detector Computed Tomography and Tin Filtration. Invest Radiol, 54, 204–211. [DOI] [PMC free article] [PubMed] [Google Scholar]


