

Summary
Understanding the impacts of activity on energy balance is crucial. Increasing levels of activity may bring diminishing returns in energy expenditure because of compensatory responses in non-activity energy expenditures1–3. This suggestion has profound implications for both the evolution of metabolism and human health. It implies that a long-term increase in activity does not directly translate into an increase in total energy expenditure (TEE) because other components of TEE may decrease in response–energy compensation. We used the largest dataset compiled on adult TEE and BEE (N = 1,754) of people living normal lives to find that energy compensation by a typical human averages 28% due to reduced BEE; this suggests that only 72% of the extra calories we burn from additional activity translate into extra calories burned that day. Moreover, the degree of energy compensation varied considerably between people of different body composition. This association between compensation and adiposity could be due to among-individual differences in compensation: people who compensate more may be more likely to accumulate body fat. Alternatively, the process might occur within individuals: as we get fatter, our body might compensate more strongly for the calories burned during activity, making losing fat progressively more difficult. Determining the causality of the relationship between energy compensation and adiposity will be key to improving public health strategies regarding obesity.
Keywords: Activity, basal metabolic rate, daily energy expenditure, energy management models, exercise, Homo sapiens, trade-offs, weight loss
Results and Discussion
The contexts within which energy compensation occur, the extent to which it occurs 4, 5 and the processes involved are far from resolved 2, 6–8. Using the largest dataset on human energy expenditure ever assembled, by estimating the relationships between TEE, AEE, and BEE we test the mutually exclusive predictions from the three energy expenditure models (Figure 1) for individuals with unremarkable lifestyles generating natural variation in total energy expenditures over time, and without food restriction. Determining which of these energy expenditure models apply to humans under typical, free-living conditions, and quantifying its effects, will progress our understanding of the evolution and control of metabolism, and may provide key physiological information for management strategies for weight control.
Figure 1. Energy budgets and competing hypotheses.
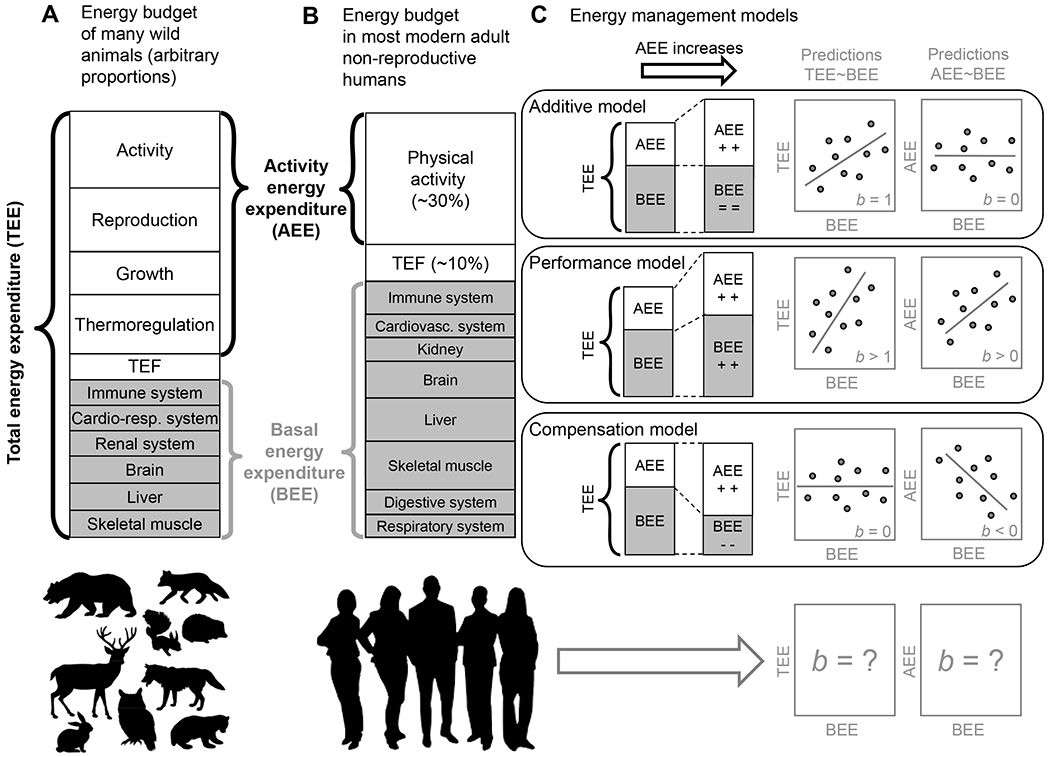
(A) Representation of the total energy expenditure (TEE) of endothermic animals as the sum of the energy invested in activity, reproduction, growth, thermoregulation, digestion (thermic effect of food; TEF), and basal energy expenditure (BEE; the minimum amount of energy required for the functioning [e.g., breathing] and the maintenance [e.g., tissue turnover] of vital systems). Proportions are somewhat arbitrary but recognize that in vertebrates BEE is typically a minor element of TEE 28. Any source of energy expenditure above BEE (except TEF) is apportioned as activity energy expenditure (AEE), which includes the costs of thermoregulation, reproduction and growth when present. (B) Representation of the TEE of most non-reproductive adult humans, in which there are no energy costs of growth or reproduction, and the cost of thermoregulation is assumed to be negligible. In this simplified energy budget, the proportions recognize that in adult humans ~60% of energy is spent on BEE (categorized into proportions based loosely on 29) and most of the AEE component is indeed represented by activity: locomotion, posture and ‘fidgeting’ 30. (C) Illustration of the various models that have been proposed to describe how humans and other animals manage their energy budget 31–35, and their associated predictions about the slope (b) of the relationship between TEE and BEE and between AEE and BEE. The left stack bar shows a simplified baseline version of TEE as the sum of BEE and AEE. Comparing the left vs. right stacks shows the mean effect of an increase in AEE on BEE and TEE. The regression lines in the panels to the right show the predicted relationships between TEE and BEE and between AEE and BEE; example individual data points have been included to illustrate the predicted relationship in addition to some unexplained variation. The additive model assumes that AEE and BEE are independent, thus uncorrelated. Therefore, variation in BEE should add up to variation in TEE, with a b = 1 due to part-whole correlation. In other words, the additive model predicts that additional calories burned by undertaking extra activity results in an equivalent increase in total energy expenditure. By contrast, the performance model assumes that a greater ‘metabolic machinery’ is needed to support higher AEE due to increased assimilation of energy, and thus a b > 1 for the relationship between TEE and BEE. That is, the performance model predicts that the resultant total calories burned due to activity will be higher than just the calories expended during the activity because of additional energy spent on subsequent physical recovery and maintenance of a more expensive metabolic machinery to support this behaviour. Alternatively, both humans and animals may respond to greater energy being expended on activity over the long term by reducing the energy expended on other processes, a phenomenon captured by the compensation model. The compensation model assumes that energy budgets are somewhat constrained which forces trade-offs between energy invested into AEE and BEE, thus predicting a negative relationship between AEE and BEE and therefore a b < 1 for the relationship between TEE and BEE. It is currently unknown whether energy compensation occurs only under extreme conditions, or at least only during periods of prescribed exercise, where measured or inferred energy compensation has been documented on a number of occasions 36–38, or instead whether it is the default model of energy expenditure in humans living typical lives, who naturally adjust their activity and energy intake over time.
We extracted paired measurements of BEE (respirometry) and TEE (doubly-labelled water (DLW) 9) for 1,754 adults from the International Atomic Energy Agency DLW database v.3.1.2 10. All estimates of TEE were made using a standard calculation across all studies 11. Controlling for age (y), sex, and body composition (i.e., fat free mass in kg, derived from the body water dilution spaces, and fat mass in kg, calculated as the difference between body mass and fat free mass), a multiple regression of TEE as a function of BEE revealed an overall positive and highly significant relationship between TEE and BEE, with a slope of b±se = 0.723±0.049 (Table S1A) and 95% confidence intervals (CI) that exclude both 0 and 1 [CI: 0.626; 0.820]. The positive relationship between BEE and TEE is not surprising, given that BEE represents the largest component of TEE (Figure 1B). Due to the part-whole relationship, however, the slope between BEE and TEE should be 1 unless the active and basal components of energy expenditure are positively or negatively linked (as postulated in the performance and compensation models, see Figure 1C). Because our analysis revealed that the slope is significantly <1 (Figure 2A), this indicates that a considerable degree (27.7%) of compensation occurred between the active and basal components of energy expenditure.
Figure 2. Energy compensation in humans.
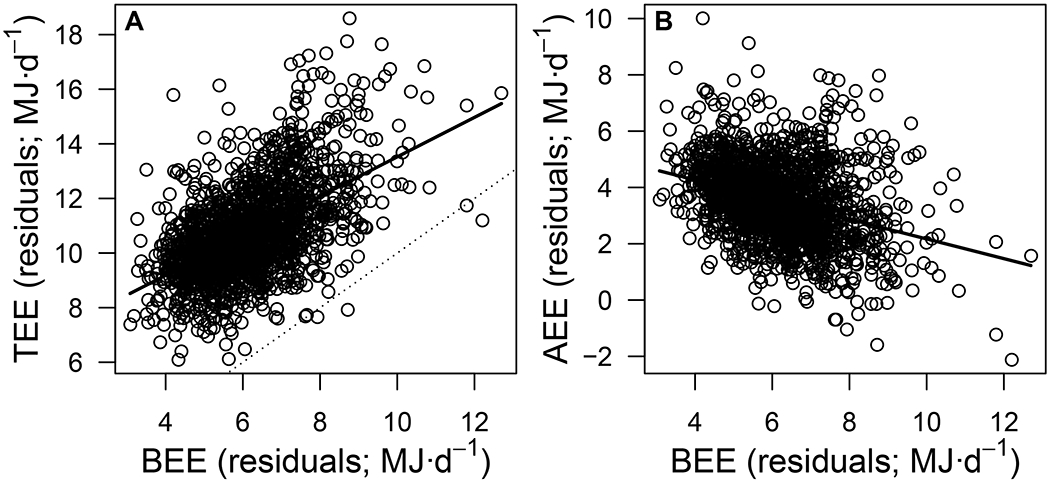
(A) Total energy expenditure (TEE; MJ·d−1) and (B) activity energy expenditure (AEE; MJ·d−1) as a function of basal energy expenditure (BEE; MJ·d−1) in 1,754 subjects included in this study, controlling for sex, age, and body composition. Panel A illustrates how the slope of the TEE-BEE relationship is <1 (compared to the 1:1 dotted line), whereas panel B illustrates the negative relationship between AEE and BEE.
To further illustrate compensation, we calculated the activity energy expenditure (AEE) for each individual by subtracting BEE from 0.9*TEE (TEE adjusted to account for the thermic effect to food). A multiple regression of AEE as a function of BEE (with age, sex, and body composition as covariates) revealed an overall negative and highly significant relationship, with a slope of b±se = −0.349±0.044 (t = 7.86, p < 0.0001; Table S1A; Figure 2B) and 95% confidence interval (CI) that excludes 0 [CI: −0.436; −0.262]. These findings concur with those from the model regressing TEE as a function of BEE. Note that in principle one mechanism that does not represent energy compensation and yet could in principle create the observed patterns is that people who are more active (and have a higher AEE) have a greater proportion of muscle mass12, which increases FFM without substantively increasing BEE 13 resulting in more active people having a low mass-corrected BEE. However, this possibility can be disregarded given that our analysis indicates energy compensation in people having accounted for variation in their FFM by its inclusion as a covariate (as both a main effect and as an interaction term with BEE and age).
Thus, humans living typical modern lives – not undertaking exceptional levels of activity or experiencing chronic food shortages – exhibit a fairly strong compensation between the energy they expend on activity and that expended on basal metabolic processes; over the long term more than a quarter of the extra calories burned by people during activity do not translate into extra calories expended that day. Presumably, such compensation would have been adaptive for our ancestors because it minimised food energy demands and hence reduced the time needed for foraging, the advantages of which may include reducing exposure to predation. However, it is potentially maladaptive for modern-living humans exercising to try to burn off excess food consumption, given the chain of association linking high-density foods to greater energy intake 14, obesity 15 and its related diseases 16.
Public health initiatives often include prescribed increases in activity in part to increase TEE and thereby control weight gain or promote fat loss 17. Such a prescription, however, often assumes that costs of activity are additively related to basal costs 18, which our analyses suggests is untrue. It will therefore be important when prescribing personalized exercise plans for controlling or reducing weight, and managing patient expectations, to know if the degree of long-term energy compensation changes with age and other demographic variables such as sex. It is well known that older individuals are more at risk of obesity than are younger individuals. To test if older people, and potentially one sex more than the other, exhibit greater energy compensation, we took advantage of the information on sex, age, and body composition (measured by isotope dilution) included in our dataset, which consisted of 692 men and 1,062 women aged 18 to 96 y, with fat free mass ranging from 24.3 to 97.1 (median: 47.64 kg) and body mass index (BMI) ranging from 12.5 to 61.7 (median: 25.2 kg/m2). To test if the slope (b) of the TEE-BEE and AEE-BEE relationships changes according to sex, age, and body composition, we added the interaction terms between BEE and each of these factors to the multiple regression model (in addition to other two-way interactions between sex, age, and body composition that control for sex differences and age-related changes in body composition; see Table S1B). Overall, energy compensation was not different in men vs women and did not vary with age (i.e., BEE × sex and BEE × age interactions, Table S1B). Hence, energy compensation seems to be a general phenomenon that applies equally to men and women, young and old. Note that FFM and FM were derived from isotope dilution, assuming a constant ratio for FFM hydration (73.2%) but according to published literature, FFM hydration may not be constant with adult age. However, any variation is probably small 19, and indeed unpublished analyses on data for over 1000 adults with ages ranging from 20 to over 70 indicates that the ratio of total body weight to FFM hardly changes (S. Heymsfield, pers. comm.).
Interestingly, the BEE × fat mass interaction was significant with a negative estimate (Table S1B), indicating that the slope of the TEE-BEE and AEE-BEE relationships decreases as fat mass increases. In other words, controlling for sex, age, and FFM, compensation increases with fat mass. People that are at the 10th percentile of the BMI distribution compensate 29.7% of activity calories, whereas people at the 90th percentile compensate 45.7% of activity calories (Figure 3). It appears then, that either individuals with greater fat levels are predisposed to increased adiposity because they are stronger energy compensators or because they become stronger compensators as they get fatter. If the former, then two people can be equally active yet one puts on fat mass while the other stays lean. If the latter, then such a positive feedback loop may imply that using exercise as a strategy to escape high adiposity becomes less and less effective. Resolving the causality of this relationship between fat mass and energy compensation might be key to better deploying exercise in the fight against the growing obesity pandemic.
Figure 3. Compensation increases with fat mass.
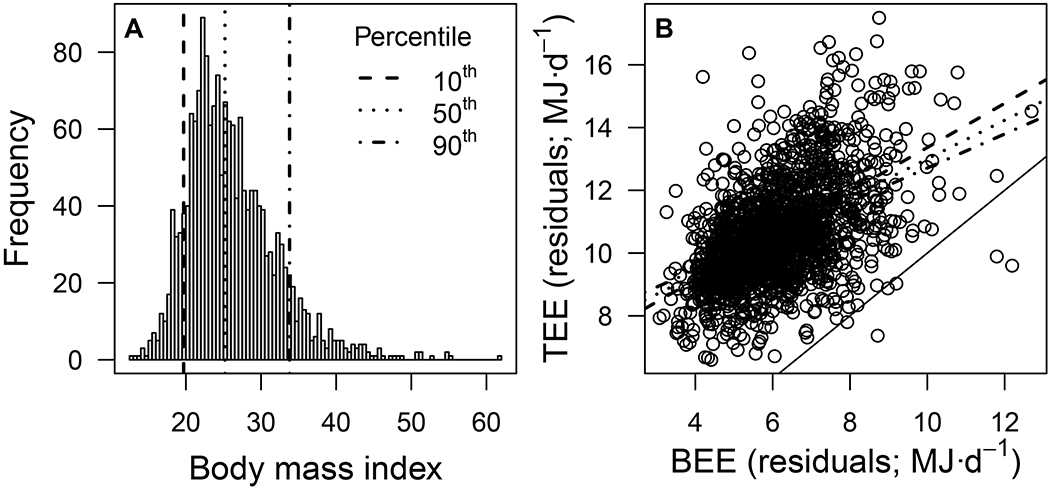
(A) Frequency distribution of body mass index in the 1,754 subjects included in this study, showing where lie the 10th, 50th, and 90th percentiles (long dash, short dash, and dash-dot lines, respectively). (B) Total energy expenditure (TEE; MJ·d−1) as a function of basal energy expenditure (BEE; MJ·d−1), controlling for sex, age, and body composition. This figure illustrates the significant BEE × fat mass interaction (Table S1B), showing how compensation increases from 29.7% in people at the 10th percentile of the BMI distribution (red long dash line), to 45.8% in people at the 90th percentile of the BMI distribution (blue dash-dot line). Relationships are plotted separately for three broad BMI categories, but fat mass is treated as a continuous variable in the analysis (see Table S1B for estimates). The thin solid line indicates a 1:1 relationship.
The energy compensation detected in the aforementioned analysis can be the result of processes occurring at two distinct levels of covariation: between individuals and within individuals. Energy compensation at the between-individual level would indicate that people with higher-than-average AEE tend to have a lower-than-average BEE – a covariance due to genetic and/or permanent environmental factors that would cause the between-individual TEE-BEE slope (bbetween) to be <1. By contrast, energy compensation at the within-individual level would indicate that, for a given individual, reversible increases in AEE are accompanied by decreases in BEE, and vice versa, which would cause the within-individual TEE-BEE slope (bwithin) to be <1. To partition the relationship between TEE and BEE at the between-and within-individual levels, we re-analysed data representing paired measurements of 36 men and 32 women aged between 70 and 90 y sampled 7 y apart within the context of a longitudinal study 20. This dataset provides the opportunity to estimate the extent of energy compensation occurring both between and within individuals in elderly people. Using a bivariate mixed model, we partitioned the slope of the TEE-BEE relationship (while accounting for sex, age, FFM, FM, and sex-and age-related differences in FFM and FM) at the between-and within-individual levels (Table S2A). This analysis clearly reveals that energy compensation occurs only at the within-individual level (Figure 4A). While the between-individual slope was bbetween±se = 1.86±1.05, the within-individual slope was bwithin±se = 0.15 ±0.17.
Figure 4. Energy trade-offs within individuals.
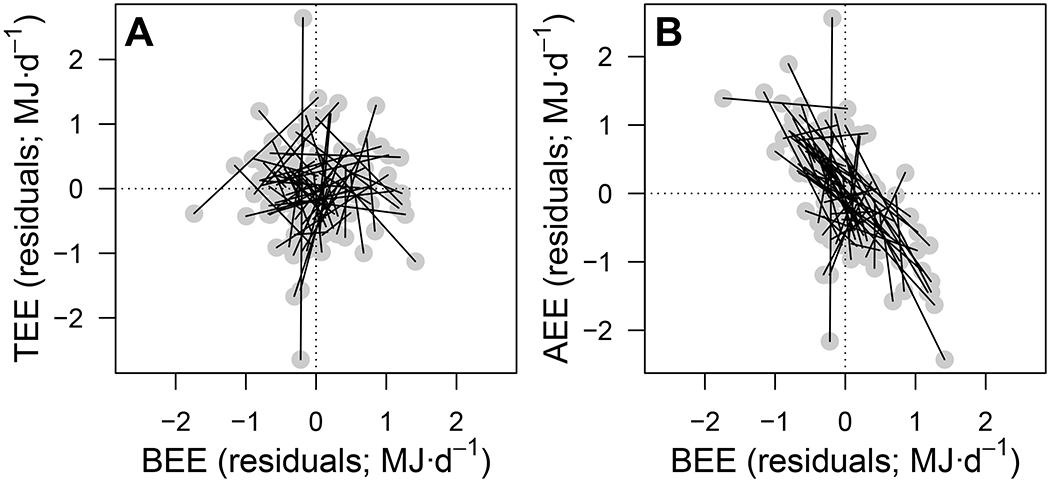
Residual (A) total energy expenditure (TEE; MJ·d−1) and (B) activity energy expenditure (AEE; MJ·d−1) as a function of basal energy expenditure (BEE; MJ·d−1) in elderly men and women (N = 68) with two pairs of TEE-BEE measures each. Within-individual slopes are illustrated by the thin black lines connecting the two residual values (grey dots; extracted from the bivariate mixed model, see Table S2) for each individual.
To further illustrate the compensation occurring at the within-individual level, we ran a second bivariate mixed model with AEE and BEE as the dependant variables. In this model, the within-individual covariance was significantly negative (Table S2B). The within-individual correlation (±se) between AEE and BEE was r = −0.58±0.08 (Figure 4B). Hence, during extended periods when the studied cohort expended more energy on activity they compensated by reducing energy expended on basal processes (but individuals with higher-than-average AEE do not necessarily have a lower-than-average BEE). The within-individual slope in these people indicates particularly strong energy compensation between AEE and BEE (Figure 4B). That is, in this sample of people, the calories they burn during bouts of activity are almost entirely compensated for by reducing energy expended on other processes such that variation in activity had little impact on TEE.
Measurements of BEE and TEE provide invaluable insights into energy management; the next step is to elucidate the proximate and ultimate mechanisms driving these observed patterns of energy compensation. One possible factor is energy intake. For example, if obese people tend to increase their food consumption in response to increased AEE less so than other demographics, they have less resources for other functions and this could encourage the body to energy compensate, reducing BEE 21. Another possible factor involved in energy compensation, which is relatively hard to measure and not available in our dataset, is fidgeting, or non-exercise activity thermogenesis (NEAT). In principle, NEAT can decrease in response to increases in AEE, although few studies have directly measured it 7 and reviews of the literature to determine whether NEAT in humans decreases to compensate or partially compensate for increases in AEE conclude that there is no evidence overall that NEAT systematically changes e.g. 6.
If energy compensation has an underlying genetic basis, in the future it might be possible to screen individuals to ascertain whether exercise would be a valuable fat loss intervention because they are ‘weak compensators’, or a fruitless fat loss intervention because they are strong compensators (while recognising other benefits to exercise including protecting against weight regain 22, 23). Moreover, we need to understand whether there are costs to reducing BEE. If there are, such as for example a compromised immune system or slowed recovery from injury 24, 25, then for some individuals the point at which exercise levels reach a detrimental level will be considerably lower than for others.
The ever growing and diversifying range of fat loss plans and fads available to the public reflects the reality, well known to researchers, that prescribed exercise programmes for weight reduction rarely result in substantive or long-term changes in body mass 26. The few national guidelines that have been published converge on the recommendation of a 500-600 kcal/d deficit through exercising and dieting to instigate fat loss 27. These guidelines are general for the population and do not factor in the variation in energy compensation exhibited by people with different levels of fat mass, as demonstrated in the current study. Public health strategies for fat loss should be revised to recognise energy compensation as our understanding progresses about which individuals compensate and by how much. In this vein, more research is needed on the potentially substantial diversity of energy compensation between sub-populations. In the future, personalised exercise plans targeting fat loss might be developed partly based on an individual’s genetic propensity for energy compensation.
STAR Methods
RESOURCE AVAILABILITY
Lead Contact
Further information and requests should be directed to and will be fulfilled by the lead contact, Lewis Halsey (l.halsey@roehampton.ac.uk).
Materials availability
All the data used in this study have already been published and are available in the public domain; the current manuscript presents a secondary analysis.
Data and code availability
The data reported in this study cannot be deposited in a public repository because they are held by the management group of the IAEA DLW database. To request access, follow the instructions available at https://doubly-labelled-water-database.iaea.org/dataAnalysisInstructions.
The code used for all statistical analyses and the production of data figures has been deposited at Figshare and is publicly available as of the date of publication. The DOI is listed in the key resources table.
Any additional information required to reanalyze the data reported in this paper is available from the lead contact upon request.
Key resources table
| REAGENT or RESOURCE | SOURCE | IDENTIFIER |
|---|---|---|
| Software and algorithms | ||
|
| ||
| Custom-written R code (script) for the analysis and generation of data figures. | Custom-written by the authors. | Figshare. Entitled ‘R script for Current Biology paper ‘Energy compensation and adiposity in humans’: https://figshare.com/articles/software/R_script_for_Current_Biology_paper_Energy_compensation_and_adiposity_in_humans_/15054129 |
EXPERIMENTAL MODEL AND SUBJECT DETAILS
The International Atomic Energy Agency DLW database (v 3.1.2) is a world-wide collection of total energy expenditure (TEE) measurements 10. All TEE measurements were made using the stable isotope method of doubly-labelled water analysis 34, 39, and are based on recalculations of the original data using the latest DLW equations 11. Although the entire database includes over 6,500 DLW measurements between 1981 and 2017, for the purpose of this study the database was restricted to TEE measures accompanied by measurements of BEE via indirect calorimetry. The database was also restricted to adult subjects (>18 y old) and we excluded subjects undergoing intense physical activity including professional sports training, and those who were pregnant, lactating, or diseased. Fat free (lean) mass (FFM) was derived from isotope dilution and fat mass (FM) was calculated by subtracting FFM from total body weight. Note that using total body weight and height-normalized indices of FFM and FM yielded similar results to using FFM and FM. Activity energy expenditure (AEE) was calculated as 0.9*TEE – BEE, assuming that the thermic effect of food accounts for 10% of the total energy budget 40. The average (±sd) physical activity level (PAL=TEE/BEE) of the analysed database was 1.74±0.27 (range: 0.76 – 3.30) and 90% of observations were between 1.35 and 2.18 PAL (5th and 95th quartiles).
METHOD DETAILS
To test the mutually exclusive predictions arising from the energy management models (Figure 1C), we used multiple linear regressions with TEE as the dependent variable and sex, age, FFM, FM, and BEE as independent variables, on some or all of a dataset on 1754 adults. FFM and FM were square-root transformed to reduce the influence of some potentially influential observations at the extreme upper end of the distribution (e.g., 6 observations with >80 kg fat mass).
QUANTIFICATION AND STATISTICAL ANALYSIS
All analyses were conducted in R using bespoke code. Details of the results of those analyses are found in the Results and Discussion section, and the Tables S1 and S2, with visualisation provided in Figures 2–4. Confidence intervals are provided for all regression slope estimates. Results were interpreted as statistically significant when associated with p<0.05. The first multiple regression model was run on the entire dataset to get an overall estimate of the TEE-BEE and AEE-BEE relationships after accounting for sex, age, FFM, and FM (Table S1A). We were then interested to test if the TEE-BEE and AEE-BEE relationships varied by sex, age, and body composition. To do so, we introduced two-way interactions between BEE and sex, age, FFM, and FM (Table S1B). To control for possible sex-and age-related changes in the effects of FFM and FM, we also included two-way interactions between body composition variables (FFM and FM) and sex and age (Table S1B). All independent variables (including sex) were centered prior to analysis, such that significance of main effects are estimated at the average values despite significant interactions in the model 41. We used the visreg function 42 to plot the partial residuals and illustrate the TEE-BEE and AEE-BEE slopes (Figure 2) and the interaction between BEE and FM (Figure 3). For these models, the residuals had homogeneity of variance and were normally distributed, and there were suitably low variance inflation factors for all covariates indicating limited linear covariance between the predictor variables 43.
Bivariate mixed model analysis
The Health, Aging, and Body Composition (Health ABC) study has produced repeated paired measurements of TEE and BEE in elderly men and women 44. The first set of measurements were taken between 1998 and 2000 on subjects in their 8th decade of life. A second set of measurements was carried out in 2006, approximately 7 years after the first 20. We used bivariate mixed models in ASReml-R 45 to partition the relationship between TEE and BEE at the between-vs. within-individual levels in men and women separately. Both TEE and BEE were fitted as response variables in a model that included (anonymous) individual identity as a random effect. This enabled modelling of the between-individual variances (Vbetween) in TEE and BEE as well as the between-individual covariance (COVbetween) between the two. The residuals were also modelled as an unstructured variance-covariance matrix, effectively capturing the within-individual variances (Vwithin) in TEE and BEE as well as the within-individual covariance (COVwithin). The between-individual slope (bbetween) between TEE and BEE was calculated as COVbetween divided by Vbetween in BEE, while the within-individual slope (bwithin) was calculated as COVwithin divided by Vwithin in BEE. Note that the bivariate mixed model included age, FFM, and FM as fixed effects fitted to both TEE and BEE, and as such the slope estimates are conditioned on these variables. Moreover, interactions between age and FFM and age and FM were included to control for potential age-related changes in body composition. To better illustrate the relationship between AEE and BEE, we ran a second bivariate mixed model that was identical to the above except that TEE was replaced by AEE. For each model, assessment of the residuals indicated homogeneity of variance and normality, and suitably low variance inflation factors for all covariates.
Supplementary Material
Acknowledgments
The DLW database, which can be found at https://doubly-labelled-water-database.iaea.org/home is hosted by the IAEA, and generously supported by Taiyo Nippon Sanso and SERCON. We are grateful to the IAEA and these companies for their support and especially to Takashi Oono for his tremendous efforts at fund raising on our behalf. The authors also gratefully acknowledge funding from the US National Science Foundation (BCS-1824466) awarded to Herman Pontzer. The funders played no role in the content of this manuscript. We are grateful for the data submission of David Ludwig and Cara Ebbeling, and for the analysis by Steve Heymsfield of his own data indicating no change in FFM hydration with age in adults.
Footnotes
Declaration of interests
The authors have no conflicts of interest to declare.
References
- 1.Pontzer H, Durazo-Arvizu R, Dugas LR, Plange-Rhule J, Bovet P, Forrester TE, Lambert EV, Cooper RS, Schoeller DA, and Luke A (2016). Constrained total energy expenditure and metabolic adaptation to physical activity in adult humans. Curr. Biol 26, 410–417. [DOI] [PMC free article] [PubMed] [Google Scholar]
- 2.Halsey LG (2021). The mystery of energy compensation. In arxiv. [DOI] [PubMed] [Google Scholar]
- 3.Halsey LG, Green JA, Twiss SD, Arnold W, Burthe SJ, Butler PJ, Cooke SJ, Grémillet D, Ruf T, and Hicks O (2019). Flexibility, variability and constraint in energy management patterns across vertebrate taxa revealed by long-term heart rate measurements. Func. Ecol 33, 260–272. [Google Scholar]
- 4.Riou M-È, Jomphe-Tremblay S, Lamothe G, Stacey D, Szczotka A, and Doucet É (2015). Predictors of energy compensation during exercise interventions: a systematic review. Nutrients 7, 3677–3704. [DOI] [PMC free article] [PubMed] [Google Scholar]
- 5.Halsey L (In Press). The mystery of energy compensation. Phys. Biochem. Zool [DOI] [PubMed] [Google Scholar]
- 6.Fedewa MV, Hathaway ED, Williams TD, and Schmidt MD (2017). Effect of exercise training on non-exercise physical activity: a systematic review and meta-analysis of randomized controlled trials. Sports medicine 47, 1171–1182. [DOI] [PubMed] [Google Scholar]
- 7.Melanson E (2017). The effect of exercise on non-exercise physical activity and sedentary behavior in adults. Obesity Reviews 18, 40–49. [DOI] [PMC free article] [PubMed] [Google Scholar]
- 8.MacKenzie-Shalders K, Kelly JT, So D, Coffey VG, and Byrne NM (2020). The effect of exercise interventions on resting metabolic rate: A systematic review and meta-analysis. Journal of Sports Sciences, 1–15. [DOI] [PubMed] [Google Scholar]
- 9.Speakman JR (1998). The history and theory of the doubly labeled water technique. The American Journal of Clinical Nutrition 68, 932S–938S. [DOI] [PubMed] [Google Scholar]
- 10.Speakman JR, Pontzer H, Rood J, Sagayama H, Schoeller DA, Westerterp KR, Wong WW, Yamada Y, Loechl C, and Murphy-Alford AJ (2019). The International Atomic Energy Agency International Doubly Labelled Water Database: Aims, Scope and Procedures. Annals of Nutrition and Metabolism 75, 114–118. [DOI] [PubMed] [Google Scholar]
- 11.Speakman JR, Yamada Y, Sagayama H, Berman ES, Ainslie PN, Andersen LF, Anderson LJ, Arab L, Baddou I, and Bedu-Addo K (2021). A standard calculation methodology for human doubly labeled water studies. Cell Reports Medicine 2, 100203. [DOI] [PMC free article] [PubMed] [Google Scholar]
- 12.Westerterp KR, Meijer GA, Janssen EM, Saris WH, and Hoor FT (1992). Long-term effect of physical activity on energy balance and body composition. British Journal of Nutrition 68, 21–30. [DOI] [PubMed] [Google Scholar]
- 13.Weinsier RL, Schutz Y, and Bracco D (1992). Reexamination of the relationship of resting metabolic rate to fat-free mass and to the metabolically active components of fat-free mass in humans. The American journal of clinical nutrition 55, 790–794. [DOI] [PubMed] [Google Scholar]
- 14.Hall KD, Ayuketah A, Brychta R, Cai H, Cassimatis T, Chen KY, Chung ST, Costa E, Courville A, and Darcey V (2019). Ultra-processed diets cause excess calorie intake and weight gain: an inpatient randomized controlled trial of ad libitum food intake. Cell metabolism. [DOI] [PMC free article] [PubMed] [Google Scholar]
- 15.Swinburn BA, Sacks G, Hall KD, McPherson K, Finegood DT, Moodie ML, and Gortmaker SL (2011). The global obesity pandemic: shaped by global drivers and local environments. The Lancet 378, 804–814. [DOI] [PubMed] [Google Scholar]
- 16.Rico-Campà A, Martínez-González MA, Alvarez-Alvarez I, de Deus Mendonça R, de la Fuente-Arrillaga C, Gómez-Donoso C, and Bes-Rastrollo M (2019). Association between consumption of ultra-processed foods and all cause mortality: SUN prospective cohort study. bmj 365, l1949. [DOI] [PMC free article] [PubMed] [Google Scholar]
- 17.King NA, Caudwell P, Hopkins M, Byrne NM, Colley R, Hills AP, Stubbs JR, and Blundell JE (2007). Metabolic and behavioral compensatory responses to exercise interventions: barriers to weight loss. Obesity 15, 1373–1383. [DOI] [PubMed] [Google Scholar]
- 18.World_Health_Organisation (2014). Obesity and overweight. Volume Fact Sheet No 311. [Google Scholar]
- 19.Wang Z, Deurenberg P, Wang W, Pietrobelli A, Baumgartner RN, and Heymsfield SB (1999). Hydration of fat-free body mass: review and critique of a classic body-composition constant. The American Journal of Clinical Nutrition 69, 833–841. [DOI] [PubMed] [Google Scholar]
- 20.Cooper JA, Manini TM, Paton CM, Yamada Y, Everhart JE, Cummings S, Mackey DC, Newman AB, Glynn NW, Tylavsky F, et al. (2013). Longitudinal change in energy expenditure and effects on energy requirements of the elderly. Nutr J 12. [DOI] [PMC free article] [PubMed] [Google Scholar]
- 21.Melin A, Tornberg ÅB, Skouby S, Møller S, Sundgot-Borgen J, Faber J, Sidelmann JJ, Aziz M, and Sjödin A (2015). Energy availability and the female athlete triad in elite endurance athletes. Scandinavian journal of medicine & science in sports 25, 610–622. [DOI] [PubMed] [Google Scholar]
- 22.Garber CE, Blissmer B, Deschenes MR, Franklin BA, Lamonte MJ, Lee I-M, Nieman DC, and Swain DP (2011). Quantity and quality of exercise for developing and maintaining cardiorespiratory, musculoskeletal, and neuromotor fitness in apparently healthy adults: guidance for prescribing exercise. [DOI] [PubMed] [Google Scholar]
- 23.Ekelund U, Tarp J, Steene-Johannessen J, Hansen BH, Jefferis B, Fagerland MW, Whincup P, Diaz KM, Hooker SP, and Chernofsky A (2019). Dose-response associations between accelerometry measured physical activity and sedentary time and all cause mortality: systematic review and harmonised meta-analysis. bmj 366. [DOI] [PMC free article] [PubMed] [Google Scholar]
- 24.Thomas Diana M., and Heymsfield Steven B. (2016). Exercise: Is More Always Better? Curr. Biol 26, R102–R104. [DOI] [PubMed] [Google Scholar]
- 25.Pontzer H (2018). Energy Constraint as a Novel Mechanism Linking Exercise and Health. Physiology 33, 384–393. [DOI] [PubMed] [Google Scholar]
- 26.Swift DL, Johannsen NM, Lavie CJ, Earnest CP, and Church TS (2014). The role of exercise and physical activity in weight loss and maintenance. Progress in cardiovascular diseases 56, 441–447. [DOI] [PMC free article] [PubMed] [Google Scholar]
- 27.Mabire L (2016). Physical activity guidelines for weight loss: global and national perspectives. (BMJ Publishing Group Ltd and British Association of Sport and Exercise Medicine; ). [DOI] [PubMed] [Google Scholar]
- 28.Koteja P (1991). On the relation between basal and field metabolic rates in birds and mammals. Func. Ecol 5, 56–64. [Google Scholar]
- 29.Müller MJ, Wang Z, Heymsfield SB, Schautz B, and Bosy-Westphal A (2013). Advances in the understanding of specific metabolic rates of major organs and tissues in humans. Current Opinion in Clinical Nutrition & Metabolic Care 16, 501–508. [DOI] [PubMed] [Google Scholar]
- 30.Speakman JR, and Selman C (2003). Physical activity and resting metabolic rate. Proceedings of the Nutrition Society 62, 621–634. [DOI] [PubMed] [Google Scholar]
- 31.Careau V, Thomas D, Humphries MM, and Réale D (2008). Energy metabolism and animal personality. Oikos 117, 641–653. [Google Scholar]
- 32.Careau V, and Garland T Jr. (2012). Performance, personality, and energetics: correlation, causation, and mechanism. Physiol Biochem Zool 85, 543–571. [DOI] [PubMed] [Google Scholar]
- 33.Ricklefs RE, Konarzewski M, and Daan S (1996). The relationship between basal metabolic rate and daily energy expenditure in birds and mammals. Am Nat 147, 1047–1071. [Google Scholar]
- 34.Speakman JR (1997). Doubly Labelled Water: Theory and Practice, (London: Chapman and Hall; ). [Google Scholar]
- 35.Mathot KJ, and Dingemanse NJ (2015). Energetics and behavior: unrequited needs and new directions. Trends Ecol Evol 30, 199–206. [DOI] [PubMed] [Google Scholar]
- 36.Hand GA, Shook RP, O’Connor DP, Kindred MM, Schumacher S, Drenowatz C, Paluch AE, Burgess S, Blundell JE, and Blair SN (2020). The Effect of Exercise Training on Total Daily Energy Expenditure and Body Composition in Weight-Stable Adults: A Randomized, Controlled Trial. Journal of Physical Activity and Health 17, 456–463. [DOI] [PubMed] [Google Scholar]
- 37.Flack KD, Ufholz K, Johnson L, Fitzgerald JS, and Roemmich JN (2018). Energy compensation in response to aerobic exercise training in overweight adults. American Journal of Physiology-Regulatory, Integrative and Comparative Physiology 315, R619–R626. [DOI] [PMC free article] [PubMed] [Google Scholar]
- 38.Riou M-È, Jomphe-Tremblay S, Lamothe G, Finlayson GS, Blundell JE, Décarie-Spain L, Gagnon J-C, and Doucet É (2019). Energy Compensation following a Supervised Exercise Intervention in Women living with Overweight⁄ Obesity is Accompanied by an Early and Sustained decrease in Non-Structured Physical Activity. Frontiers in physiology 10, 1048. [DOI] [PMC free article] [PubMed] [Google Scholar]
- 39.Lifson N, Gordon GB, and McClintock R (1955). Measurement of total carbon dioxide production by means of D218O. J Appl Physiol 7, 704–710. [DOI] [PubMed] [Google Scholar]
- 40.Westerterp KR (2004). Diet induced thermogenesis. Nutrition & Metabolism 1, 1–5. [DOI] [PMC free article] [PubMed] [Google Scholar]
- 41.Schielzeth H (2010). Simple means to improve the interpretability of regression coefficients. Methods in Ecology and Evolution 1, 103–113. [Google Scholar]
- 42.Breheny P, and Burchett W (2017). Visualization of Regression Models Using visreg. The R Journal 9, 56–71. [Google Scholar]
- 43.Zuur AF, Hilbe J, and Ieno EN (2013). A Beginner’s Guide to GLM and GLMM with R: A Frequentist and Bayesian Perspective for Ecologists, (Highland Statistics). [Google Scholar]
- 44.Bethesda M (2012). National Institute on Aging: Health ABC. (U.S. Department of Health and Human Services. National Institutes of Health; ). [Google Scholar]
- 45.Butler D, Cullis BR, Gilmour AR, Gogel DJ, and Thompson R (2018). ASReml-R reference manual Release 4, (Hemel Hempstead, UK: VSN International Ltd; ). [Google Scholar]
Associated Data
This section collects any data citations, data availability statements, or supplementary materials included in this article.
Supplementary Materials
Data Availability Statement
The data reported in this study cannot be deposited in a public repository because they are held by the management group of the IAEA DLW database. To request access, follow the instructions available at https://doubly-labelled-water-database.iaea.org/dataAnalysisInstructions.
The code used for all statistical analyses and the production of data figures has been deposited at Figshare and is publicly available as of the date of publication. The DOI is listed in the key resources table.
Any additional information required to reanalyze the data reported in this paper is available from the lead contact upon request.
Key resources table
| REAGENT or RESOURCE | SOURCE | IDENTIFIER |
|---|---|---|
| Software and algorithms | ||
|
| ||
| Custom-written R code (script) for the analysis and generation of data figures. | Custom-written by the authors. | Figshare. Entitled ‘R script for Current Biology paper ‘Energy compensation and adiposity in humans’: https://figshare.com/articles/software/R_script_for_Current_Biology_paper_Energy_compensation_and_adiposity_in_humans_/15054129 |