

Abstract
Objective:
To investigate the role of adipocyte Pcpe2 in SR-BI-mediated HDL-C uptake and contributions to adipose lipid storage.
Approach and Results:
Pcpe2, a glycoprotein devoid of intrinsic proteolytic activity, is believed to participate in extracellular protein-protein interactions, supporting SR-BI-mediated HDL-C uptake. In published studies, Pcpe2 deficiency increased the development of atherosclerosis by reducing SR-BI-mediated HDL-C catabolism, but the biological impact of this deficiency on adipocyte SR-BI-mediated HDL-C uptake is unknown. Differentiated cells from Ldlr−/−/Pcpe2−/− (Pcpe2−/−) and Ldlr−/− (control) mouse adipose tissue showed elevated SR-BI protein levels, but significantly reduced HDL-C uptake. SR-BI-mediated HDL-C uptake was restored by pre-incubation of cells with exogenous Pcpe2. In diet-fed mice lacking Pcpe2, significant reductions in visceral, subcutaneous and brown adipose tissue mass were observed, despite elevations in plasma triglyceride and cholesterol concentrations. Significant positive correlations exist between adipose mass and Pcpe2 expression in both mice and humans.
Conclusions:
Overall, these findings reveal a novel and unexpected function for Pcpe2 in modulating SR-BI expression and function as it relates to adipose tissue expansion and cholesterol balance in both mice and humans.
Keywords: adipose tissue, high density lipoprotein metabolism, Pcpe2, SR-BI
Introduction
The loss of procollagen C-endopeptidase enhancer 2 (Pcpe2 or gene name-Pcolce2) has been shown to escalate diet-induced atherosclerosis in mice1, 2 despite increased plasma concentrations of high density lipoproteins (HDL)3, 4. Pcpe2 was first identified in humans around 20 years ago and found to possess a domain structure similar to the more extensively studied Pcpe1 protein5–8, with 43% amino acid sequence identity between the two Pcpe proteins5. Pcpe1 and 2 are believed to be extracellular glycoproteins, devoid of intrinsic proteolytic activity, consisting of two Complement C1r/C1s, Uegf, Bmp1 or CUB domains linked to a C-terminal netrin-like domain (NTR)9–13. Pcpe proteins appear to control multiple biological events, including matrix assembly, collagen cross-linking, as well as cell adhesion, migration and pattern protein-1/tolloid (BMP-1/Tld) family of metalloproteinases14–18. However, further study and comparison of the two forms of the protein demonstrated significant differences, as Pcpe2 has a limited tissue distribution compared to Pcpe1, as well as a markedly different glycosylation pattern19. Whereas Pcpe1 is found predominantly in fibroblasts, Pcpe2 is mainly expressed in adipose, artery and heart tissue. Therefore, despite similarities in structure, these two glycoproteins may in fact function quite differently in vivo.
Our initial focus on Pcpe2 and HDL metabolism was heavily influenced by Francone’s studies using global Pcpe2-deficient mice4, which showed a significant increase in both plasma HDL-cholesterol (HDL-C) concentration and HDL particle size. To determine if the enlarged HDL particles from Pcpe2-null mice were atheroprotective or atherogenic, we crossed Pcpe2 and LDL receptor-deficient mice to produce Ldlr−/−, Pcpe2−/− mice and measured the extent of diet-induced atherosclerosis1. We found a ~46% increase in atherosclerosis in mice lacking Pcpe2 despite having an increased concentration of plasma HDL1. Attenuation of SR-BI receptor-mediated HDL uptake by the liver appeared to explain the increased plasma HDL concentration,1 showing a striking similarity to SR-BI-null mice that have increased HDL concentrations, yet increased vascular disease20. Interestingly, in addition to increased HDL-C in Pcpe2-null mice, there was a ~2-fold increase in plasma triglycerides compared to controls, independent of the LDL receptor deletion or the diet1, 4. Increased plasma triglyceride concentration is also a feature of SR-BI-deficient mice as it has been reported to participate in chylomicron uptake21. Thus, we next sought to address the question of why cholesterol and triglyceride metabolism was altered in the absence of Pcpe2, and how these pathways might be linked to the defect in HDL-C uptake.
In humans, plasma HDL concentrations are inversely and statistically correlated with cardiometabolic disease22, 23. For instance, in type 2 diabetes, increased plasma triglyceride levels and lower plasma HDL-C concentrations are tightly correlated24, 25. At the onset of obesity, adipocytes increase in size as they accommodate the demand for increased triglyceride storage. The expansion of adipocytes either in number or volume, reduces the amount of triglycerides in plasma lipoproteins, as well as reducing lipid deposition in tissues such as muscle and liver26. Adipocytes contain ~25% of the body’s free cholesterol27 which increases to as much as 50% in obese states, thereby creating a reservoir of adipocyte cholesterol28. The extent to which plasma lipoproteins contribute to the adipose tissue cholesterol pool had not been fully investigated until studies using differentiated murine embryonic fibroblasts (MEFs) from ABCA1, ABCG1 and SR-BI-null mice quantified the extent of cholesterol efflux from adipocytes to HDL29. These studies and others clearly established a role for HDL in adipocyte cholesterol trafficking30–32 showing that ABCA1 and SR-BI in adipocytes make significant contributions to the maintenance of plasma HDL concentrations.
Guided by these collective studies, we investigated the role of Pcpe2 and SR-BI in adipocyte lipid metabolism. To do this, stromal vascular (SVF) cells from the subcutaneous adipose tissue (SAT) of Ldlr−/− and Ldlr−/−, Pcpe2−/− mice were isolated and differentiated in vitro, and then assayed for their ability take up DiI-HDL. Herein we report a significant reduction in HDL-C uptake from Ldlr−/−, Pcpe2−/− adipocytes compared to Ldlr−/− adipocytes, which was rescued by pre-incubation of Pcpe2 protein with the cells prior to uptake measurements. Our results suggest that protein-protein interactions between Pcpe2 and SR-BI are involved in HDL-C mediated uptake. In vivo, we found that diet-fed Ldlr−/−, Pcpe2−/− mice accumulated less fat mass than control mice at the end of a 25-week diet-challenge independent of overall body weight. The decrease in adipose tissue mass was associated with a reduction in adipose tissue cholesterol content and a reciprocal increase in plasma HDL-C concentrations. Taken together, in the absence of Pcpe2, the reduction in adipocyte DiI-HDL uptake in vitro is consistent with the lower in vivo cholesterol content in SAT, suggesting that the Pcpe2 - SR-BI partnership physiologically contributes to the maintenance of adipose tissue cholesterol. Overall, these findings reveal a novel and unexpected function for Pcpe2 in modulating SR-BI expression and function as it relates to adipose tissue expansion and cholesterol balance in both mice and humans.
Methods
Data Availability Statement.
The authors declare that all data are available within the article upon request.
Animals and Diet.
Male and female Ldlr−/−, Ldlr−/−/Pcpe2−/− and Ldlr−/−/Scarb1−/− (Sr-b1) mice on the C57BL/6J background were generated as described previously1. Numbers of specific genotypes used for each study/assay are indicated. The colony was maintained in microisolator cages in a pathogen-free AAALAC-accredited facility at the Medical College of Wisconsin (MCW) under controlled environment settings. Mice were maintained on a 14-hour light and 10-hour dark cycle with ad libitum access to water and standard lab diet. In experimental studies, mice were placed on a high fat-high cholesterol diet for 20–25 weeks (Bio-Serv#3282) starting at 10 weeks of age. This diet contained 60% of calories as fat and 0.15% cholesterol. Mice were fasted prior to being anesthetized with ketamine/xylazine for glucose and tissue harvest. Euthanasia and blood collection were by cardiac puncture. All experiments followed guidelines of the MCW Animal Care and Use Committee and the approval of the use of rodents was obtained from MCW according to criteria outlined in the Guide for the Care and Use of Laboratory Animals.
Intraperitoneal Glucose and Insulin Tolerance Test.
For the oral glucose tolerance test, mice were fasted 4 hours and prior to administration of a glucose solution (2.5 g/kg of body weight) by ip injection33. Tail venous blood was taken at 0, 15, 30, 60 and 120 minutes and glucose measured using a glucometer. For the insulin tolerance test, male mice were fasted for 4 hours, after measurement of baseline glucose concentration, mice were injected intraperitoneally with recombinant human insulin (Novo Nordisk) at 1.2 mU/g body weight. Blood glucose concentrations were then measured at 15,30,60 and 120 min after insulin administration. Plasma insulin was measured using the Rat/Mouse Insulin ELISA Kit (Millipore).
Tissue Harvest and Histological Staining.
At the time of necropsy, visceral, subcutaneous and brown adipose tissue as well as liver, heart and muscle tissue were removed and weighed. Pieces of selected tissue from diet-fed male and female mice were treated with fixative then embedded into paraffin and stained in the Pathology Histology Core Facility at MCW. Tissues were stained with hematoxylin and eosin stain (H & E), Movat’s pentachrome and monoclonal antibodies to F4/80. Section images were digitized using a Nikon microscope and Image-Pro Plus 6.2 software. Dishes (30 mm) of differentiated SVF adipocytes were fixed using 1 ml of 2% PFA for 30 minutes at RT. Following fixation, adipocytes were washed with water then incubated with isopropanol for 5 minutes. Next, 1.5 ml of Oil Red O working solution (Oil Red O at 2 g/l, 60% isopropanol, 40% water) were added to each well for 5 minutes, then washed with water to remove unbound Oil Red O.
RNA Seq Analysis.
RNA extraction from visceral fat pads from n=4 male Ldlr−/− and n=4 male Ldlr−/−Pcpe2−/− mice was performed using TRIzol following manufactures instructions. Then cDNA libraries were prepared using a TruSeq Stranded mRNA LT Set B Illumina kit. The quality of the cDNA libraries was assessed using an Agilent 2100 Bioanalyzer and Agilent DNA 1000 kit. Final quantification of prepared libraries was performed using qRT-PCR and MiSeq 50. RNA sequencing was performed on the HiSeq 2500 using TrusSeq v4 SBS chemistry and 2x125 paired-end reads. Primary RNAseq analysis was performed through an analytical pipeline consisting of Bowtie and Tophat for read mapping and alignment, Cufflinks for transcript assembly, Cuffquant for transcript abundance quantification, Cuffnorm for normalization, and Cuffdiff for differential expression. These analyses yielded a total of 44,560 IDs mapped. Libraries yielded 6–7 Gb of data with approximately 60–76 million reads each. Mean quality score of 35 with an average mapping rate of over 90%. Gene-transcript abundances were quantified as fragments per kilobase per million reads. Ingenuity Pathway Analysis was used to analyze genes exhibiting significant expression alterations, with a false discovery rate (FDR) of p<0.02 compared to control.
Non-Detergent Isolation and Fractionation of Lipid Rafts:
Subcellular fractions were prepared as previously described34. Briefly, approximately 200 mg of freshly isolated mouse subcutaneous adipose was homogenized on ice in 10 mM Tris pH 8.0 buffer containing protease inhibitors and 1 mM MgCl2, 1 mM PMSF, 1 mM Na3VO4, 5 mM NaF, using a polytron probe. The cell lysate was centrifuged and the supernatant was adjusted to 45% sucrose. This was overlayed sequentially with a 35% sucrose solution and then a 5% sucrose solution. The tubes were spun in an SW41 rotor overnight at 15oC. Following the spin, the tubes were fractionated and then stored at −80oC till needed for Western blot analysis using antibodies to caveolin-1, a marker of lipid-raft fractions, and c-crk a marker for non-raft regions of the plasma membrane.
Western Blotting.
Protein extracts were prepared using 1X RIPA buffer (Cell Signaling Technologies) and a final concentration of 0.5 mM PMSF and 1X protein inhibitor cocktail (Sigma). Protein concentration was determined by BCA assay (Pierce). Protein extracts were diluted in 4X LDS sample buffer (Life Technologies) to which DTT had been added to achieve a 50 mM final concentration. Samples were heated to 70 °C for 10 minutes, run on 10% polyacrylamide gels then transferred to PVDF membrane (PerkinElmer) using a semi-dry blot apparatus (Bio-Rad). Membranes were blocked with a 5% blocking buffer (Bio-Rad), incubated in primary antibodies; Pcpe2 (Abcam, Ab23272), CD36 (R&D AF2519), beta-actin (Sigma A2228) SR-BI (Novus, NB400–101) at 4 °C overnight. The next day the blot was washed and treated with a horseradish peroxidase-conjugated secondary antibody for 30 minutes at room temperature. Finally, blots were washed and incubated with Clarity (Bio-Rad, 170–5060) and visualized with X-ray film. Band intensities were compared using ImageJ software (NIH).
Quantitative Real-Time PCR.
Total RNA from undifferentiated and differentiated SVF-derived adipocytes were isolated using RNeasy Lipid Tissue Mini Kit (Qiagen). RNA was quantitated by nanodrop and first-strand synthesis was performed using ThermoFisher Scientific RevertAid First Stand cDNA synthesis kit. Real-time PCR was done with SsoAdvanced Universal SYBR Green Supermix (Bio-Rad) using 18S as an internal control for normalization and a Bio-Rad CFX384/C1000 PCR detection system. Relative gene expression levels were calculated by the quantitative threshold (Ct) method (∆∆Ct). All primer sequences will be provided upon request.
Plasma Cholesterol and Triglyceride Measurement.
Fasted mouse plasma was analyzed for total cholesterol (Pointe Scientific) and triglyceride (FUJIFILM Wako Diagnostic) using enzymatic assays.
Lipid Extraction.
Lipids were extracted from weighted tissue by heating in chloroform/methanol (2:1) overnight at 70–80oC. Then 4 µg of [25,26,27-13C3]-cholesterol was added as internal standard for cholesterol analyses. A nonpolar lipid fraction containing cholesterol and cholesteryl esters was separated using the method of Kaluzny et al.35. The eluate was evaporated under a stream of nitrogen, dissolved in 1 ml of 1:1 chloroform-methanol, and stored at −80°C until analyzed.
Tissue Cholesterol Quantification by GC/MS.
For free cholesterol analysis, 100 µl of extract was evaporated under argon, dissolved in hexane, and then analyzed on a ThermoElectron TSQ 8000 tandem quadrupole mass spectrometer equipped with a Trace 1310 gas chromatograph (GC/MS/MS) and Triplus RSH autoinjector. The following parameters were employed: scan time 0.1 s, collision energy 10 V, emission current 25 µA, electron energy 42 eV, source and transfer line temperature 280° C, helium flow rate = 2.5E-8 m3/s, in the positive ion selective reaction monitoring mode: cholesterol, m/z 386.4→301.3; [25,26,27-13C3]-cholesterol, m/z 389.9→304.3. Analysis was carried out using a TG-SQC column (15 m x 0.25 mm I.D.) with a 0.25-µm film thickness. For quantifying TC 100 µl of extract was dried under a stream of nitrogen, dissolved in 1 ml of ethanol, mixed with 100 µl of 50% (w/w) aqueous potassium hydroxide, sparged with nitrogen, and then saponified for 1 hour at 65° C. After hexane extraction total cholesterol was measured by GC/MS/MS and cholesteryl ester calculated as the difference between free cholesterol and total cholesterol as previously reported36.
Lipase Activity Assay.
Measurements of lipoprotein and hepatic lipase were performed using the method described in Garcia-Arcos et al.37. Briefly, to measure hepatic triglyceride production rate, post-heparin plasma was drawn from fasted mice 5 minutes after tail vein injection of 100 units of heparin/kg body weight. Plasma was mixed with 10% Intralipid/[3H]triolene emulsion as substrate with human serum for apolipoprotein CII. Hepatic lipase activity was determined by including 1 mM NaCl in the solution. Lipoprotein lipase activity was determined by subtracting the hepatic lipase numbers from the total lipase activity38.
Tissue Triglyceride Quantification.
Tri-heptadecanoyl-glycerol (Nu-Chek Prep) was added to approximately 250 ul of the lipid extract then dried down and dissolved in 500 µl of hexane using a procedure reported by Kaluzny et al. with minor modifications35 and similar to our previous report1. Cholesteryl esters were removed by washing with 12 ml of 4% methylene chloride in hexane (v/v) then triglyceride was eluted with 24 ml of 15% methylene chloride, 1% tert-butyl methyl ether, in hexane (V/V/V). The eluate was dried with a stream of nitrogen then dissolved in 1 ml hexane. One hundred µl of the triglyceride fraction was dried down, diluted with 1 ml ethanol, mixed with 100 µl of 50% aqueous KOH, and then heated at 65°C for 1 hr. After cooling, 1 ml of water and 3 ml hexane were added then vortexed, and the hexane layer discarded. The aqueous layer was acidified to <pH 3 and extracted with 3 ml of hexane. The hexane layer was removed, then dried down under nitrogen, to which 1 ml 14% BF3 in methanol was added. The tube was flushed with nitrogen, capped then vortexed and heated at 100°C for 5 minutes. After cooling, 2 ml of hexane and 4 ml saturated aqueous NaCl solution were added, vortexed, and then 1 ml of hexane removed. Hexane was removed under nitrogen at 35°C then resuspend in enough hexane to achieve a final concentration for methyl heptadecanote of 0.08 ng/ml. GC/MS FAME analysis was conducted using electron impact ionization in the positive ion mode, scanning from 200 m/z to 400 m/z in 0.2 s: emission current 25 µA, electron energy 42 eV, source and transfer line temperature 280° C, helium flow rate = 2.5E-8 m3/s. Analysis was carried out using a TG-SQC column (15 m x 0.25 mm I.D.) with a 0.25-µm film thickness. Individual FAMEs were identified by retention time and characteristic ion fragments. The integrated FAME results were converted to moles, the mole sum for each tissue divided by three, and then the total mass of the triglyceride calculated.
Isolation, Culture and Differentiation of Subcutaneous SVF into Adipocytes.
Murine SVF from male and female mouse SAT were obtained from 4–6 week--old mice of each genotype as previously described39. Briefly, 300–400 mg of adipose tissue from two mice of each genotype was digested for 2 hours at 37oC in 100 mM HEPES containing 1 mM CaCl2, 120 mM NaCl, 50 mM KCl, 5 mM glucose, 1.5% BSA and 1 mg/ml Collagenase D (Roche). Digested cell/tissue mixture was filtered through a 100 micron strainer to remove undigested tissue. The flow-through cells were centrifuged for 5 minutes at 1,800 rpm at room temperature. The cell pellet was resuspended in SVF growth medium which consisted of DMEM/F12, GlutaMAX, Pen/Strep, and 10%FBS. The cells were filtered through a 40 micron cell strainer to remove debris and large adipocytes. The flow through was centrifuged for 5 minutes at 1,800 rpm at RT and the SVF pellet was then resuspended in SFV maintenance medium and plated on a single 60 mm collagen coated plate. The medium was changed the next day and on day 3–4 when the cells were >85% confluent, the cells were lifted and aliquoted into 96 well plates for uptake assays, 12 well plates for RNA and/or 6 well plates for protein extraction. For adipocyte differentiation, 48 hours after cells had become 100% confluent, adipocyte differentiation medium was added, containing 0.5 mM 3-isobutyl-1-methyl-xanthine, 1 μM dexamethasone, 5 μg/ml insulin, and 1 μM rosiglitazone in SVF growth medium. After 3 days this medium was replaced with a maintenance medium containing 5 μg/ml insulin, and 1 μM rosiglitazone in SVF growth medium.
DiI-HDL Uptake and Localization.
SVF adipocytes derived from control and Pcpe2-deficient mice were isolated as described and differentiated in 96 well black polystyrene plates (Griener Cellstar) for 6 days. On the day of the assay, the wells were washed with 1 X PBS three times and the background fluorescence in each well was measured in PBS using CLARIOstar plate reader with Ex/Em 541/590. The HDL uptake assay was performed by adding a final concentration of 10 µg/ml of DiI-HDL protein in serum-free SVF growth medium which was incubated for 0 to 1.5 hour at 37°C in a tissue culture incubator. After the timed incubation, the medium was removed and the cells were washed 3 times with 1 X DPBS and the cell-associated fluorescence was measured in DPBS using CLARIOstar plate reader with Ex/Em 541/590. The background fluorescence was subtracted for each well from the cell-associated DiI-HDL fluorescence and was then normalized to the adipogenic index for each well. For gain of function assays, SVF adipocytes differentiated for 6 days were incubated with 100 ng/ml of mouse Pcpe2-His in serum-free growth medium for 1.5 hour. Unbound Pcpe2-His was removed by washing with 1X PBS and then the DiI-HDL uptake assay was performed as described. Additional imaging of wells was performed on Lionheart FX epifluorescence microscope (BioTek) using the 10X objective and optical filters for capturing phase contrast, blue (DAPI), green (DiI-HDL) and far red (Nile red).
Adipogenic Index.
The adipogenic index was assessed as previously described40. Following the DiI-HDL uptake assay, the cells were fixed in 2% PFA for 30 minutes at RT. Cellular lipid droplets were stained with 1.25 ug/ well Biodipy 493/503 (Invitrogen) and cell nuclei were stained with 5 ug/well DAPI (Biolegend) for 30 minutes at RT in the dark. After staining, cells were washed 3 times with 1 X PBS and imaged with a CeligoS cytometer (Nexcelom Bioscience) to capture each whole well image. Quantification of the number of nuclei in each well was done in ImageJ by applying Gaussian Blur (3 Sigma), thresholding, performing watershed calculation for segmentation, and counting on DAPI images. Quantification of lipid accumulation, expressed as the Bodipy-stained area, was done in ImageJ by applying Gaussian Blur (2 Sigma), thresholding, and quantifying the total area above the threshold on Bodipy images. The adipogenesis level, expressed as the adipogenic index, was calculated by dividing the area per well stained with lipid by the number of cell nuclei in each well.
Perilipin Immunofluorescence Microscopy.
Culture medium was removed from cells, then washed with DPBS followed by treatment with 2% PFA. After 30 minutes the PFA solution was removed, the cells washed twice with PBS, and then treated with 200 µl of DAKO protein block (Dako). Cells were then treated with 200 µl rabbit anti-perilipin (Cell Signaling) diluted 1:100 with 1 mg/ml saponin in 1:1 Protein Block:PBS. After 1 hour at room temperature the primary antibody was removed, the cells washed three times with PBS, then treated with 200 µl of the secondary antibody anti-rabbit IgG-DyLight549 (Rockland) diluted 1:1000 with PBS. After 1 h in the dark at room temperature the secondary antibody was removed, and the cells washed three times with PBS. Next, 200 µl DAPI mixture, NucBlue® (Life Technologies), diluted 1:2 in PBS was added and allowed to stand for 5 minutes at RT. The DAPI solution was removed and the cells washed three times with PBS. One drop of antifade mounting media (Life Technologies) was added to a cover slip. The cover slip was placed on top of cells and then allowed to dry overnight. Samples were stored at 4°C until examined. A Zeiss LSM 510 confocal microscope and associated software were used to view the results and capture images.
Plasmids.
Mouse Pcpe2 was cloned into a mammalian expression vector under the control of the CMV promoter. The Gaussia luciferase secretion signal was used at the N-terminus of the construct and a GGGGS linker was added at the C-terminus immediately followed by an 8xHis tag (TOP Gene Technologies Inc). Expansion of the plasmid was carried out using PureLink ExpiEndotoxin-Free maxi plasmid purification kit (Invitrogen).
Purification of Mouse Pcpe2.
The ExpiCHO system (ThermoFisher Sci) was used to express full-length glycosylated Pcpe2 following manufacturer’s instructions. For large-scale production, ExpiCHO cells were amplified in 250 ml sterile plastic Erlenmeyer flasks. Cells were grown to a density of 6 x 10⁶ cells/ml then transfected with mouse Pcpe2-GGGGS-6His containing plasmid using ExpiFectamine CHO reagent. Cell viability and cell density were monitored daily and when cell viability dropped below 80% (3 days), cell culture medium was separated from cells and dialyzed extensively against 10 mM ammonium bicarbonate pH 7.4 at 4oC to remove EDTA. Dialyzed medium was loaded onto Ni Sepharose Excel column (GE Healthcare) then washed with 10 column volumes of 25 mM ammonium bicarbonate pH 7.4, 500 mM NaCl, 20 mM imidazole. His-tagged mouse Pcpe2 was eluted with 3 column volumes of 25 mM ammonium bicarbonate pH7.4, 500 mM NaCl, 500 mM Imidazole and 6 M guanidine hydrochloride. Following elution, the Pcpe2 protein was exhaustively dialyzed against 25 mM ammonium bicarbonate pH7.4 to remove guanidine hydrochloride. Protein concentration was determined using BCA assay and purity assessed by SDS-PAGE followed by QC Colloidal Coomassie staining of the gel (Bio-Rad).
System Genetics Resource-Hybrid Mouse Diversity Panel (HMDP).
One hundred inbred strains of male and female mice were maintained on a standard lab diet (6% kcal from fat) until 8 weeks of age and subsequently placed on a high-fat/high-sucrose (HF/HS) diet (32% kcal from fat and 25% kcal from sucrose) for 8 weeks41, 42. At 16 weeks of age, body composition was measured with MRI and mice were sacrificed after an overnight fast. Subcutaneous, retroperitoneal, gonadal, and mesenteric fat pads were collected and weighed. Visceral fat percentage for each mouse was calculated by summing the weights of retroperitoneal, gonadal, and mesenteric fat pads and dividing the sum with the overall body fat amount obtained from MRI measurements. Gene expression was measured from flash-frozen epididymal adipose tissue samples with Affymetrix HT_MG430A. Gene expression-phenotype correlations (biweight midcorrelation) and their significance were calculated with the bicor function in the WGCNA package in R43.
Metabolic Phenotyping.
Mice underwent metabolic phenotyping as previously described44, 45. Briefly, body composition was analyzed using time domain NMR (Bruker LF110), and ingestive behaviors, physical activity, and respirometric gas exchange were assessed continuously for 96 hours (i.e. Monday to Friday) using a 16-chamber Promethion system (Sable Systems International). Heat production rates were estimated using the modified Weir equation46.
Human Study Design and Methods.
Data were obtained from morbidly obese subjects participating in a study on the determinants of the metabolic syndrome (RESOLVE; http://www.resolve-diabetes.org/). Metabolic assessments were performed before and one year after bariatric surgery. Adipose tissue biopsies were performed during and one year after surgery. Inclusion and exclusion criteria have been described earlier, briefly a total of forty-one individuals eligible for bariatric surgery were included, as described47. This analysis included baseline and one-year follow-up data from morbidly obese patients, respectively, who underwent RYGB surgery and from whom data on SAT tissue transcriptomics were available. Biopsies were collected from abdominal SAT via needle aspiration under local anesthesia during euglycemic-hyperinsulinemic clamp; thus, taken under hyperinsulinemic conditions, before and one year after surgery. To assess whole-body insulin sensitivity, we calculated the homeostatic model assessment of insulin resistance (HOMA-IR) as described48. Gene expression was determined by mRNA sequencing. Library construction and sequencing outsourced to GenomeScan B.V. Paired-end reads were produced by Illumina HiSeq 4000. R statistical package version 3.2.3 (R Foundation for Statistical Computing, Vienna, Austria) was used to analyze the data. The quality of the sequenced reads was assessed by the FastQC version 0.11.5 dupRadar version 1.0.049, and Picard50 tools (https://bioinformaticshome.com/tools/rna-seq/descriptions/Picard.html). The adaptor sequences and low-quality bases were trimmed from the reads using Trimmomatic51. Quality trimmed raw reads were aligned to the latest version of the human genome using HISAT52, and counts were obtained at the gene level using HTSeq version 0.6.152. Statistical analyses were performed using the edgeR53 and limma/voom R packages54. Genes without counts across all the libraries were removed. Genes with more than 1 count-per-million reads in at least 15 of the samples were kept for downstream analysis. Count data were transformed to log2-counts per million, normalized by applying the trimmed mean of M-values method53 and precision weighted using the voom method55. Genes were re-annotated using current Ensembl BioMart databases version 90. Before correlation analyses, Shapiro-Wilk tests were performed to assess the right method of use (i.e., Pearson- or Spearman’s rank correlation coefficient). The phenotypic differences between groups were assessed using one-way ANOVA for continuous variables with Bonferroni post hoc tests and X2 tests for categorical variables. The threshold for statistical significance was set at p<0.05. A related-samples Wilcoxon signed-rank test was performed, and data are presented as mean±SD.
Statistics.
Data are presented as mean ± SD and all statistical analysis was done using GraphPad Prism 8 software. For 2-group comparisons, Student t test was used for data that passed normality test; Mann-Whitney U test was used if data failed normality test. For experiments with more than two groups, p values were calculated using on-way or two-way ANOVA as indicated for normally distributed data and Tukey’s multiple comparison test. Metabolic rate measures were corrected for the covariate of body mass via generalized linear modeling, using SPSS 24.
Results
Adipocytes deficient in Pcpe2 show elevated SR-BI expression.
To investigate SR-BI-mediated HDL-C uptake in adipocytes, SVF cells were isolated from SAT of Ldlr−/− (control) and Ldlr−/−/Pcpe2−/− (Pcpe2−/−) mice and then differentiated into adipocytes. This approach was utilized to monitor SR-BI and Pcpe2 gene expression during and at the end of SVF differentiation. Figure 1A illustrates the timeline for isolation and differentiation of SVF cells into adipocytes. Typically, true adipocyte morphology with visible neutral lipid accumulation revealed by Oil Red O begins around day 3 after differentiation (D3) or 10 days post SVF isolation shown in Figure 1B. By day 6 of differentiation (D6), lipid droplets are evenly distributed on the surface and stain intensely for neutral lipid (Figure 1B). Microscopic examination of lipid droplets are shown in Figure 1C (a,c,e) for control, and (b,d,f) for Pcpe2−/− cells. Figure 1C (a,b) show phase contrast images (10X), (c,d) Oil Red O stain for neutral lipids (40X), and (e,f) perilipin-stained droplet membranes with DAPI stained nuclei by confocal microscopy (40X). Overall, these images suggest that differentiated SVF adipocyte morphology is similar regardless of the genotype of origin. This similarity is likely a reflection of the effective differentiation and maintenance medium used to drive adipogenesis.
Figure 1. Adipocytes deficient in Pcpe2 have elevated SR-BI expression.
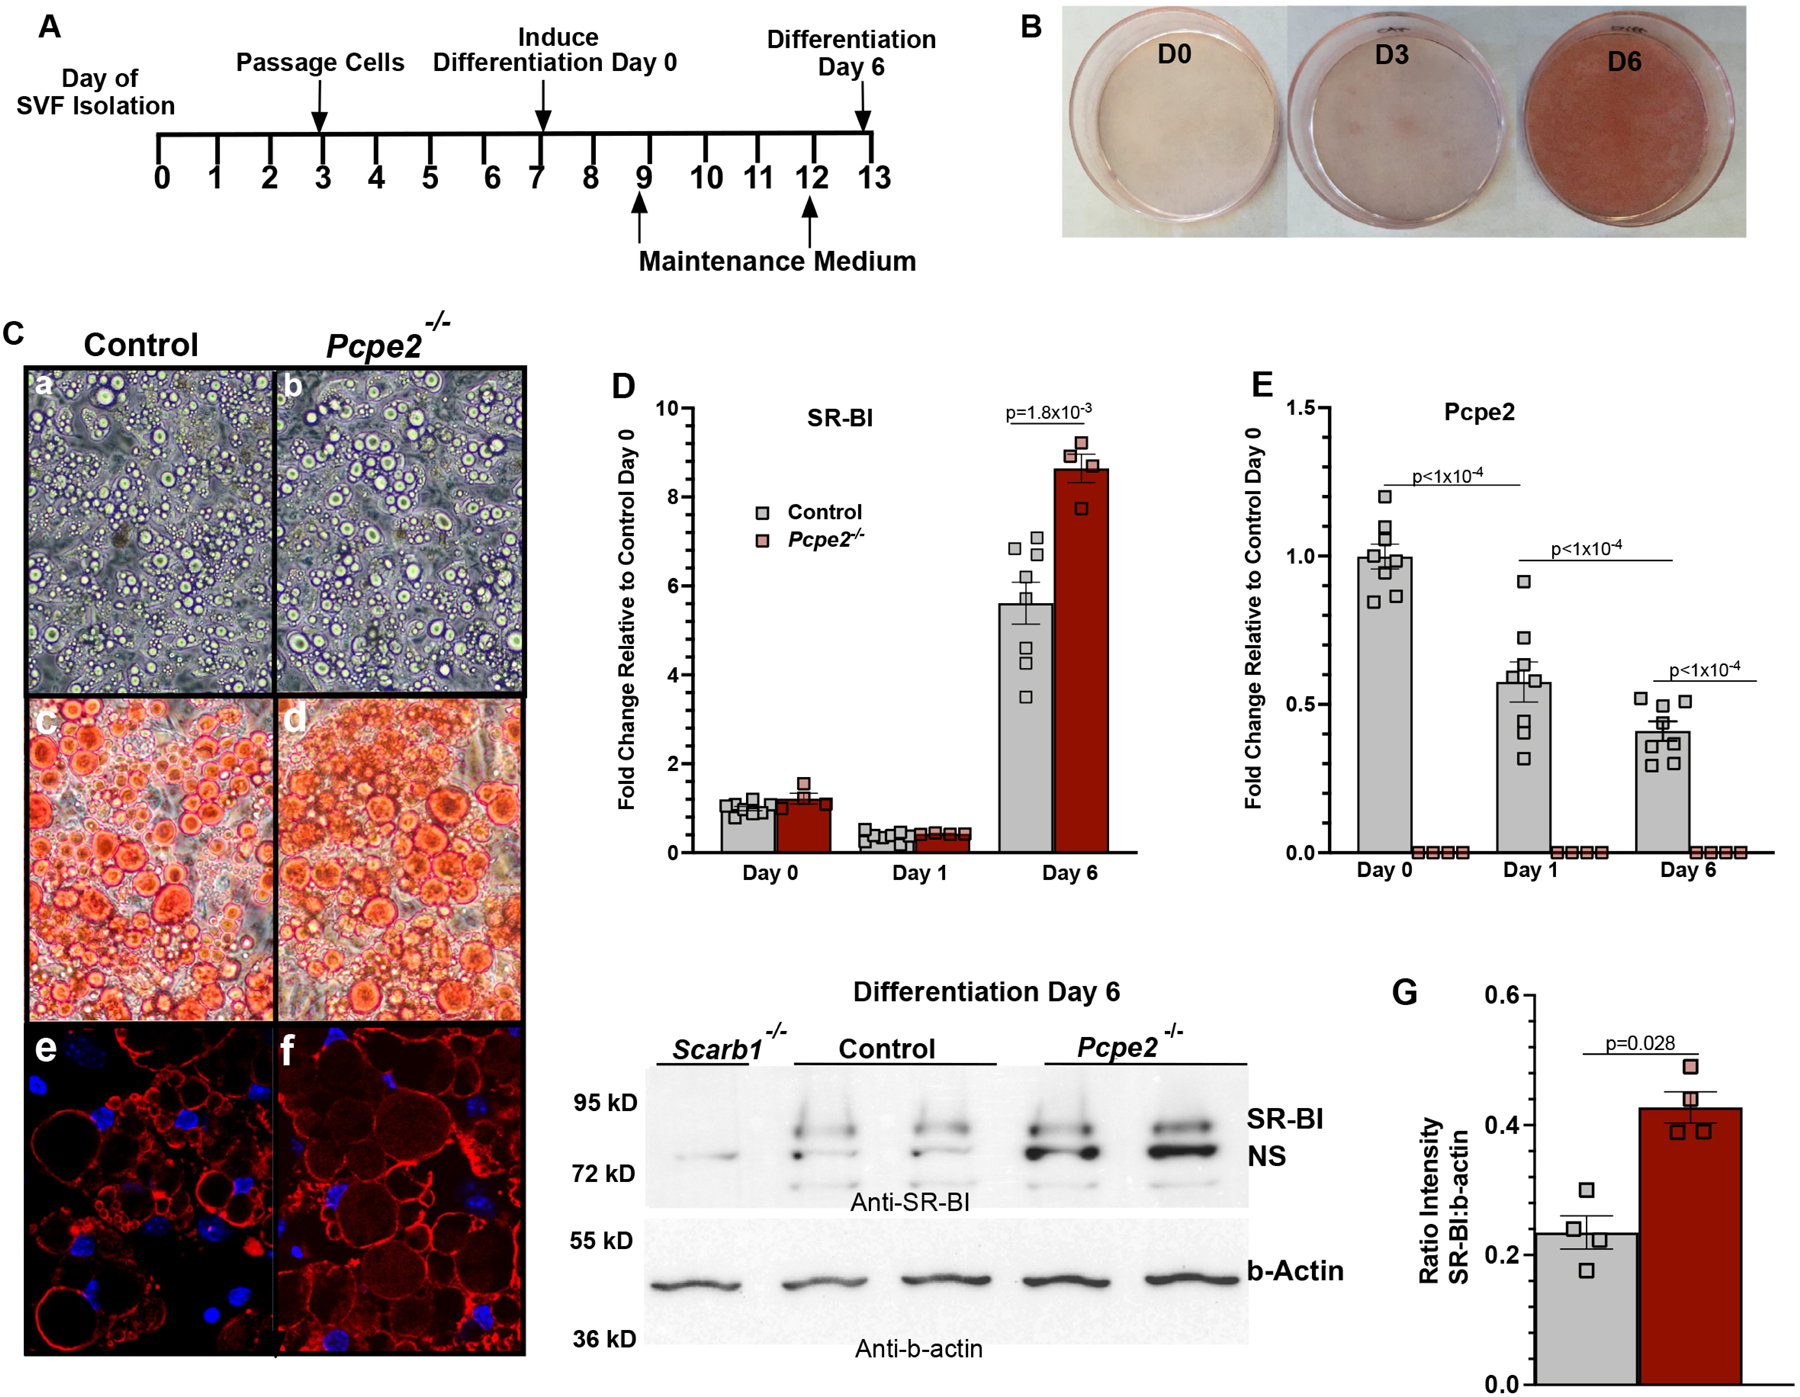
(A) Timeline for SAT SVF isolation and differentiation from Ldlr−/− (control) and Ldlr−/−/Pcpe2−/− (Pcpe2−/−) male mouse adipose tissue (B) Neutral lipid droplets in differentiated adipocytes on day 0 (D0), day 3 (D3) and day 6 (D6) visualized by Oil Red O staining. (C) Micrographs of lipid droplets from control andPcpe2-/−. Images represent phase contrast images (10X) (panels a,b), Oil Red O staining of neutral lipids (40X) (panels c,d) and perilipin-stained droplet membranes and DAPI stained nuclei by confocal microscopy (40X) (panels e,f). (D-E) Fold change in mRNA abundance on indicated day of differentiation for SR-BI and Pcpe2. RT PCR values represent the mean ± SD, n=4–8 male mice per genotype. Data analyzed by ANOVA with Tukey’s multiple correction test. (F) Western blots were probed for SR-BI and b-actin using protein extracts (n=2 male mice per genotype) from day 6 differentiated SVF adipocytes. Note: NS= non-specific protein similar in molecular weight to SR-BI was detected in adipocytes from SR-BI knockout tissue (Scarb1−/−). (G) Quantification of the SR-BI intensity relative to b-actin.
During adipocyte differentiation, mRNA abundance for SR-BI Figure 1D, and Pcpe2 Figure 1E was quantified by RT PCR up to 6 days post-differentiation. RNA was isolated from cells after 6 days of differentiation then assayed. The data show that SR-BI mRNA abundance increased ~6–9-fold from the start of differentiation to day 6, while Pcpe2 mRNA expression showed a significant stepwise reduction in expression from day 0 to 6. Interestingly on day 6, SR-BI mRNA abundance in Pcpe2-null cells was ~45% higher than in control cells. This increase was also verified by performing Western blot on protein extracts from day 6 differentiated cells and quantified, shown in Figures 1F and G, respectively. Protein extracts from mice lacking SR-BI were included as controls since another protein, marked as non-specific (NS), similar in size to SR-BI cross reacted with the antibody (Fig 1F).
Adipose Tissue SR-BI expression is increased in the absence of Pcpe2.
To further explore how Pcpe2 deficiency impacts SR-BI expression, genome-wide gene expression studies were conducted by sequencing mRNA derived from mouse visceral adipose tissue. Figure 2A shows the total number of differentially expressed genes, 99 down-regulated (blue) and 356 upregulated (red) from diet-fed male mice (n=3–4 per genotype) (FDR <0.01; log2(FC)=1.5). The complete list of differentially regulated genes can be found in Supplemental Table I. Careful analysis of differentially expressed genes (DEG) revealed a subset of genes related to lipid metabolism presented in Figure 2B heatmap. Ingenuity pathway analysis identified two major pathways, lipid metabolism and extracellular matrix-receptor interactions as most highly represented in this data set shown in Figure 2C. To verify these results, RT PCR was performed on RNA from mouse adipose tissue shown in Figure 2D. Both type 2 scavenger receptors, SR-BI and CD36, had significantly increased mRNA abundance in Pcpe2-deficient adipose tissue, consistent with RNA seq analyses. We next performed Western blot analysis on adipose tissue protein extracts to specifically examine the levels of SR-BI abundance shown in Figure 2E. Consistent with our RNA seq data and RT PCR mRNA abundance data, the protein abundance of SR-BI was increased ~40–50% in Pcpe2−/− VAT compared to controls. Thus, elevated levels of SR-BI protein was seen in both VAT and SAT (data not shown) in Pcpe2-deficient mice compared to controls. Also of interest, both collagen 6 and TGFb1 mRNA levels were increased in Pcpe2−/− mouse tissue (Figure 2D) which suggest that pathways controlling cellular rigidity of the adipose tissue matrix are upregulated56. Taken together, these studies confirm that deletion of Pcpe2 results in an increase in adipocyte SR-BI protein expression and suggests that differentiated SVF adipocytes can provide a relevant physiological surrogate for testing SR-BI receptor functionality.
Figure 2. Increased Expression of SR-BI in adipose tissue in the absence of Pcpe2.
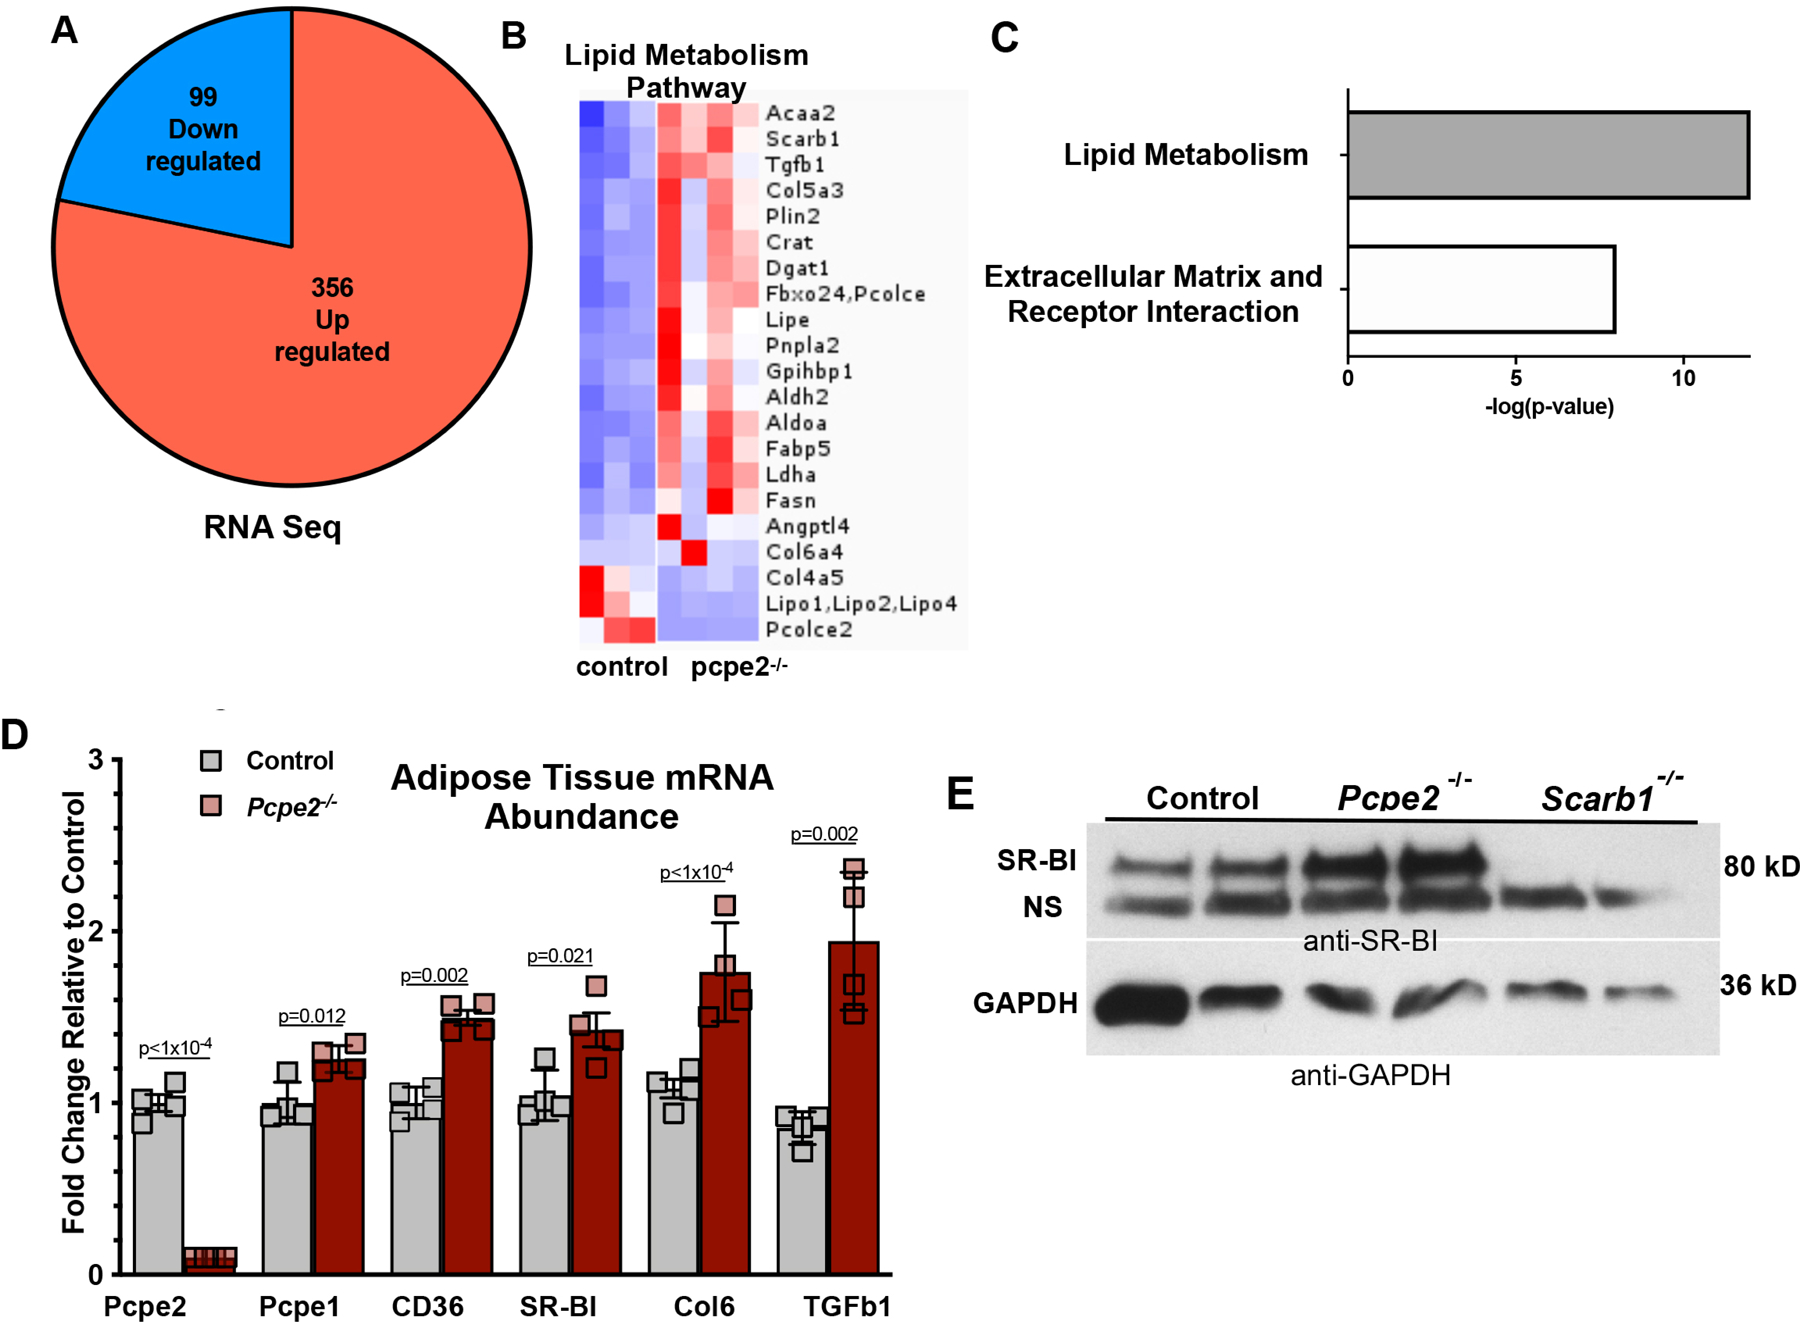
(A) Sequencing of adipose tissue RNA from Ldlr−/− (control) and Ldlr−/−/Pcpe2−/− (Pcpe2−/−) mice showed 99 down regulated (blue) and 356 upregulated (red) differentially expressed genes (DEG) in aged-matched male mice (n=3–4 per genotype) fed HFHC diet for 25 weeks (FDR <0.01; log2(FC)=1.5). A complete list of differentially expressed VAT genes in Supplemental Table I. (B) Heatmap of DEG. (C) Ingenuity pathway analysis showed lipid metabolism and extracellular matrix-receptor pathways as the most highly represented. (D) RT PCR mRNA abundance in male diet-fed VAT for selected genes. Data expressed as mean +/− SD. (E) Western blot analysis of SR-BI abundance from VAT protein extracts from male control and Pcpe2−/− mice fed a HFHC diet for 25 weeks. VAT protein extracts from Ldlr−/−/Scarb1−/− mice were included as a negative control. Note: NS=non-specific protein similar in molecular weight to SR-BI was detected in SR- BI knockout VAT protein extracts. Images are representative of two independent Western blot experiments.
SR-BI-mediated DiI-HDL uptake is dysfunctional in adipocytes lacking Pcpe2.
Day 6 differentiated SVF adipocytes were used to measure HDL-C uptake after incubation of cells with 10 µg/ml DiI-HDL for 0.5 and 1.5 hours, shown in Figure 3A. After 0.5 hour of incubation Pcpe2−/− and Scarb1−/− cells took up slightly less (33%) DiI-HDL compared to controls (Ctr) cells. After 1.5 hour of incubation with DiI-HDL, a greater difference (~50%) in uptake was seen between cells lacking Pcpe2 and Ctr. These results show that SR-BI mediated uptake of HDL-C in Pcpe2−/− derived adipocytes is reduced to the same level as uptake of DiI-HDL in adipocytes lacking SR-BI. To account for possible variation from well to well with regard to cell number or lipid droplet number/size among genotypes, DiI-HDL uptake was normalized to the adipogenic index40 for each well. Figure 3B shows the average adipogenic index for n=4 individual experiments expressed as the total neutral lipid-bodipy-stained area per well divided by the number of DAPI stained nuclei per well. A lack of differences in adipogenic index among genotypes is in agreement with histological examination (Figure 1C) and show that differences in DiI-HDL uptake was the result of functional changes in mechanism and not to differences in cell morphology or number. These results strongly suggest that SR-BI mediated HDL uptake requires the physical participation of Pcpe2.
Figure 3. Dysfunctional SR-BI-mediated DiI-HDL uptake in adipocytes lacking Pcpe2.
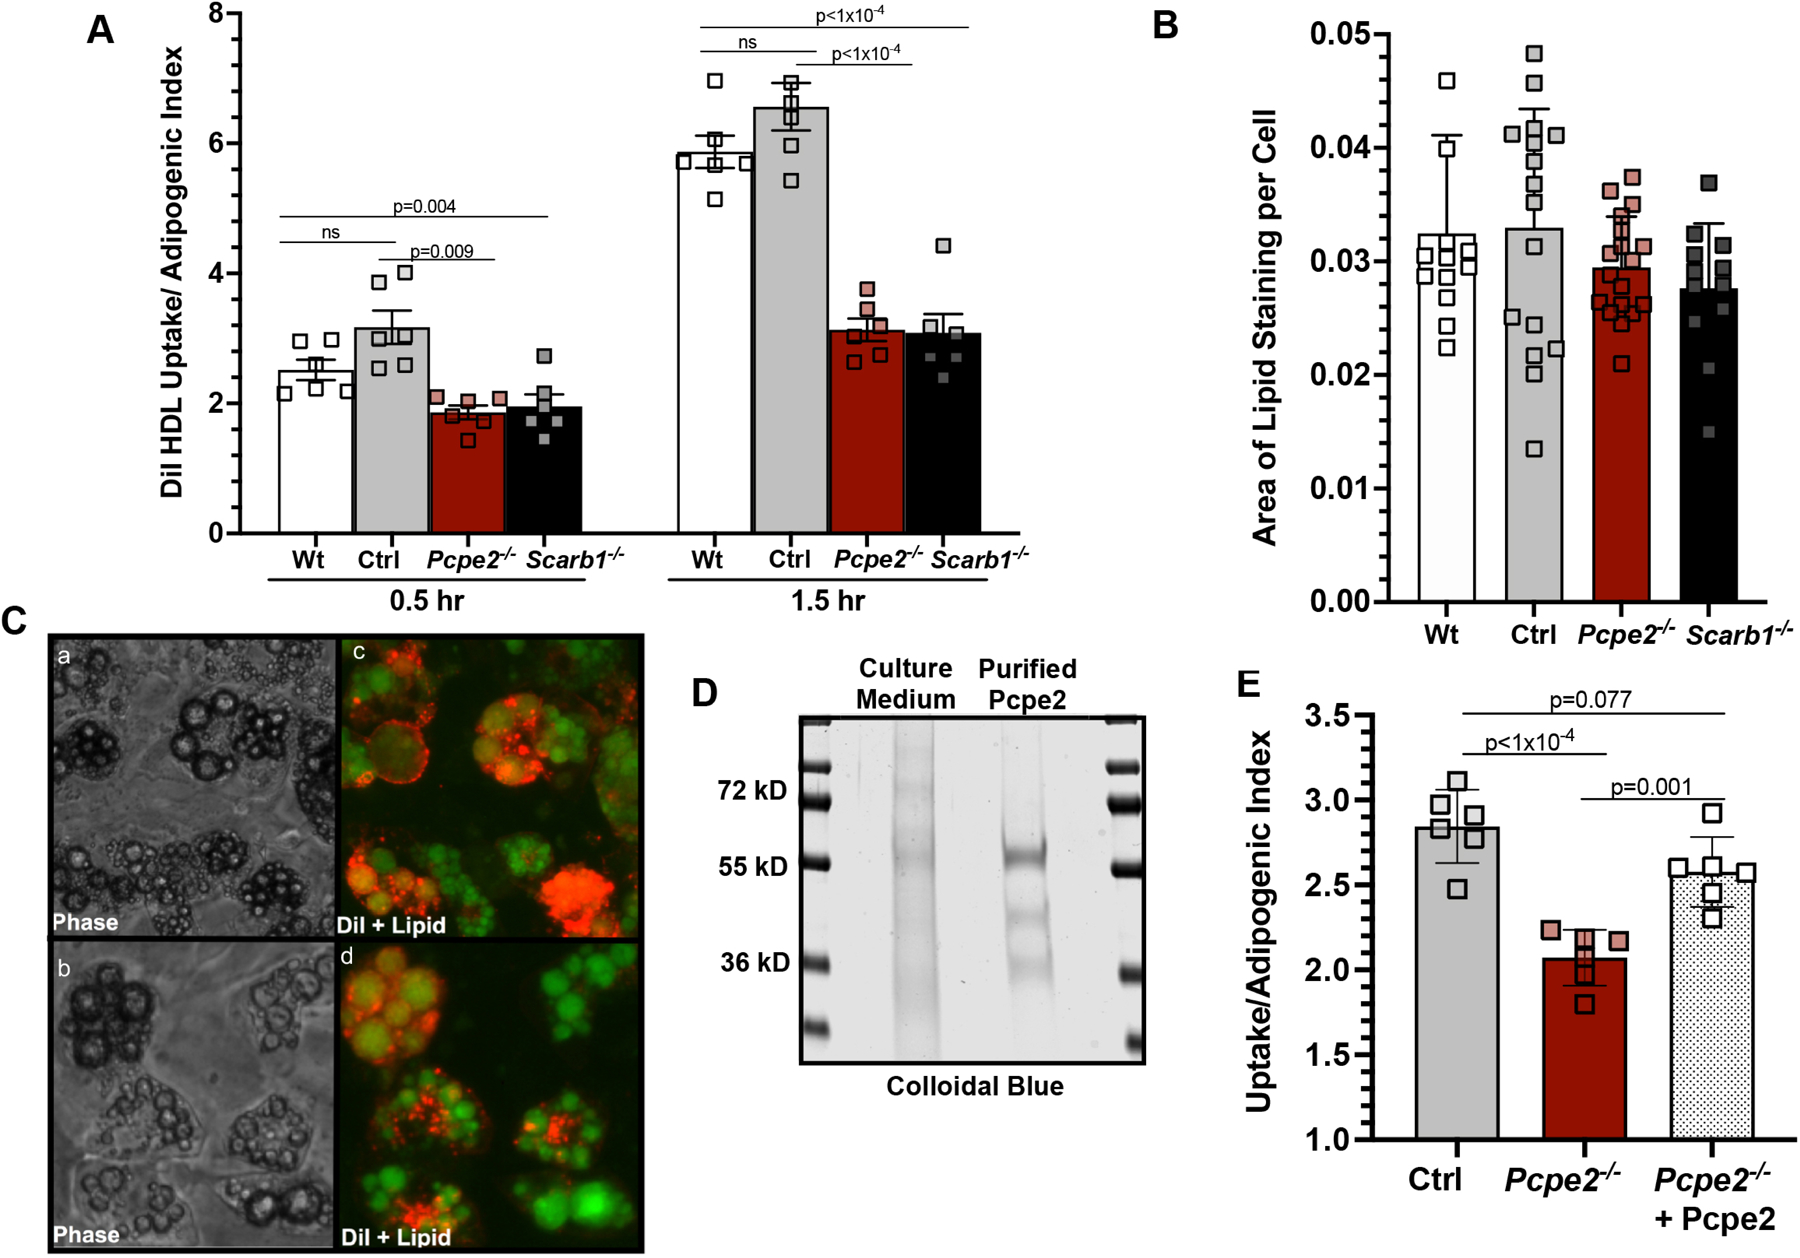
(A) DiI-HDL uptake (10 µg/ml) was measured in day 6 differentiated SVF adipocytes from wild-type (C57BL/6J), Ldlr−/− (Ctrl), Ldlr−/−/Pcpe2−/− (Pcpe2−/−) and Ldlr−/−/Scarb1−/− (Scarb1−/−) cells for 0.5 and 1.5 hours. Uptake normalized to adipogenic index (total area of neutral lipid-stain divided by total DAPI stained nuclei per well). Six wells with 20,000 cells per well were used for each genotype. Data represents average of 4 individual experiments (mean ± SD). (B) adipogenic index for day 6-differentiated SVF adipocytes Wt, Ctrl, Pcpe2−/− and Scarb1−/− mice. (C) Representative (10X) phase contrast (panels a,b) and fluorescent images (panels c,d) of DiI-HDL (red) and bodipy-stained lipid droplets (green) in control (panels a,c) and Pcpe2−/− (panels b,d) cells from day 6 differentiated adipocytes following 1.5 hour incubation with DiI-HDL. (D) SDS- PAGE gel stained with colloidal blue indicates purity of Pcpe2-His protein from 72-hour post-transfection culture medium after Ni-Sepharose purification. Additional details in Supplemental Figure II. (E) Pre-incubation of day 6 differentiated SVF cells lacking Pcpe2 with purified Pcpe2-His protein rescued uptake. Data were analyzed by ANOVA with Tukey’s multiple correction test. lot experiments.
We next visualized the cellular localization of DiI-HDL in adipocytes after 1.5 hour incubation following extensive washes to remove unbound material. Figure 3C shows phase contrast images (a,b) and fluorescent images (c,d) of DiI-HDL (red) and bodipy-stained droplets (green) in control (a,c) and Pcpe2−/− (b,d) cells. These data show the DiI-HDL is largely located at the periphery of droplet membranes within the cell.
SR-BI localization was next investigated, since it known that this receptor translocates into lipid-rafts for activity57. Shown in Supplemental Figure I, SAT was used to prepare non-detergent extracted lipid-rafts. Following ultracentrifugation and fractionation of the extracts, individual fractions were probed by Western blot for localization of SR-BI, in the presence or absence of Pcpe2. In control (Ctr) SAT, caveolin-1, a marker of lipid-rafts, traffics to the cholesterol-rich fraction 2, while c-Crk, a marker of cholesterol-poor membranes or non-raft is found in fraction 6, shows very little Cav-1. When fractions were probed for SR-BI, Ctr SAT showed that SR-BI was localized in both fractions 2 and 6, while in Pcpe2-deficient SAT, there was very little SR-BI in the lipid-raft or cholesterol-rich region and mainly found in the fraction 6 or the non-raft region. These data clearly suggest that the presence of Pcpe2 influences the distribution of SR-BI between lipi-raft and non-raft regions in SAT tissue.
Based on the reduction in DiI-HDL uptake in the absence of Pcpe2, we next wondered if the addition of exogenous Pcpe2 protein to cells lacking Pcpe2 would restore DiI-HDL uptake. To test this, Pcpe2 protein was purified by expressing a His-tagged full-length mouse Pcpe2 construct in ExpiCHO cells, followed by nickel column chromatography. Supplemental Figure II shows details of the construct used, its expression in CHO cells and the characterization of the full-length mouse Pcpe2-His glycoprotein. To test our hypothesis, day 6 differentiated Pcpe2−/− adipocytes were first pre-treated with or without 100 ng/ml of Pcpe2-His for 1.5 hour. Then after pre-treatment with Pcpe2-His protein, cells were washed and then incubated with 10 ug/ml DiI-HDL for 1.5 hour shown in Figure 3E. The results show that DiI-HDL uptake by differentiated Pcpe2−/− adipocytes was impaired compared to control cells as seen previously, however, uptake of DiI-HDL was restored in cells pre-treated with Pcpe2-His (Pcpe2−/− + Pcpe2 protein). Thus, these results suggest that Pcpe2 may act directly to facilitate DiI-HDL uptake into adipocytes by either binding first to HDL and presenting the particle to SR-BI on the cell surface, or first binding to SR-BI and inducing changes to the receptor that make it more likely to take up HDL-C or to both.
Next experiments were conducted to explore whether SR-BI independent pathways contribute to DiI-HDL uptake in differentiated SVF adipocytes. Shown in Supplemental Figure III, DiI-HDL uptake by differentiated Scarb1−/− adipocytes, as previously shown, was impaired when compared to control cells. However, when Scarb1−/− cells were pre-treated with 100 ng/ml of Pcpe2-His, uptake of DiI-HDL was still impaired. These results suggest that Pcpe2 acts predominately in conjunction with SR-BI to facilitate DiI-HDL uptake into adipocytes. This process may proceed through Pcpe2 first binding to HDL and then presenting the particle to SR-BI on the cell surface, or by the binding of Pcpe2 to SR-BI, which then induces changes to the receptor conformation thus promoting uptake of HDL- C.
Reduced adipose tissue expansion and improved glucose clearance in Pcpe2-deficient mice.
Given the role Pcpe2 plays in lipid uptake, we next addressed the question of whether mice deficient in Pcpe2 would show alterations in adipose tissue expansion in response to a dietary challenge. To test this, Ldlr−/− (control) and Ldlr−/−/Pcpe2−/− (Pcpe2−/−) mice were fed a standard lab diet until 10 weeks of age, after which both male and female mice were switched to a high fat/high cholesterol (HFHC) diet for 25 weeks. At the end of the study, body weights, fat pad mass and GTT were performed. Figure 4A shows body weights after 25 weeks of the HFHC diet in which there was no significant difference between genotypes for either male or female mice. Figure 4B–D show mouse fat pad weights for VAT, SAT and BAT were all lower in Pcpe2−/− male and female mice compared to control mice, respectively.
Figure 4. Reduced adipose tissue expansion in Pcpe2−/− mice is independent of body weight.

Male and female Ldlr−/− (control) and Ldlr−/− Pcpe2−/− (Pcpe2−/−) mice (10 weeks of age) were fed a high fat/high cholesterol (HFHC) diet for 25 weeks. At the end of the study, (A) body weights were measured and (B-D) VAT, SAT and BAT pads were removed and weighed. (E) Male and (G) female HFHC-fed mice were fasted for 4–5 hours and glucose tolerance tests were performed, with (H) area under the curve (AUC) calculated. All values represent the mean ± SD, n=11–15 male or female mice per genotype. Data were analyzed by ANOVA with Tukey’s multiple correction test.
This reduction in adipose tissue mass appeared to be independent of the LDL receptor gene, as shown in Supplemental Figure IVA–B. Here, C57BL/6J and Pcpe2−/− only mice were compared for body weight and SAT mass after 25 weeks of HFHC-diet feeding. Mice with and without LDL receptor deficiency showed a statistically significant difference in overall body weight and adipose mass, in agreement with previous reports58,59. While LDL receptor deficiency did have an effect on the overall total mass compared to mice with functioning LDL receptors, mice lacking only Pcpe2 still showed a statistically significant decrease in SAT mass compared to controls, indicating that the effect of Pcpe2 on adipose tissue storage was independent of the LDL receptor. With the reduction in SAT mass, Pcpe2−/− only mice also showed improved glucose clearance, Supplemental Figure IVC–D.
Glucose tolerance test for male and female mice Ldlr−/− (control) and Ldlr−/−/Pcpe2−/− (Pcpe2−/−) are also consistent with a reduction in adipose tissue mass, shown in Figure 4E–G show the results of area under the curve (AUC) from each genotype. Both male and female Pcpe2−/− mice showed improved glucose clearance compared to control mice. Interestingly, these data are in agreement with data in which Scarb1−/− mice were fed a high fat diet and showed improved glucose handling compared to control mice60. The improvement in glucose uptake did not appear to be consistent with greater insulin sensitivity, as shown in Supplemental Figure IVE–G. Although a trend for faster glucose clearance following an insulin tolerance test was noted in Ldlr−/− /Pcpe2−/− mice, this did not reach statistical significance. Rather, Ldlr−/−/Pcpe2−/− mice showed a statistically significant 1.5-fold increase in the expression of the glucose transporter type 4 or Glut4 mRNA abundance in SAT when compared to control mice, as shown in Supplemental Figure IVH. This increase in SAT Glut4 expression likely contributes to the improved glucose clearance in the absence of Pcpe2. Consistent with our observation, Scarb1−/− mice fed a high fat diet also showed a ~3-fold increase in adipose tissue Glut4 expression compared to wild-type mice60. The contribution of fatty acid oxidation and mitochondrial gene expression was also examined. Both lactate dehydrogenase a (ldha) and aldehyde oxidase 1 (aox1) mRNA were statistically elevated in Ldlr−/−//Pcpe2−/− mice compared to controls, as shown in Supplemental Figure IVD, suggesting enhanced fatty acid oxidation in the absence of Pcpe2.
Hypertrophy and reduced cholesterol in Pcpe2-deficient mouse adipose tissue.
We next conducted studies to examine adipose tissue, both microscopically and compositionally, in diet-fed Ldlr−/− (control) and Ldlr−/−/Pcpe2−/− (Pcpe2−/−) mice. Figure 5A shows representative whole fat pads from VAT, SAT, and BAT taken from HFHC-fed control and Pcpe2−/− male mice. In addition, Figure 5A shows microscopic examination of representative sections of VAT, SAT and BAT after H & E-staining (20X). These data show that the loss of Pcpe2 leads to enlarged or hypertrophic adipocyte structure in response to adipose expansion in both VAT and SAT. In order to quantify the extent of the hypertrophic expansion, Figure 5B shows a graph of the percent of VAT cells within a given size range for every 100-um2 area. These data were derived from tissue sections from four male mice per genotype (>500 cells counted/genotype). Asterisks indicate significance at p<0.05. Additionally, we performed histology on SAT to examine connective tissue content between genotypes, since Pcpe2 has been previously linked with C-terminal collagen processing. Figure 5C shows that Movat’s pentachrome staining (20X) of SAT suggest little to no difference in connective tissue content in SAT between genotypes.
Figure 5. Hypertrophy and reduced cholesterol content are observed in Pcpe2- deficient mouse adipose tissue.
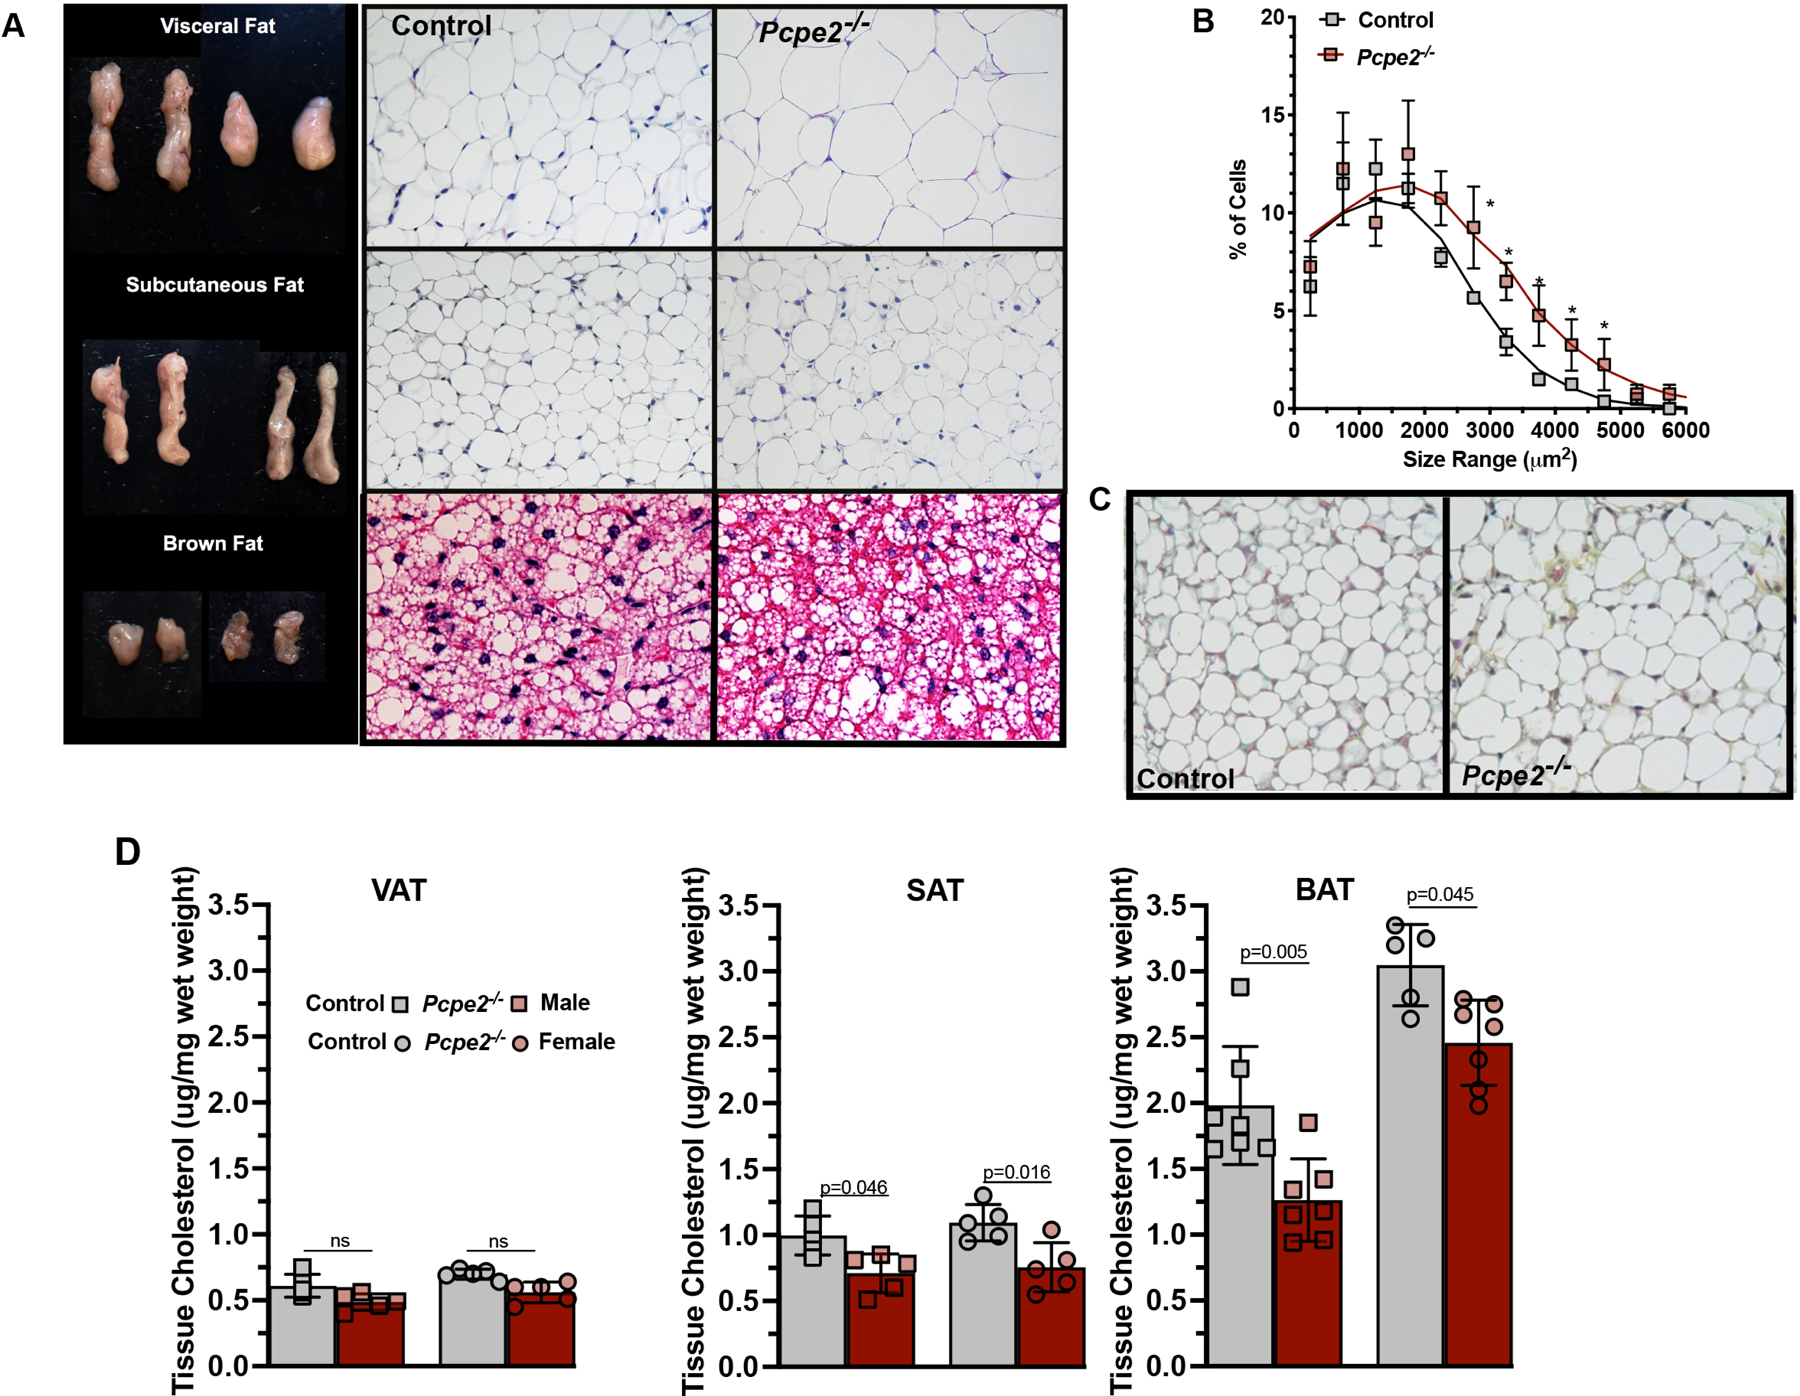
(A) Representative fat pads from VAT, SAT, and BAT from indicated genotypes and their corresponding H & E-stained images (20X) are shown. (A) The percent of VAT cells within a given size range for every 100-um2 area was determined from tissue from four male mice per genotype (>500 cells counted/genotype). *p<0.05. (C) Images of Movat’s pentachrome staining of SAT (20X) from Ldlr−/− (control) and Ldlr−/− Pcpe2−/− (Pcpe2−/−) mice suggest similar collagen content between genotypes. (D) Male and female control and Pcpe2−/− mice were fed HFHC diet for 25 weeks, sections of VAT, SAT and BAT tissue were taken at the time of necropsy and extracted lipids were analyzed by GC-mass spectrometry for total cholesterol and normalized to wet weight. All values represent the mean ± SD, n=5– 8 male and female mice per genotype. Data were analyzed by ANOVA with Tukey’s multiple correction test.
We next examined adipose tissue cholesterol and triglyceride content in diet-fed Pcpe2-deficient mice. From previous work, we knew that both plasma cholesterol and triglyceride levels were elevated in the absence of Pcpe21, but the impact of Pcpe2 deletion on tissue lipid content was unknown. Plasma lipid levels, consistent with earlier reports show elevated plasma cholesterol and triglyceride concentrations in Pcpe2-null mice compared to control mice, Supplemental Figure VA and B. Next, we examined heparin releasable lipoprotein lipase and hepatic lipase activity in plasma and found a significantly lower activity in Pcpe2−/− male mice compared to controls, Supplemental Figure VC. The decrease in both heparin releasable lipoprotein and hepatic lipase likely contributes to the increased plasma triglyceride levels seen in mice lacking Pcpe2. Then tissue cholesterol was analyzed in VAT, SAT and BAT tissue and shown in Figure 5D. Interestingly, in Pcpe2-deficient mice, SAT and BAT but not VAT showed statistically significant reductions in tissue cholesterol content in both male and female mice, although a trend for lower cholesterol was seen in VAT. It is also interesting to note that tissue cholesterol content per wet weight increased with VAT to SAT and then BAT depot. Tissue triglyceride content for VAT, SAT and BAT shown in Supplemental Figure VD revealed an increase in tissue triglyceride per wet weight in mice lacking Pcpe2 as well as a reduction in triglyceride content from VAT, to SAT and BAT. Taken together, these data suggest that in the absence of Pcpe2, lipid balance between plasma and adipose tissue compartments are altered.
Chronic adipose tissue expansion and obesity are characterized by an increased inflammatory state, during which macrophages are recruited into the tissue to enhance local inflammatory pathways. SAT tissue from diet-fed Pcpe2−/− mice was compared to control mice both histologically and by RT PCR. Supplemental Figure VIA shows representative F4/80 immunohistochemical staining of SAT sections(20X) from Pcpe2−/− and control mice as an indicator of macrophage infiltration into tissue. Supplemental Figure VIB shows quantitative real-time PCR analysis of inflammatory and cytokine gene expression in SAT. A general decrease in local inflammation marker expression was seen from the levels of IL-6, F4/80 and CCL2 (MCP-1) in Pcpe2-null mice compared to controls. These data suggest that despite the hypertrophic state of SAT adipocytes in Pcpe2- deficient mice, there appears a reduced inflammation state, perhaps as a result of changes in the extracellular matrix composition as a result of the loss of Pcpe2. These changes may also be linked to the up-regulation of SR-BI expression, suggesting a connection between adipose tissue expansion, lipid content and SR-BI mediated delivery of HDL cholesterol and the extracellular matrix.
Metabolic changes induced by the absence of Pcpe2.
To test whether the absence of Pcpe2 would result in fundamental differences in metabolic parameters, we placed male and female Ldlr−/− (control) and Ldlr−/−/Pcpe2−/− (Pcpe2−/−) mice into metabolic chambers. We performed calorimetry measurements on mice that had been fed a HFHC diet for ~22 weeks. Shown in Supplemental Figure VIIA, there was no difference in body weight, in agreement with Figure 4A. In addition, there was no statistically significant difference in food intake, as shown in Figure 7B, although a trend was noted suggesting that Pcpe2 mice consume less food than controls in the dark cycle. This trend could be accounted for in part by the statistically significant reduction in locomotion, Supplemental Figure VIIC, in both the light and dark cycle. No change in the respiratory exchange ratio was noted but a statistically significant increase was seen in the maximum energy expenditure (EE), Supplemental Figure VIID–E, which was significantly higher in the Pcpe2-deficient mice compared to controls during the dark cycle. Overall, these data suggesting that Pcpe2 deficiency impacts the metabolic state of both male and female mice towards increased energy expenditure, despite a lower food intake and locomotion.
Figure 7. Partnership between Pcpe2 and SR-BI in HDL-C uptake.
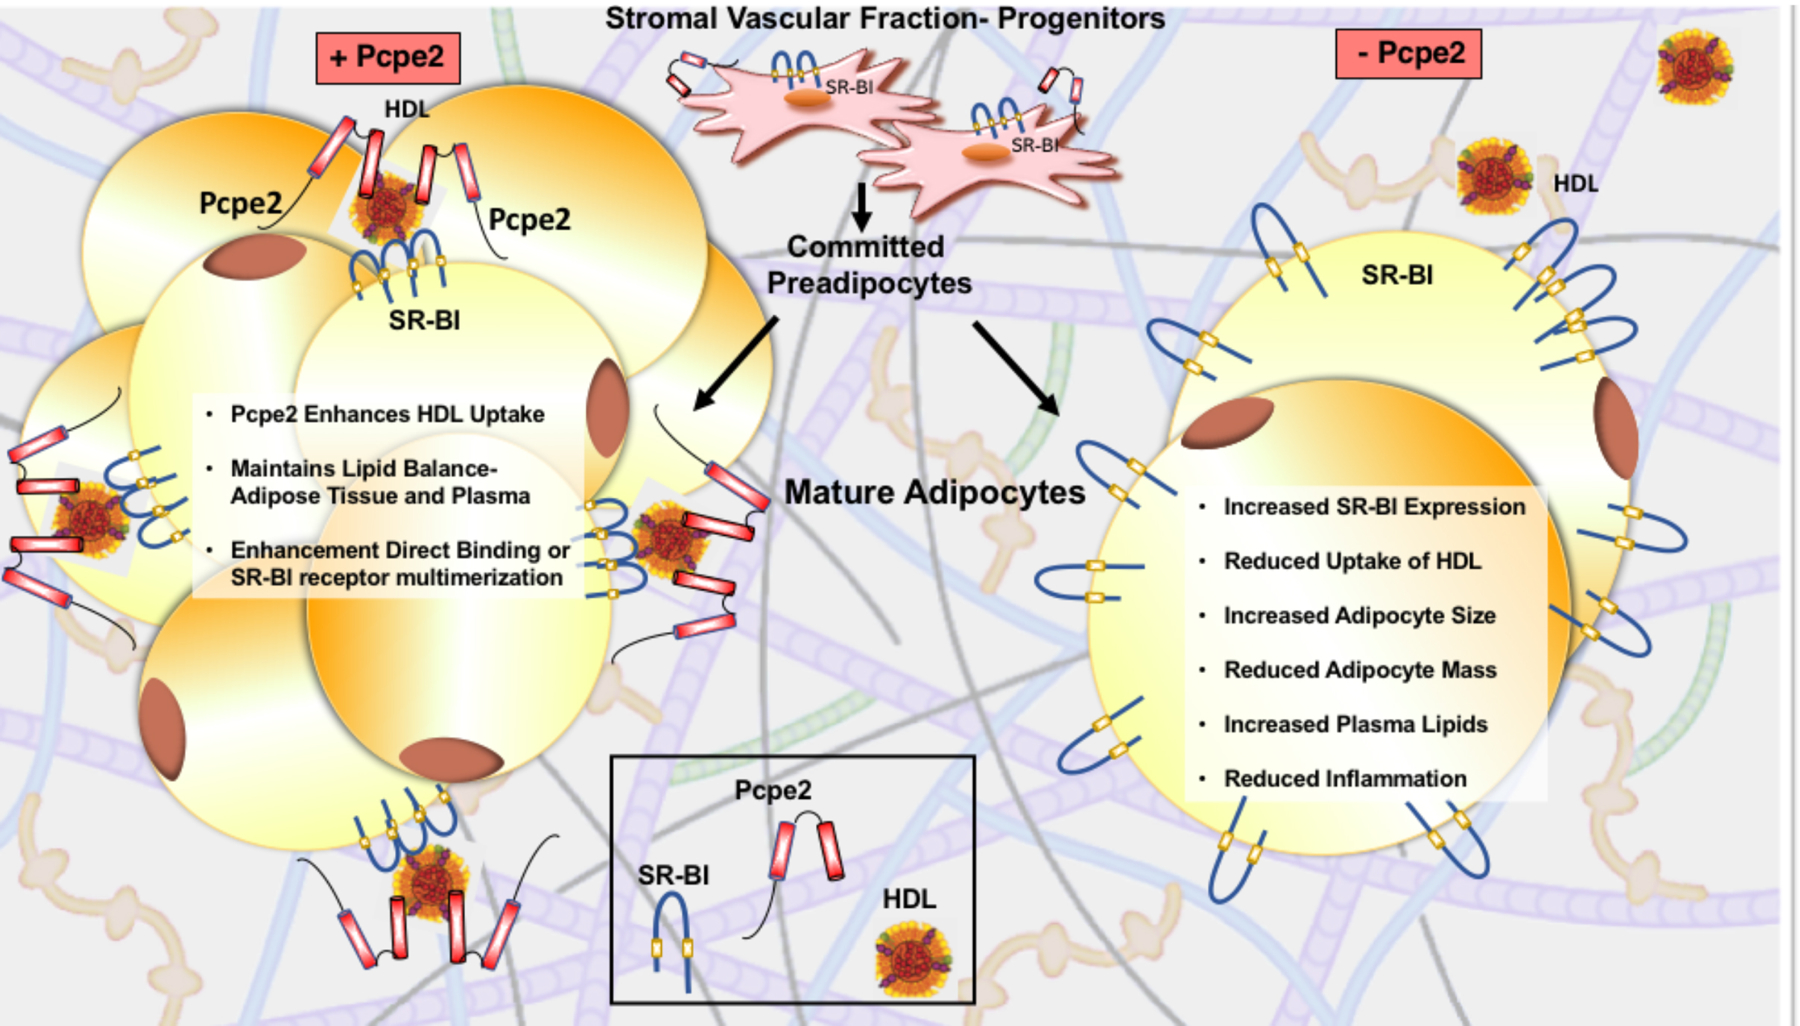
The stromal vascular fraction contains progenitor cells that differentiate into adipocytes. During the fed-state, adipocytes store energy as lipids in two ways: (i) hyperplasic expansion where cells receive signals to differentiate and increase in number or (ii) hypertrophic expansion where existing cells take on more triglycerides. Hypertrophic adipocyte morphology is positively associated with insulin resistance, diabetes and cardiovascular disease. In Pcpe2 null mice, hypertrophic adipocytes were associated with decreased adipose mass, independent of body weight, and a reciprocal elevation in plasma lipoprotein triglyceride and cholesterol concentrations. Paradoxically, in the absence of Pcpe2, these hypertrophic adipocytes were also associated with improved glucose tolerance, less inflammation and increased SR-BI expression. Based on these cumulative observations, we hypothesize that Pcpe2 partners with SR-BI in the extracellular matrix surrounding adipocytes, thereby facilitating the uptake of lipoprotein lipids for storage.
Pcolce2 (Pcpe2) mRNA abundance correlates with adipose mass in mice and humans.
Based on previous studies showing a connection between Pcpe2, HDL metabolism and plasma triglyceride concentrations1, 4, the Hybrid Mouse Diversity Panel was searched for associations between Pcolce2 (Pcpe2) mRNA abundance and a number of phenotypic measures41, 42. Figure 6A–D show statistically significant correlations between percent body fat and relative Pcolce2 mRNA abundance in visceral Panels A and B and subcutaneous Panels C and D adipose tissue from 100 inbred strains of female (Panels A and C) and male (Panels B and D) mice. In each inbred mouse strain, male and female mice were maintained on a standard lab diet until 8 weeks of age then placed on a high-fat/high-sucrose (HF/HS) diet for 8 weeks41, 42. At 16 weeks of age, body composition was measured with MRI and mice were sacrificed after an overnight fast at which time fat pad weights were determined and gene expression was measured. Thus, these data show that Pcolce2 mRNA abundance is positively correlated to mouse adipose tissue weight in both male and female mice after a high fat dietary challenge suggesting a role for Pcpe2 in adipose tissue expansion.
Figure 6. Pcolce2 mRNA abundance correlates with adipose mass in both mice and humans.
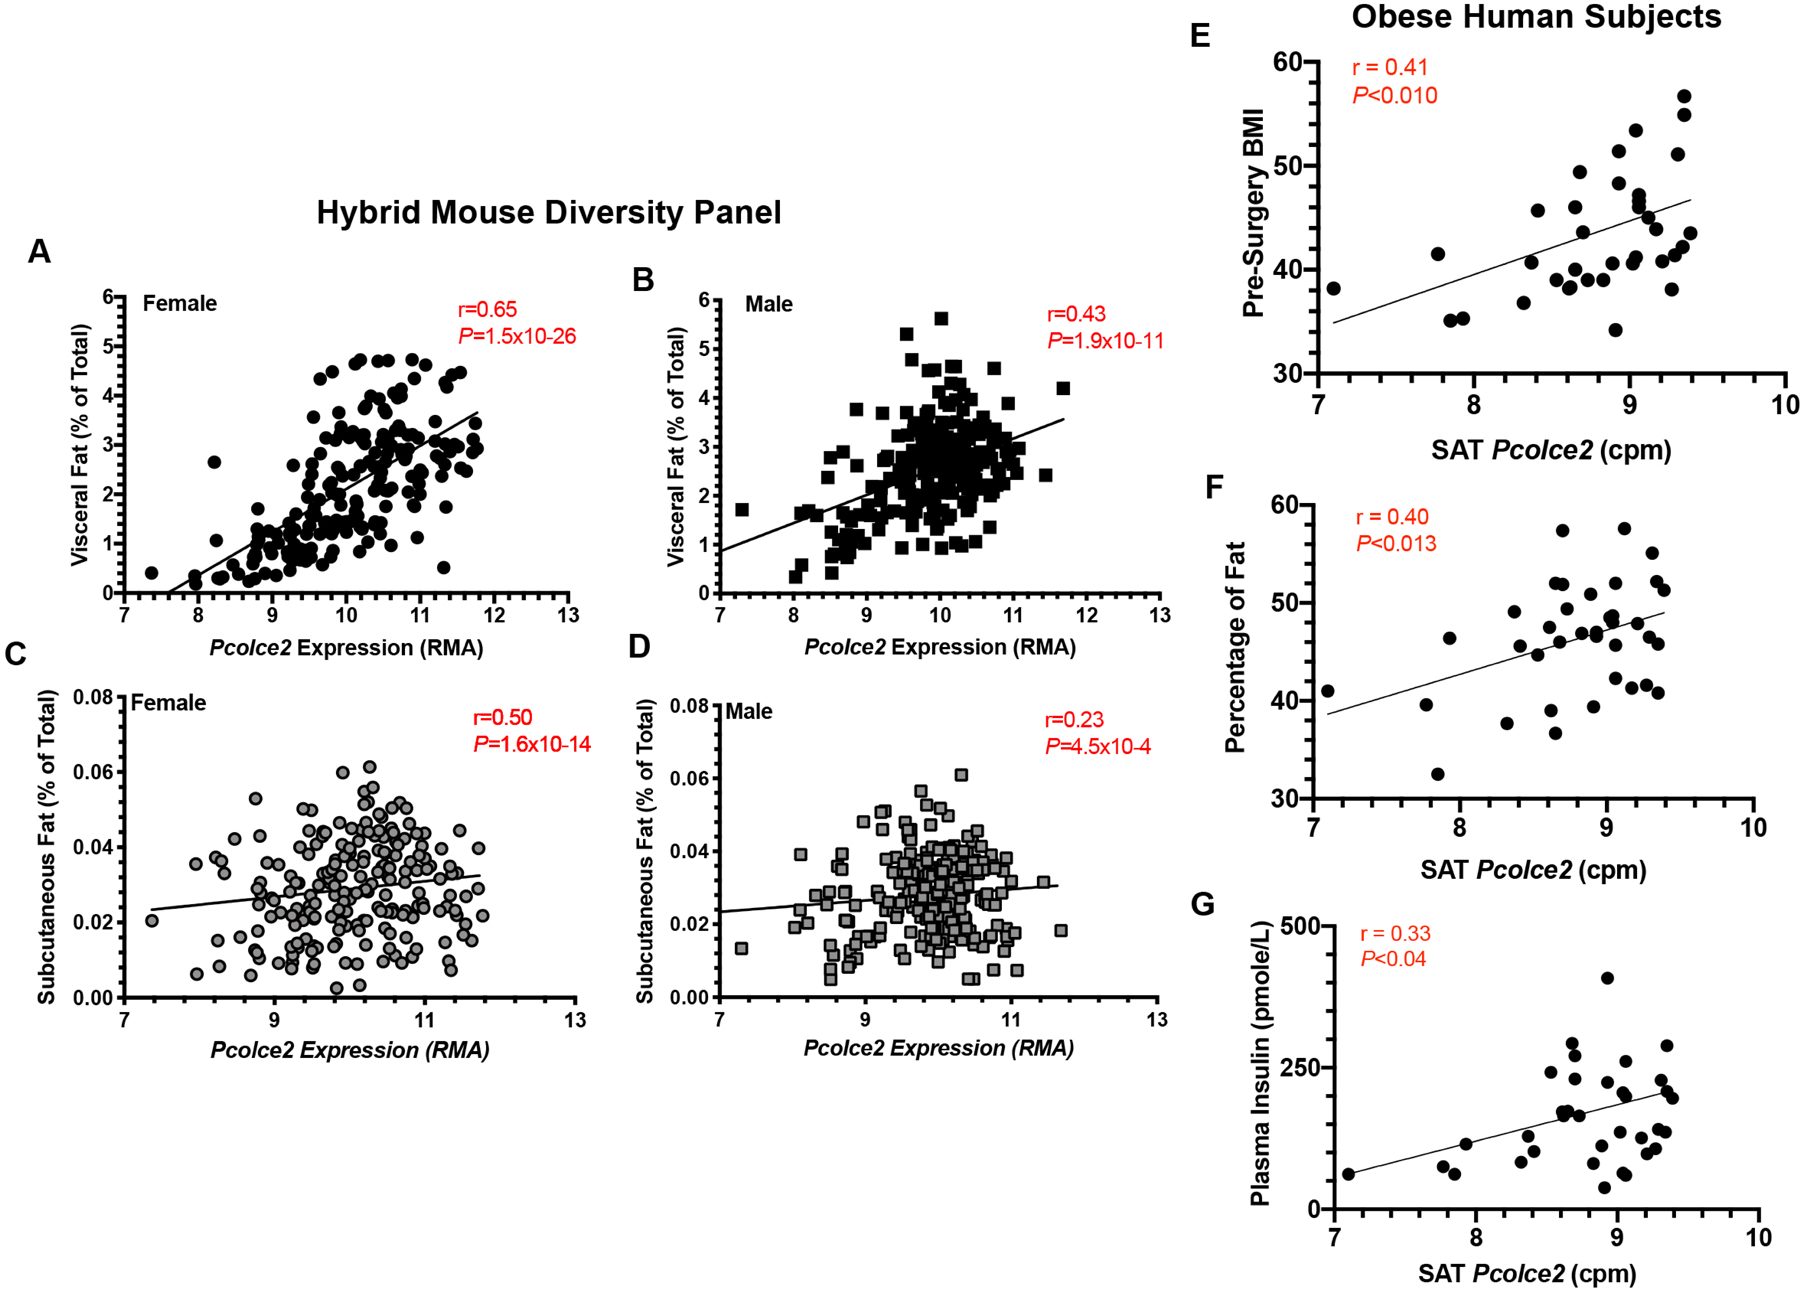
(A-D) Correlations between mouse Pcolce2 mRNA abundance with visceral adipose tissue or subcutaneous adipose tissue. Data were obtained from the study of 100 inbred strains of female or male mice from the Hybrid Mouse Diversity Panel. Experimental details are described in Methods. (E-G) Correlations between human subcutaneous fat Pcolce2 mRNA abundance expressed as counts per million reads (cpm) with (E) body mass index (BMI), (F) percent fat mass and (G) plasma insulin are shown. All samples were obtained from obese patients undergoing bariatric surgery with metabolic information contained in Supplemental Table II and experimental details described in Methods.
To examine if human Pcpe2 mRNA abundance correlated with measures of body fat, we obtained data from obese subjects undergoing bariatric surgery. Clinical characteristics of these patients are shown in Supplemental Table II. Figure 6E–F show positive correlations for pre-surgery subcutaneous adipose tissue Pcolce2 mRNA abundance, vs body BMI Figure 6E and, percent fat mass Figure 6F. Additionally, Pcolce2 mRNA expression positively correlated with plasma insulin shown in Figure 6G. After bariatric surgery-induced weight loss, the correlations between Pcolce2 mRNA expression and measures of body fat persisted, suggesting a role for Pcpe2 in adipose expansion and storage in humans (data not shown). Importantly, these positive correlations in human adipose are consistent with in silico associations derived from the Hybrid Mouse Diversity Panel shown in Figure 6A–D again supporting the idea that Pcpe2 plays a role in adipose tissue expansion.
Discussion
In the current investigations we demonstrate a novel partnership between Pcpe2 and SR-BI in adipose tissue cholesterol maintenance. This partnership contributes to cholesterol balance between adipose tissue and plasma HDL-C by modulating SR-BI- mediated trafficking of HDL-C29, 61. We also show that there is a 2-fold reduction in HDL- C uptake by differentiated SVF, with near complete restoration of HDL-C uptake by Ldlr−/−/Pcpe2−/− adipocytes after cells were pre-incubated with exogenous Pcpe2. Overall, these data demonstrate that HDL-C uptake in adipocytes requires extracellular Pcpe2. A previous study reported that Pcpe2 binds HDL apoA-I, the principal protein component of HDL, suggesting that Pcpe2 interacts with HDL particles coordinating their access to SR- BI3. However, an alternative explanation is that Pcpe2 enables or enhances multimerization of SR-BI monomers on the plasma membrane, which has been shown to be a key step for SR-BI mediated HDL-C uptake62, 63.
Prominent observations in our study was the reduced adipose tissue mass, improved glucose clearance and inflammatory profile in the absence of Pcpe2, in addition to hypertrophic adipocytes and elevated plasma lipids. Since changes to the extracellular matrix occur during adipose tissue expansion and lipid storage, it is possible that the absence of Pcpe2 alters the collagen landscape56 , allowing expansion of existing adipocytes without the restrictions associated with excessive fibrosis, thus reducing inflammation and favoring unhindered lipid storage. Several reports highlighting the contribution of adipose tissue cholesterol to HDL-C come from studies of adipose tissue- specific ABCA1-knockout mice30–32, 64 which show ~15% decrease in plasma HDL-C compared to controls with a 3-fold increase in both white and brown adipose tissue cholesterol content, showing that the ABCA1/apoA-I system is a major pathway for the export of cholesterol from adipocytes30. Furthermore, SR-BI is also reported to have a significant impact on the efflux of free cholesterol from adipose tissue29 in addition to its role in transporting cholesterol esters into adipocytes. SR-BI is expressed in mouse adipose tissue and in differentiated 3T3 mouse fibroblasts65. In 2010, a comprehensive study of cholesterol efflux showed that SR-BI and ABCA1, but not ABCG1, were essential for adipocyte cholesterol efflux29. To study efflux, various differentiated, knockout mouse embryonic fibroblasts were loaded with radiolabeled cholesterol after which, efflux of labeled cholesterol to HDL was measured. In adipocytes lacking SR-BI, there was a significant 3-fold reduction in efflux to HDL. When Abca1−/− or ScarbI−/− mouse embryonic fibroblast-adipocytes were injected into C57BL/6J WT mice there was about a 20 to 30% reduction in cholesterol release into feces compared to controls. These and other studies66–69 support the idea that adipose tissue SR-BI contributes to HDL lipidation and thereby contributes to plasma HDL-cholesterol levels.
Compared to SR-BI, even less is known about Pcpe2 and its role in adipose tissue expansion and lipid storage. Pcpe2 was first described as an enhancer protein based on its homology with Pcpe18, a well-studied collagen binding protein, and enhancer for the procollagen C-proteinase, or bone morphogenic protein-1 (BMP-I)70, 71. A comprehensive study published in 200219 highlighted the differences between Pcpe1 and Pcpe2 and demonstrated significant tissue-specific differences in expression and glycosylation pattern. These studies indicated that Pcolce2 (Pcpe2) was most highly expressed in adipose and heart tissue. An indication of the physiologic importance of this expression was confirmed by studies of chronic pressure overload in Pcpe2-null mice, which led to less collagen accumulation after aortic constriction72.
A connection to HDL-C regulation was established in both 2009 and then in 2011, in which each study showed that Pcpe2 was directly involved in HDL metabolism3, 4 via a high affinity interaction with apoA-I, the main protein constituent of HDL, the main particles. As demonstrated in studies on adipose-specific knockout of ABCA1, cholesterol regulation in adipose tissue does depend on HDL-C and is impacted by dietary lipids, the subject of a recent review28. About 25% of whole body free cholesterol pool is stored in adipose tissue depots and increases to ~50% in obese states27. Thus, the regulation of whole body cholesterol is dependent on the uptake and efflux of plasma lipoproteins, more than on its synthesis73. One example of this is the observation that thermogenic stimulation promotes HDL-C clearance and remodeling as well as increases macrophage to fecal reverse cholesterol transport in mice74–77. In humans, chronic treatment with mirabegron, a beta 3-adrenergic receptor agonist, increases brown adipose tissue activity and elevates plasma HDL-C78. Increased cholesterol, a common finding during weight loss due to anorexia nervosa is thought to represent increased cholesterol release from adipose coupled to a defect in liver LDL uptake. HDL-C levels are also increased in these patients79, 80. Taken together these data strongly support the concept that adipose tissue lipids and plasma HDL are closely linked81.
Major findings from our studies fill a gap in our understanding of Pcpe2, its partnership with SR-BI and contribution to maintaining cholesterol balance between adipose tissue and plasma HDL-C. A summary of our findings is illustrated in Figure 7. In mice lacking Pcpe2 adipose tissue mass was significantly reduced independent of changes in body weight, but with a significant elevation in plasma lipoprotein triglyceride and cholesterol concentrations. Paradoxically, without Pcpe2 adipocytes were associated with improved glucose tolerance and less inflammation. A key feature of Pcpe2 deficiency was an increase in adipocyte SR-BI expression yet a significant attenuation in HDL-C uptake, which was restored when exogenous Pcpe2 was added back to the adipocytes. Based on these cumulative observations, we hypothesize that Pcpe2 partners with SR-BI in the extracellular matrix surrounding adipocytes to facilitate uptake of HDL-C and that Pcpe2 is essential for SR-BI-mediated HDL lipid trafficking in adipocytes. In summary, our study highlights the fact that Pcpe2 and SR-BI are important in adipose tissue expansion and modulate adipocyte physiology in both mice and in humans. Pcpe2, a relatively unknown extracellular matrix glycoprotein and the well-known HDL receptor show a novel co- dependence. The involvement of Pcpe2 and SR-BI in obesity expands on the concept that both lipolytic and endocytic processes are responsible for adipocyte metabolic function in mice and humans82, 83. Further studies will be required to explore the precise mechanism of the Pcpe2 and SR-BI inter-dependence and the physiological consequences of this partnership in other tissues.
Supplementary Material
Highlights.
In mice and humans, Pcpe2, is a glycoprotein devoid of intrinsic proteolytic activity participating in extracellular protein-protein and protein-membrane interactions, yet distinct from Pcpe1.
We demonstrate a novel and unexpected function for Pcpe2 in modulating SR-BI expression, localization and function in adipose tissue expansion, and energy utilization.
Differentiated adipocytes from mouse stromal vascular cells showed elevated SR- BI protein levels, yet significantly reduced HDL-C uptake. While SR-BI mediated HDL-C uptake was restored by pre-incubation of the adipocytes with exogenously added Pcpe2 protein.
In diet-fed mice lacking Pcpe2, a significant reduction in visceral, subcutaneous and brown adipose tissue mass was observed, with reciprocal elevations in plasma triglyceride and cholesterol levels.
Statistically significant positive correlations were found between adipose mass, BMI and Pcpe2 mRNA expression in both mice and humans, suggesting an important physical participation for Pcpe2 in adipose tissue expansion.
These data provide solid evidence for Pcpe2’s role in adipocyte lipid storage and validates Pcpe2 as a target for the study of obesity and diabetes.
Acknowledgements
The authors would like to thank Drs. Yu Aaron An and Philipp Scherer for sharing their advice and protocols for SVF isolation and differentiation. We are also grateful for the expert assistance of Dr. Jesse Sundlov, Versiti Blood Research Institute, for his help in the expression and purification of mouse Pcpe2-His protein. We thank the Medical College of Wisconsin Histology Core for assistance in tissue histology analyses.
Sources of Funding
This work was supported by National Institute of Health Grants HL127649 (MST), HL138907 (MST-DS), HL58012 (DS), HL147883 (AJL), HL149161 (DAK), HL134850 and HL084207 (JLG) and American Heart Grant 19TPA34890023 (MJT), FP7-305707 (MJS and MN) and 18EIA33890055 (JLG).
Abbreviations
- BAT
brown adipose tissue
- CUB
Complement C1r/C1s, Uegf, Bmp1
- HDL-C
high density lipoprotein cholesterol
- HFHC
high fat high cholesterol
- LC-MS/MS
liquid chromatography-tandem mass spectrometry
- LDLr
low density lipoprotein receptor
- LPL
lipoprotein lipase
- Pcolce2, Pcpe2
procollagen endopeptidase enhancer 2
- SAT
subcutaneous adipose tissue
- Scarb1, SR-BI
scavenger receptor class BI
- TC
total cholesterol
- TG
triglyceride
- VAT
visceral adipose tissue
- WT
wild-type
Footnotes
Disclosures
None
References
- 1.Pollard RD, Blesso CN, Zabalawi M, Fulp B, Gerelus M, Zhu X, Lyons EW, Nuradin N, Francone OL, Li XA, Sahoo D, Thomas MJ, Sorci-Thomas MG. Procollagen c-endopeptidase enhancer protein 2 (pcpe2) reduces atherosclerosis in mice by enhancing scavenger receptor class b1 (sr-bi)- mediated high-density lipoprotein (hdl)-cholesteryl ester uptake. J Biol Chem 2015;290:15496–15511 [DOI] [PMC free article] [PubMed] [Google Scholar]
- 2.Sorci-Thomas MG, Pollard RD, Thomas MJ. What does procollagen c- endopeptidase enhancer protein 2 have to do with hdl-cholesteryl ester uptake? Or how i learned to stop worrying and love reverse cholesterol transport? Curr Opin Lipidol 2015;26:420–425 [DOI] [PMC free article] [PubMed] [Google Scholar]
- 3.Zhu J, Gardner J, Pullinger CR, Kane JP, Thompson JF, Francone OL. Regulation of apoai processing by procollagen c-proteinase enhancer-2 and bone morphogenetic protein-1. J Lipid Res 2009;50:1330–1339 [DOI] [PMC free article] [PubMed] [Google Scholar]
- 4.Francone OL, Ishida BY, de la Llera-Moya M, Royer L, Happe C, Zhu J, Chalkey RJ, Schaefer P, Cox C, Burlingame A, Kane JP, Rothblat GH. Disruption of the murine procollagen c-proteinase enhancer 2 gene causes accumulation of pro- apoa-i and increased hdl levels. J Lipid Res 2011;52:1974–1983 [DOI] [PMC free article] [PubMed] [Google Scholar]
- 5.Xu H, Acott TS, Wirtz MK. Identification and expression of a novel type i procollagen c-proteinase enhancer protein gene from the glaucoma candidate region on 3q21-q24. Genomics 2000;66:264–273 [DOI] [PubMed] [Google Scholar]
- 6.Adar R, Kessler E, Goldberg B. Evidence for a protein that enhances the activity of type i procollagen c-proteinase. Coll Relat Res 1986;6:267–277 [DOI] [PubMed] [Google Scholar]
- 7.Kessler E, Adar R, Goldberg B, Niece R. Partial purification and characterization of a procollagen c-proteinase from the culture medium of mouse fibroblasts. Coll Relat Res 1986;6:249–266 [DOI] [PubMed] [Google Scholar]
- 8.Kessler E, Adar R. Type i procollagen c-proteinase from mouse fibroblasts. Purification and demonstration of a 55-kda enhancer glycoprotein. Eur J Biochem 1989;186:115–121 [DOI] [PubMed] [Google Scholar]
- 9.Ricard-Blum S, Bernocco S, Font B, Moali C, Eichenberger D, Farjanel J, Burchardt ER, van der Rest M, Kessler E, Hulmes DJ. Interaction properties of the procollagen c-proteinase enhancer protein shed light on the mechanism of stimulation of bmp-1. J Biol Chem 2002;277:33864–33869 [DOI] [PubMed] [Google Scholar]
- 10.Kronenberg D, Vadon-Le Goff S, Bourhis JM, Font B, Eichenberger D, Hulmes DJ, Moali C. Strong cooperativity and loose geometry between cub domains are the basis for procollagen c-proteinase enhancer activity. J Biol Chem 2009;284:33437–33446 [DOI] [PMC free article] [PubMed] [Google Scholar]
- 11.Bourhis JM, Vadon-Le Goff S, Afrache H, Mariano N, Kronenberg D, Thielens N, Moali C, Hulmes DJ. Procollagen c-proteinase enhancer grasps the stalk of the c-propeptide trimer to boost collagen precursor maturation. Proc Natl Acad Sci U S A 2013;110:6394–6399 [DOI] [PMC free article] [PubMed] [Google Scholar]
- 12.Bork P, Beckmann G. The cub domain. A widespread module in developmentally regulated proteins. J Mol Biol 1993;231:539–545 [DOI] [PubMed] [Google Scholar]
- 13.Gaboriaud C, Gregory-Pauron L, Teillet F, Thielens NM, Bally I, Arlaud GJ. Structure and properties of the ca(2+)-binding cub domain, a widespread ligand- recognition unit involved in major biological functions. Biochem J 2011;439:185–193 [DOI] [PubMed] [Google Scholar]
- 14.Moali C, Font B, Ruggiero F, Eichenberger D, Rousselle P, Francois V, Oldberg A, Bruckner-Tuderman L, Hulmes DJ. Substrate-specific modulation of a multisubstrate proteinase. C-terminal processing of fibrillar procollagens is the only bmp-1-dependent activity to be enhanced by pcpe-1. J Biol Chem 2005;280:24188–24194 [DOI] [PubMed] [Google Scholar]
- 15.Pulido D, Sharma U, Vadon-Le Goff S, Hussain SA, Cordes S, Mariano N, Bettler E, Moali C, Aghajari N, Hohenester E, Hulmes DJS. Structural basis for the acceleration of procollagen processing by procollagen c-proteinase enhancer-1. Structure 2018;26:1384–1392 e1383 [DOI] [PMC free article] [PubMed] [Google Scholar]
- 16.Hulmes DJS. Roles of the procollagen c-propeptides in health and disease. Essays Biochem 2019;63:313–323 [DOI] [PubMed] [Google Scholar]
- 17.Potthoff J, Bojarski KK, Kohut G, Lipska AG, Liwo A, Kessler E, Ricard-Blum S, Samsonov SA. Analysis of procollagen c-proteinase enhancer- 1/glycosaminoglycan binding sites and of the potential role of calcium ions in the interaction. Int J Mol Sci 2019;20 [DOI] [PMC free article] [PubMed] [Google Scholar]
- 18.Salza R, Peysselon F, Chautard E, Faye C, Moschcovich L, Weiss T, Perrin-Cocon L, Lotteau V, Kessler E, Ricard-Blum S. Extended interaction network of procollagen c-proteinase enhancer-1 in the extracellular matrix. Biochem J 2014;457:137–149 [DOI] [PubMed] [Google Scholar]
- 19.Steiglitz BM, Keene DR, Greenspan DS. Pcolce2 encodes a functional procollagen c-proteinase enhancer (pcpe2) that is a collagen-binding protein differing in distribution of expression and post-translational modification from the previously described pcpe1. J Biol Chem 2002;277:49820–49830 [DOI] [PubMed] [Google Scholar]
- 20.Trigatti BL, Krieger M, Rigotti A. Influence of the hdl receptor sr-bi on lipoprotein metabolism and atherosclerosis. Arterioscler Thromb Vasc Biol 2003;23:1732–1738 [DOI] [PubMed] [Google Scholar]
- 21.Out R, Kruijt JK, Rensen PC, Hildebrand RB, de Vos P, Van Eck M, Van Berkel TJ. Scavenger receptor bi plays a role in facilitating chylomicron metabolism. J Biol Chem 2004;279:18401–18406 [DOI] [PubMed] [Google Scholar]
- 22.Castelli WP, Doyle JT, Gordon T, Hames CG, Hjortland MC, Hulley SB, Kagan A, Zukel WJ. Hdl cholesterol and other lipids in coronary heart disease. The cooperative lipoprotein phenotyping study. Circulation 1977;55:767–772 [DOI] [PubMed] [Google Scholar]
- 23.Gordon DJ, Rifkind BM. High-density lipoprotein--the clinical implications of recent studies. N Engl J Med 1989;321:1311–1316 [DOI] [PubMed] [Google Scholar]
- 24.Russo GT, De Cosmo S, Viazzi F, Pacilli A, Ceriello A, Genovese S, Guida P, Giorda C, Cucinotta D, Pontremoli R, Fioretto P, Group AM-AS. Plasma triglycerides and hdl-c levels predict the development of diabetic kidney disease in subjects with type 2 diabetes: The amd annals initiative. Diabetes Care 2016;39:2278–2287 [DOI] [PubMed] [Google Scholar]
- 25.Davidson WS, Shah AS. High-density lipoprotein subspecies in health and human disease: Focus on type 2 diabetes. Methodist Debakey Cardiovasc J 2019;15:55–61 [DOI] [PMC free article] [PubMed] [Google Scholar]
- 26.Ghaben AL, Scherer PE. Adipogenesis and metabolic health. Nat Rev Mol Cell Biol 2019;20:242–258 [DOI] [PubMed] [Google Scholar]
- 27.Krause BR, Hartman AD. Adipose tissue and cholesterol metabolism. J Lipid Res 1984;25:97–110 [PubMed] [Google Scholar]
- 28.Chung S, Parks JS. Dietary cholesterol effects on adipose tissue inflammation. Curr Opin Lipidol 2016;27:19–25 [DOI] [PMC free article] [PubMed] [Google Scholar]
- 29.Zhang Y, McGillicuddy FC, Hinkle CC, O’Neill S, Glick JM, Rothblat GH, Reilly MP. Adipocyte modulation of high-density lipoprotein cholesterol. Circulation 2010;121:1347–1355 [DOI] [PMC free article] [PubMed] [Google Scholar]
- 30.Cuffe H, Liu M, Key CC, Boudyguina E, Sawyer JK, Weckerle A, Bashore A, Fried SK, Chung S, Parks JS. Targeted deletion of adipocyte abca1 (atp-binding cassette transporter a1) impairs diet-induced obesity. Arterioscler Thromb Vasc Biol 2018 [DOI] [PMC free article] [PubMed] [Google Scholar]
- 31.de Haan W, Bhattacharjee A, Ruddle P, Kang MH, Hayden MR. Abca1 in adipocytes regulates adipose tissue lipid content, glucose tolerance, and insulin sensitivity. J Lipid Res 2014;55:516–523 [DOI] [PMC free article] [PubMed] [Google Scholar]
- 32.Bi X, Zhu X, Gao C, Shewale S, Cao Q, Liu M, Boudyguina E, Gebre AK, Wilson MD, Brown AL, Parks JS. Myeloid cell-specific atp-binding cassette transporter a1 deletion has minimal impact on atherogenesis in atherogenic diet-fed low- density lipoprotein receptor knockout mice. Arterioscler Thromb Vasc Biol 2014;34:1888–1899 [DOI] [PMC free article] [PubMed] [Google Scholar]
- 33.Andrikopoulos S, Blair AR, Deluca N, Fam BC, Proietto J. Evaluating the glucose tolerance test in mice. Am J Physiol Endocrinol Metab 2008;295:E1323–1332 [DOI] [PubMed] [Google Scholar]
- 34.Kaul S, Xu H, Zabalawi M, Maruko E, Fulp BE, Bluemn T, Brzoza-Lewis KL, Gerelus M, Weerasekera R, Kallinger R, James R, Zhang YS, Thomas MJ, Sorci-Thomas MG. Lipid-free apolipoprotein a-i reduces progression of atherosclerosis by mobilizing microdomain cholesterol and attenuating the number of cd131 expressing cells: Monitoring cholesterol homeostasis using the cellular ester to total cholesterol ratio. J Am Heart Assoc 2016;5 [DOI] [PMC free article] [PubMed] [Google Scholar]
- 35.Kaluzny MA, Duncan LA, Merritt MV, Epps DE. Rapid separation of lipid classes in high yield and purity using bonded phase columns. J Lipid Res 1985;26:135–140 [PubMed] [Google Scholar]
- 36.Wilhelm AJ, Zabalawi M, Owen JS, Shah D, Grayson JM, Major AS, Bhat S, Gibbs DP Jr., Thomas MJ, Sorci-Thomas MG. Apolipoprotein a-i modulates regulatory t cells in autoimmune ldlr−/−, apoa-i−/− mice. J Biol Chem 2010;285:36158–36169 [DOI] [PMC free article] [PubMed] [Google Scholar]
- 37.Garcia-Arcos I, Hiyama Y, Drosatos K, Bharadwaj KG, Hu Y, Son NH, O’Byrne SM, Chang CL, Deckelbaum RJ, Takahashi M, Westerterp M, Obunike JC, Jiang H, Yagyu H, Blaner WS, Goldberg IJ. Adipose-specific lipoprotein lipase deficiency more profoundly affects brown than white fat biology. J Biol Chem 2013;288:14046–14058 [DOI] [PMC free article] [PubMed] [Google Scholar]
- 38.Hocquette JF, Graulet B, Olivecrona T. Lipoprotein lipase activity and mrna levels in bovine tissues. Comp Biochem Physiol B Biochem Mol Biol 1998;121:201–212 [DOI] [PubMed] [Google Scholar]
- 39.Wang QA, Tao C, Jiang L, Shao M, Ye R, Zhu Y, Gordillo R, Ali A, Lian Y, Holland WL, Gupta RK, Scherer PE. Distinct regulatory mechanisms governing embryonic versus adult adipocyte maturation. Nat Cell Biol 2015;17:1099–1111 [DOI] [PMC free article] [PubMed] [Google Scholar]
- 40.Merrick D, Sakers A, Irgebay Z, Okada C, Calvert C, Morley MP, Percec I, Seale P. Identification of a mesenchymal progenitor cell hierarchy in adipose tissue. Science 2019;364 [DOI] [PMC free article] [PubMed] [Google Scholar]
- 41.Lusis AJ, Seldin MM, Allayee H, Bennett BJ, Civelek M, Davis RC, Eskin E, Farber CR, Hui S, Mehrabian M, Norheim F, Pan C, Parks B, Rau CD, Smith DJ, Vallim T, Wang Y, Wang J. The hybrid mouse diversity panel: A resource for systems genetics analyses of metabolic and cardiovascular traits. J Lipid Res 2016;57:925–942 [DOI] [PMC free article] [PubMed] [Google Scholar]
- 42.Parks BW, Nam E, Org E, Kostem E, Norheim F, Hui ST, Pan C, Civelek M, Rau CD, Bennett BJ, Mehrabian M, Ursell LK, He A, Castellani LW, Zinker B, Kirby M, Drake TA, Drevon CA, Knight R, Gargalovic P, Kirchgessner T, Eskin E, Lusis AJ. Genetic control of obesity and gut microbiota composition in response to high-fat, high-sucrose diet in mice. Cell Metab 2013;17:141–152 [DOI] [PMC free article] [PubMed] [Google Scholar]
- 43.Langfelder P, Horvath S. Fast r functions for robust correlations and hierarchical clustering. J Stat Softw 2012;46 [PMC free article] [PubMed] [Google Scholar]
- 44.Grobe JL. Comprehensive assessments of energy balance in mice. Methods Mol Biol 2017;1614:123–146 [DOI] [PMC free article] [PubMed] [Google Scholar]
- 45.Soto JE, Burnett CML, Ten Eyck P, Abel ED, Grobe JL. Comparison of the effects of high-fat diet on energy flux in mice using two multiplexed metabolic phenotyping systems. Obesity (Silver Spring) 2019;27:793–802 [DOI] [PMC free article] [PubMed] [Google Scholar]
- 46.Weir JB. New methods for calculating metabolic rate with special reference to protein metabolism. J Physiol 1949;109:1–9 [DOI] [PMC free article] [PubMed] [Google Scholar]
- 47.Ter Horst KW, Gilijamse PW, Demirkiran A, van Wagensveld BA, Ackermans MT, Verheij J, Romijn JA, Nieuwdorp M, Maratos-Flier E, Herman MA, Serlie MJ. The fgf21 response to fructose predicts metabolic health and persists after bariatric surgery in obese humans. Mol Metab 2017;6:1493–1502 [DOI] [PMC free article] [PubMed] [Google Scholar]
- 48.Matthews DR, Hosker JP, Rudenski AS, Naylor BA, Treacher DF, Turner RC. Homeostasis model assessment: Insulin resistance and beta-cell function from fasting plasma glucose and insulin concentrations in man. Diabetologia 1985;28:412–419 [DOI] [PubMed] [Google Scholar]
- 49.Sayols S, Scherzinger D, Klein H. Dupradar: A bioconductor package for the assessment of pcr artifacts in rna-seq data. BMC Bioinformatics 2016;17:428. [DOI] [PMC free article] [PubMed] [Google Scholar]
- 50.Krieger M, Kozarsky K. Influence of the hdl receptor sr-bi on atherosclerosis. Curr Opin Lipidol 1999;10:491–497 [DOI] [PubMed] [Google Scholar]
- 51.Bolger AM, Lohse M, Usadel B. Trimmomatic: A flexible trimmer for illumina sequence data. Bioinformatics 2014;30:2114–2120 [DOI] [PMC free article] [PubMed] [Google Scholar]
- 52.Kim D, Langmead B, Salzberg SL. Hisat: A fast spliced aligner with low memory requirements. Nat Methods 2015;12:357–360 [DOI] [PMC free article] [PubMed] [Google Scholar]
- 53.Robinson MD, McCarthy DJ, Smyth GK. Edger: A bioconductor package for differential expression analysis of digital gene expression data. Bioinformatics 2010;26:139–140 [DOI] [PMC free article] [PubMed] [Google Scholar]
- 54.Ritchie ME, Phipson B, Wu D, Hu Y, Law CW, Shi W, Smyth GK. Limma powers differential expression analyses for rna-sequencing and microarray studies. Nucleic Acids Res 2015;43:e47. [DOI] [PMC free article] [PubMed] [Google Scholar]
- 55.Law CW, Chen Y, Shi W, Smyth GK. Voom: Precision weights unlock linear model analysis tools for rna-seq read counts. Genome Biol 2014;15:R29. [DOI] [PMC free article] [PubMed] [Google Scholar]
- 56.Khan T, Muise ES, Iyengar P, Wang ZV, Chandalia M, Abate N, Zhang BB, Bonaldo P, Chua S, Scherer PE. Metabolic dysregulation and adipose tissue fibrosis: Role of collagen vi. Mol Cell Biol 2009;29:1575–1591 [DOI] [PMC free article] [PubMed] [Google Scholar]
- 57.Babitt J, Trigatti B, Rigotti A, Smart EJ, Anderson RG, Xu S, Krieger M. Murine sr-bi, a high density lipoprotein receptor that mediates selective lipid uptake, is n-glycosylated and fatty acylated and colocalizes with plasma membrane caveolae. J Biol Chem 1997;272:13242–13249 [DOI] [PubMed] [Google Scholar]
- 58.Ngai YF, Quong WL, Glier MB, Glavas MM, Babich SL, Innis SM, Kieffer TJ, Gibson WT. Ldlr−/− mice display decreased susceptibility to western-type diet- induced obesity due to increased thermogenesis. Endocrinology 2010;151:5226–5236 [DOI] [PubMed] [Google Scholar]
- 59.Karagiannides I, Abdou R, Tzortzopoulou A, Voshol PJ, Kypreos KE. Apolipoprotein e predisposes to obesity and related metabolic dysfunctions in mice. FEBS J 2008;275:4796–4809 [DOI] [PubMed] [Google Scholar]
- 60.Hoekstra M, Ouweneel AB, Price J, van der Geest R, van der Sluis RJ, Geerling JJ, Nahon JE, Van Eck M. Sr-bi deficiency disassociates obesity from hepatic steatosis and glucose intolerance development in high fat diet-fed mice. J Nutr Biochem 2021;89:108564. [DOI] [PubMed] [Google Scholar]
- 61.McGillicuddy FC, Reilly MP, Rader DJ. Adipose modulation of high-density lipoprotein cholesterol: Implications for obesity, high-density lipoprotein metabolism, and cardiovascular disease. Circulation 2011;124:1602–1605 [DOI] [PMC free article] [PubMed] [Google Scholar]
- 62.Marques PE, Nyegaard S, Collins RF, Troise F, Freeman SA, Trimble WS, Grinstein S. Multimerization and retention of the scavenger receptor sr-b1 in the plasma membrane. Dev Cell 2019;50:283–295 e285 [DOI] [PubMed] [Google Scholar]
- 63.Chadwick AC, Jensen DR, Hanson PJ, Lange PT, Proudfoot SC, Peterson FC, Volkman BF, Sahoo D. Nmr structure of the c-terminal transmembrane domain of the hdl receptor, sr-bi, and a functionally relevant leucine zipper motif. Structure 2017;25:446–457 [DOI] [PMC free article] [PubMed] [Google Scholar]
- 64.Chung S, Sawyer JK, Gebre AK, Maeda N, Parks JS. Adipose tissue atp binding cassette transporter a1 contributes to high-density lipoprotein biogenesis in vivo. Circulation 2011;124:1663–1672 [DOI] [PMC free article] [PubMed] [Google Scholar]
- 65.Acton SL, Scherer PE, Lodish HF, Krieger M. Expression cloning of sr-bi, a cd36- related class b scavenger receptor. J Biol Chem 1994;269:21003–21009 [PubMed] [Google Scholar]
- 66.Yvan-Charvet L, Bobard A, Bossard P, Massiera F, Rousset X, Ailhaud G, Teboul M, Ferre P, Dagher G, Quignard-Boulange A. In vivo evidence for a role of adipose tissue sr-bi in the nutritional and hormonal regulation of adiposity and cholesterol homeostasis. Arterioscler Thromb Vasc Biol 2007;27:1340–1345 [DOI] [PubMed] [Google Scholar]
- 67.Zhao SP, Wu ZH, Hong SC, Ye HJ, Wu J. Effect of atorvastatin on sr-bi expression and hdl-induced cholesterol efflux in adipocytes of hypercholesterolemic rabbits. Clin Chim Acta 2006;365:119–124 [DOI] [PubMed] [Google Scholar]
- 68.Le Lay S, Robichon C, Le Liepvre X, Dagher G, Ferre P, Dugail I. Regulation of abca1 expression and cholesterol efflux during adipose differentiation of 3t3-l1 cells. J Lipid Res 2003;44:1499–1507 [DOI] [PubMed] [Google Scholar]
- 69.Umemoto T, Han CY, Mitra P, Averill MM, Tang C, Goodspeed L, Omer M, Subramanian S, Wang S, Den Hartigh LJ, Wei H, Kim EJ, Kim J, O’Brien KD, Chait A. Apolipoprotein ai and high-density lipoprotein have anti-inflammatory effects on adipocytes via cholesterol transporters: Atp-binding cassette a-1, atp- binding cassette g-1, and scavenger receptor b-1. Circ Res 2013;112:1345–1354 [DOI] [PMC free article] [PubMed] [Google Scholar]
- 70.Li SW, Sieron AL, Fertala A, Hojima Y, Arnold WV, Prockop DJ. The c-proteinase that processes procollagens to fibrillar collagens is identical to the protein previously identified as bone morphogenic protein-1. Proc Natl Acad Sci U S A 1996;93:5127–5130 [DOI] [PMC free article] [PubMed] [Google Scholar]
- 71.Kessler E, Takahara K, Biniaminov L, Brusel M, Greenspan DS. Bone morphogenetic protein-1: The type i procollagen c-proteinase. Science 1996;271:360–362 [DOI] [PubMed] [Google Scholar]
- 72.Baicu CF, Zhang Y, Van Laer AO, Renaud L, Zile MR, Bradshaw AD. Effects of the absence of procollagen c-endopeptidase enhancer-2 on myocardial collagen accumulation in chronic pressure overload. Am J Physiol Heart Circ Physiol 2012;303:H234–240 [DOI] [PMC free article] [PubMed] [Google Scholar]
- 73.Angel A, Farkas J. Regulation of cholesterol storage in adipose tissue. J Lipid Res 1974;15:491–499 [PubMed] [Google Scholar]
- 74.Berbee JF, Boon MR, Khedoe PP, Bartelt A, Schlein C, Worthmann A, Kooijman S, Hoeke G, Mol IM, John C, Jung C, Vazirpanah N, Brouwers LP, Gordts PL, Esko JD, Hiemstra PS, Havekes LM, Scheja L, Heeren J, Rensen PC. Brown fat activation reduces hypercholesterolaemia and protects from atherosclerosis development. Nat Commun 2015;6:6356. [DOI] [PMC free article] [PubMed] [Google Scholar]
- 75.Bartelt A, John C, Schaltenberg N, Berbee JFP, Worthmann A, Cherradi ML, Schlein C, Piepenburg J, Boon MR, Rinninger F, Heine M, Toedter K, Niemeier A, Nilsson SK, Fischer M, Wijers SL, van Marken Lichtenbelt W, Scheja L, Rensen PCN, Heeren J. Thermogenic adipocytes promote hdl turnover and reverse cholesterol transport. Nat Commun 2017;8:15010. [DOI] [PMC free article] [PubMed] [Google Scholar]
- 76.Hoeke G, Kooijman S, Boon MR, Rensen PC, Berbee JF. Role of brown fat in lipoprotein metabolism and atherosclerosis. Circ Res 2016;118:173–182 [DOI] [PubMed] [Google Scholar]
- 77.Heeren J, Scheja L. Brown adipose tissue and lipid metabolism. Curr Opin Lipidol 2018;29:180–185 [DOI] [PubMed] [Google Scholar]
- 78.O’Mara AE, Johnson JW, Linderman JD, Brychta RJ, McGehee S, Fletcher LA, Fink YA, Kapuria D, Cassimatis TM, Kelsey N, Cero C, Sater ZA, Piccinini F, Baskin AS, Leitner BP, Cai H, Millo CM, Dieckmann W, Walter M, Javitt NB, Rotman Y, Walter PJ, Ader M, Bergman RN, Herscovitch P, Chen KY, Cypess AM. Chronic mirabegron treatment increases human brown fat, hdl cholesterol, and insulin sensitivity. J Clin Invest 2020;130:2209–2219 [DOI] [PMC free article] [PubMed] [Google Scholar]
- 79.Hussain AA, Hubel C, Hindborg M, Lindkvist E, Kastrup AM, Yilmaz Z, Stoving RK, Bulik CM, Sjogren JM. Increased lipid and lipoprotein concentrations in anorexia nervosa: A systematic review and meta-analysis. Int J Eat Disord 2019;52:611–629 [DOI] [PMC free article] [PubMed] [Google Scholar]
- 80.Mehler PS, Lezotte D, Eckel R. Lipid levels in anorexia nervosa. Int J Eat Disord 1998;24:217–221 [DOI] [PubMed] [Google Scholar]
- 81.Zhang T, Chen J, Tang X, Luo Q, Xu D, Yu B. Interaction between adipocytes and high-density lipoprotein:New insights into the mechanism of obesity-induced dyslipidemia and atherosclerosis. Lipids Health Dis 2019;18:223. [DOI] [PMC free article] [PubMed] [Google Scholar]
- 82.Hofmann SM, Zhou L, Perez-Tilve D, Greer T, Grant E, Wancata L, Thomas A, Pfluger PT, Basford JE, Gilham D, Herz J, Tschop MH, Hui DY. Adipocyte ldl receptor-related protein-1 expression modulates postprandial lipid transport and glucose homeostasis in mice. J Clin Invest 2007;117:3271–3282 [DOI] [PMC free article] [PubMed] [Google Scholar]
- 83.Hofmann SM, Perez-Tilve D, Greer TM, Coburn BA, Grant E, Basford JE, Tschop MH, Hui DY. Defective lipid delivery modulates glucose tolerance and metabolic response to diet in apolipoprotein e-deficient mice. Diabetes 2008;57:5–12 [DOI] [PMC free article] [PubMed] [Google Scholar]
Associated Data
This section collects any data citations, data availability statements, or supplementary materials included in this article.
Supplementary Materials
Data Availability Statement
The authors declare that all data are available within the article upon request.
Animals and Diet.
Male and female Ldlr−/−, Ldlr−/−/Pcpe2−/− and Ldlr−/−/Scarb1−/− (Sr-b1) mice on the C57BL/6J background were generated as described previously1. Numbers of specific genotypes used for each study/assay are indicated. The colony was maintained in microisolator cages in a pathogen-free AAALAC-accredited facility at the Medical College of Wisconsin (MCW) under controlled environment settings. Mice were maintained on a 14-hour light and 10-hour dark cycle with ad libitum access to water and standard lab diet. In experimental studies, mice were placed on a high fat-high cholesterol diet for 20–25 weeks (Bio-Serv#3282) starting at 10 weeks of age. This diet contained 60% of calories as fat and 0.15% cholesterol. Mice were fasted prior to being anesthetized with ketamine/xylazine for glucose and tissue harvest. Euthanasia and blood collection were by cardiac puncture. All experiments followed guidelines of the MCW Animal Care and Use Committee and the approval of the use of rodents was obtained from MCW according to criteria outlined in the Guide for the Care and Use of Laboratory Animals.
Intraperitoneal Glucose and Insulin Tolerance Test.
For the oral glucose tolerance test, mice were fasted 4 hours and prior to administration of a glucose solution (2.5 g/kg of body weight) by ip injection33. Tail venous blood was taken at 0, 15, 30, 60 and 120 minutes and glucose measured using a glucometer. For the insulin tolerance test, male mice were fasted for 4 hours, after measurement of baseline glucose concentration, mice were injected intraperitoneally with recombinant human insulin (Novo Nordisk) at 1.2 mU/g body weight. Blood glucose concentrations were then measured at 15,30,60 and 120 min after insulin administration. Plasma insulin was measured using the Rat/Mouse Insulin ELISA Kit (Millipore).
Tissue Harvest and Histological Staining.
At the time of necropsy, visceral, subcutaneous and brown adipose tissue as well as liver, heart and muscle tissue were removed and weighed. Pieces of selected tissue from diet-fed male and female mice were treated with fixative then embedded into paraffin and stained in the Pathology Histology Core Facility at MCW. Tissues were stained with hematoxylin and eosin stain (H & E), Movat’s pentachrome and monoclonal antibodies to F4/80. Section images were digitized using a Nikon microscope and Image-Pro Plus 6.2 software. Dishes (30 mm) of differentiated SVF adipocytes were fixed using 1 ml of 2% PFA for 30 minutes at RT. Following fixation, adipocytes were washed with water then incubated with isopropanol for 5 minutes. Next, 1.5 ml of Oil Red O working solution (Oil Red O at 2 g/l, 60% isopropanol, 40% water) were added to each well for 5 minutes, then washed with water to remove unbound Oil Red O.
RNA Seq Analysis.
RNA extraction from visceral fat pads from n=4 male Ldlr−/− and n=4 male Ldlr−/−Pcpe2−/− mice was performed using TRIzol following manufactures instructions. Then cDNA libraries were prepared using a TruSeq Stranded mRNA LT Set B Illumina kit. The quality of the cDNA libraries was assessed using an Agilent 2100 Bioanalyzer and Agilent DNA 1000 kit. Final quantification of prepared libraries was performed using qRT-PCR and MiSeq 50. RNA sequencing was performed on the HiSeq 2500 using TrusSeq v4 SBS chemistry and 2x125 paired-end reads. Primary RNAseq analysis was performed through an analytical pipeline consisting of Bowtie and Tophat for read mapping and alignment, Cufflinks for transcript assembly, Cuffquant for transcript abundance quantification, Cuffnorm for normalization, and Cuffdiff for differential expression. These analyses yielded a total of 44,560 IDs mapped. Libraries yielded 6–7 Gb of data with approximately 60–76 million reads each. Mean quality score of 35 with an average mapping rate of over 90%. Gene-transcript abundances were quantified as fragments per kilobase per million reads. Ingenuity Pathway Analysis was used to analyze genes exhibiting significant expression alterations, with a false discovery rate (FDR) of p<0.02 compared to control.
Non-Detergent Isolation and Fractionation of Lipid Rafts:
Subcellular fractions were prepared as previously described34. Briefly, approximately 200 mg of freshly isolated mouse subcutaneous adipose was homogenized on ice in 10 mM Tris pH 8.0 buffer containing protease inhibitors and 1 mM MgCl2, 1 mM PMSF, 1 mM Na3VO4, 5 mM NaF, using a polytron probe. The cell lysate was centrifuged and the supernatant was adjusted to 45% sucrose. This was overlayed sequentially with a 35% sucrose solution and then a 5% sucrose solution. The tubes were spun in an SW41 rotor overnight at 15oC. Following the spin, the tubes were fractionated and then stored at −80oC till needed for Western blot analysis using antibodies to caveolin-1, a marker of lipid-raft fractions, and c-crk a marker for non-raft regions of the plasma membrane.
Western Blotting.
Protein extracts were prepared using 1X RIPA buffer (Cell Signaling Technologies) and a final concentration of 0.5 mM PMSF and 1X protein inhibitor cocktail (Sigma). Protein concentration was determined by BCA assay (Pierce). Protein extracts were diluted in 4X LDS sample buffer (Life Technologies) to which DTT had been added to achieve a 50 mM final concentration. Samples were heated to 70 °C for 10 minutes, run on 10% polyacrylamide gels then transferred to PVDF membrane (PerkinElmer) using a semi-dry blot apparatus (Bio-Rad). Membranes were blocked with a 5% blocking buffer (Bio-Rad), incubated in primary antibodies; Pcpe2 (Abcam, Ab23272), CD36 (R&D AF2519), beta-actin (Sigma A2228) SR-BI (Novus, NB400–101) at 4 °C overnight. The next day the blot was washed and treated with a horseradish peroxidase-conjugated secondary antibody for 30 minutes at room temperature. Finally, blots were washed and incubated with Clarity (Bio-Rad, 170–5060) and visualized with X-ray film. Band intensities were compared using ImageJ software (NIH).
Quantitative Real-Time PCR.
Total RNA from undifferentiated and differentiated SVF-derived adipocytes were isolated using RNeasy Lipid Tissue Mini Kit (Qiagen). RNA was quantitated by nanodrop and first-strand synthesis was performed using ThermoFisher Scientific RevertAid First Stand cDNA synthesis kit. Real-time PCR was done with SsoAdvanced Universal SYBR Green Supermix (Bio-Rad) using 18S as an internal control for normalization and a Bio-Rad CFX384/C1000 PCR detection system. Relative gene expression levels were calculated by the quantitative threshold (Ct) method (∆∆Ct). All primer sequences will be provided upon request.
Plasma Cholesterol and Triglyceride Measurement.
Fasted mouse plasma was analyzed for total cholesterol (Pointe Scientific) and triglyceride (FUJIFILM Wako Diagnostic) using enzymatic assays.
Lipid Extraction.
Lipids were extracted from weighted tissue by heating in chloroform/methanol (2:1) overnight at 70–80oC. Then 4 µg of [25,26,27-13C3]-cholesterol was added as internal standard for cholesterol analyses. A nonpolar lipid fraction containing cholesterol and cholesteryl esters was separated using the method of Kaluzny et al.35. The eluate was evaporated under a stream of nitrogen, dissolved in 1 ml of 1:1 chloroform-methanol, and stored at −80°C until analyzed.
Tissue Cholesterol Quantification by GC/MS.
For free cholesterol analysis, 100 µl of extract was evaporated under argon, dissolved in hexane, and then analyzed on a ThermoElectron TSQ 8000 tandem quadrupole mass spectrometer equipped with a Trace 1310 gas chromatograph (GC/MS/MS) and Triplus RSH autoinjector. The following parameters were employed: scan time 0.1 s, collision energy 10 V, emission current 25 µA, electron energy 42 eV, source and transfer line temperature 280° C, helium flow rate = 2.5E-8 m3/s, in the positive ion selective reaction monitoring mode: cholesterol, m/z 386.4→301.3; [25,26,27-13C3]-cholesterol, m/z 389.9→304.3. Analysis was carried out using a TG-SQC column (15 m x 0.25 mm I.D.) with a 0.25-µm film thickness. For quantifying TC 100 µl of extract was dried under a stream of nitrogen, dissolved in 1 ml of ethanol, mixed with 100 µl of 50% (w/w) aqueous potassium hydroxide, sparged with nitrogen, and then saponified for 1 hour at 65° C. After hexane extraction total cholesterol was measured by GC/MS/MS and cholesteryl ester calculated as the difference between free cholesterol and total cholesterol as previously reported36.
Lipase Activity Assay.
Measurements of lipoprotein and hepatic lipase were performed using the method described in Garcia-Arcos et al.37. Briefly, to measure hepatic triglyceride production rate, post-heparin plasma was drawn from fasted mice 5 minutes after tail vein injection of 100 units of heparin/kg body weight. Plasma was mixed with 10% Intralipid/[3H]triolene emulsion as substrate with human serum for apolipoprotein CII. Hepatic lipase activity was determined by including 1 mM NaCl in the solution. Lipoprotein lipase activity was determined by subtracting the hepatic lipase numbers from the total lipase activity38.
Tissue Triglyceride Quantification.
Tri-heptadecanoyl-glycerol (Nu-Chek Prep) was added to approximately 250 ul of the lipid extract then dried down and dissolved in 500 µl of hexane using a procedure reported by Kaluzny et al. with minor modifications35 and similar to our previous report1. Cholesteryl esters were removed by washing with 12 ml of 4% methylene chloride in hexane (v/v) then triglyceride was eluted with 24 ml of 15% methylene chloride, 1% tert-butyl methyl ether, in hexane (V/V/V). The eluate was dried with a stream of nitrogen then dissolved in 1 ml hexane. One hundred µl of the triglyceride fraction was dried down, diluted with 1 ml ethanol, mixed with 100 µl of 50% aqueous KOH, and then heated at 65°C for 1 hr. After cooling, 1 ml of water and 3 ml hexane were added then vortexed, and the hexane layer discarded. The aqueous layer was acidified to <pH 3 and extracted with 3 ml of hexane. The hexane layer was removed, then dried down under nitrogen, to which 1 ml 14% BF3 in methanol was added. The tube was flushed with nitrogen, capped then vortexed and heated at 100°C for 5 minutes. After cooling, 2 ml of hexane and 4 ml saturated aqueous NaCl solution were added, vortexed, and then 1 ml of hexane removed. Hexane was removed under nitrogen at 35°C then resuspend in enough hexane to achieve a final concentration for methyl heptadecanote of 0.08 ng/ml. GC/MS FAME analysis was conducted using electron impact ionization in the positive ion mode, scanning from 200 m/z to 400 m/z in 0.2 s: emission current 25 µA, electron energy 42 eV, source and transfer line temperature 280° C, helium flow rate = 2.5E-8 m3/s. Analysis was carried out using a TG-SQC column (15 m x 0.25 mm I.D.) with a 0.25-µm film thickness. Individual FAMEs were identified by retention time and characteristic ion fragments. The integrated FAME results were converted to moles, the mole sum for each tissue divided by three, and then the total mass of the triglyceride calculated.
Isolation, Culture and Differentiation of Subcutaneous SVF into Adipocytes.
Murine SVF from male and female mouse SAT were obtained from 4–6 week--old mice of each genotype as previously described39. Briefly, 300–400 mg of adipose tissue from two mice of each genotype was digested for 2 hours at 37oC in 100 mM HEPES containing 1 mM CaCl2, 120 mM NaCl, 50 mM KCl, 5 mM glucose, 1.5% BSA and 1 mg/ml Collagenase D (Roche). Digested cell/tissue mixture was filtered through a 100 micron strainer to remove undigested tissue. The flow-through cells were centrifuged for 5 minutes at 1,800 rpm at room temperature. The cell pellet was resuspended in SVF growth medium which consisted of DMEM/F12, GlutaMAX, Pen/Strep, and 10%FBS. The cells were filtered through a 40 micron cell strainer to remove debris and large adipocytes. The flow through was centrifuged for 5 minutes at 1,800 rpm at RT and the SVF pellet was then resuspended in SFV maintenance medium and plated on a single 60 mm collagen coated plate. The medium was changed the next day and on day 3–4 when the cells were >85% confluent, the cells were lifted and aliquoted into 96 well plates for uptake assays, 12 well plates for RNA and/or 6 well plates for protein extraction. For adipocyte differentiation, 48 hours after cells had become 100% confluent, adipocyte differentiation medium was added, containing 0.5 mM 3-isobutyl-1-methyl-xanthine, 1 μM dexamethasone, 5 μg/ml insulin, and 1 μM rosiglitazone in SVF growth medium. After 3 days this medium was replaced with a maintenance medium containing 5 μg/ml insulin, and 1 μM rosiglitazone in SVF growth medium.
DiI-HDL Uptake and Localization.
SVF adipocytes derived from control and Pcpe2-deficient mice were isolated as described and differentiated in 96 well black polystyrene plates (Griener Cellstar) for 6 days. On the day of the assay, the wells were washed with 1 X PBS three times and the background fluorescence in each well was measured in PBS using CLARIOstar plate reader with Ex/Em 541/590. The HDL uptake assay was performed by adding a final concentration of 10 µg/ml of DiI-HDL protein in serum-free SVF growth medium which was incubated for 0 to 1.5 hour at 37°C in a tissue culture incubator. After the timed incubation, the medium was removed and the cells were washed 3 times with 1 X DPBS and the cell-associated fluorescence was measured in DPBS using CLARIOstar plate reader with Ex/Em 541/590. The background fluorescence was subtracted for each well from the cell-associated DiI-HDL fluorescence and was then normalized to the adipogenic index for each well. For gain of function assays, SVF adipocytes differentiated for 6 days were incubated with 100 ng/ml of mouse Pcpe2-His in serum-free growth medium for 1.5 hour. Unbound Pcpe2-His was removed by washing with 1X PBS and then the DiI-HDL uptake assay was performed as described. Additional imaging of wells was performed on Lionheart FX epifluorescence microscope (BioTek) using the 10X objective and optical filters for capturing phase contrast, blue (DAPI), green (DiI-HDL) and far red (Nile red).
Adipogenic Index.
The adipogenic index was assessed as previously described40. Following the DiI-HDL uptake assay, the cells were fixed in 2% PFA for 30 minutes at RT. Cellular lipid droplets were stained with 1.25 ug/ well Biodipy 493/503 (Invitrogen) and cell nuclei were stained with 5 ug/well DAPI (Biolegend) for 30 minutes at RT in the dark. After staining, cells were washed 3 times with 1 X PBS and imaged with a CeligoS cytometer (Nexcelom Bioscience) to capture each whole well image. Quantification of the number of nuclei in each well was done in ImageJ by applying Gaussian Blur (3 Sigma), thresholding, performing watershed calculation for segmentation, and counting on DAPI images. Quantification of lipid accumulation, expressed as the Bodipy-stained area, was done in ImageJ by applying Gaussian Blur (2 Sigma), thresholding, and quantifying the total area above the threshold on Bodipy images. The adipogenesis level, expressed as the adipogenic index, was calculated by dividing the area per well stained with lipid by the number of cell nuclei in each well.
Perilipin Immunofluorescence Microscopy.
Culture medium was removed from cells, then washed with DPBS followed by treatment with 2% PFA. After 30 minutes the PFA solution was removed, the cells washed twice with PBS, and then treated with 200 µl of DAKO protein block (Dako). Cells were then treated with 200 µl rabbit anti-perilipin (Cell Signaling) diluted 1:100 with 1 mg/ml saponin in 1:1 Protein Block:PBS. After 1 hour at room temperature the primary antibody was removed, the cells washed three times with PBS, then treated with 200 µl of the secondary antibody anti-rabbit IgG-DyLight549 (Rockland) diluted 1:1000 with PBS. After 1 h in the dark at room temperature the secondary antibody was removed, and the cells washed three times with PBS. Next, 200 µl DAPI mixture, NucBlue® (Life Technologies), diluted 1:2 in PBS was added and allowed to stand for 5 minutes at RT. The DAPI solution was removed and the cells washed three times with PBS. One drop of antifade mounting media (Life Technologies) was added to a cover slip. The cover slip was placed on top of cells and then allowed to dry overnight. Samples were stored at 4°C until examined. A Zeiss LSM 510 confocal microscope and associated software were used to view the results and capture images.
Plasmids.
Mouse Pcpe2 was cloned into a mammalian expression vector under the control of the CMV promoter. The Gaussia luciferase secretion signal was used at the N-terminus of the construct and a GGGGS linker was added at the C-terminus immediately followed by an 8xHis tag (TOP Gene Technologies Inc). Expansion of the plasmid was carried out using PureLink ExpiEndotoxin-Free maxi plasmid purification kit (Invitrogen).
Purification of Mouse Pcpe2.
The ExpiCHO system (ThermoFisher Sci) was used to express full-length glycosylated Pcpe2 following manufacturer’s instructions. For large-scale production, ExpiCHO cells were amplified in 250 ml sterile plastic Erlenmeyer flasks. Cells were grown to a density of 6 x 10⁶ cells/ml then transfected with mouse Pcpe2-GGGGS-6His containing plasmid using ExpiFectamine CHO reagent. Cell viability and cell density were monitored daily and when cell viability dropped below 80% (3 days), cell culture medium was separated from cells and dialyzed extensively against 10 mM ammonium bicarbonate pH 7.4 at 4oC to remove EDTA. Dialyzed medium was loaded onto Ni Sepharose Excel column (GE Healthcare) then washed with 10 column volumes of 25 mM ammonium bicarbonate pH 7.4, 500 mM NaCl, 20 mM imidazole. His-tagged mouse Pcpe2 was eluted with 3 column volumes of 25 mM ammonium bicarbonate pH7.4, 500 mM NaCl, 500 mM Imidazole and 6 M guanidine hydrochloride. Following elution, the Pcpe2 protein was exhaustively dialyzed against 25 mM ammonium bicarbonate pH7.4 to remove guanidine hydrochloride. Protein concentration was determined using BCA assay and purity assessed by SDS-PAGE followed by QC Colloidal Coomassie staining of the gel (Bio-Rad).
System Genetics Resource-Hybrid Mouse Diversity Panel (HMDP).
One hundred inbred strains of male and female mice were maintained on a standard lab diet (6% kcal from fat) until 8 weeks of age and subsequently placed on a high-fat/high-sucrose (HF/HS) diet (32% kcal from fat and 25% kcal from sucrose) for 8 weeks41, 42. At 16 weeks of age, body composition was measured with MRI and mice were sacrificed after an overnight fast. Subcutaneous, retroperitoneal, gonadal, and mesenteric fat pads were collected and weighed. Visceral fat percentage for each mouse was calculated by summing the weights of retroperitoneal, gonadal, and mesenteric fat pads and dividing the sum with the overall body fat amount obtained from MRI measurements. Gene expression was measured from flash-frozen epididymal adipose tissue samples with Affymetrix HT_MG430A. Gene expression-phenotype correlations (biweight midcorrelation) and their significance were calculated with the bicor function in the WGCNA package in R43.
Metabolic Phenotyping.
Mice underwent metabolic phenotyping as previously described44, 45. Briefly, body composition was analyzed using time domain NMR (Bruker LF110), and ingestive behaviors, physical activity, and respirometric gas exchange were assessed continuously for 96 hours (i.e. Monday to Friday) using a 16-chamber Promethion system (Sable Systems International). Heat production rates were estimated using the modified Weir equation46.
Human Study Design and Methods.
Data were obtained from morbidly obese subjects participating in a study on the determinants of the metabolic syndrome (RESOLVE; http://www.resolve-diabetes.org/). Metabolic assessments were performed before and one year after bariatric surgery. Adipose tissue biopsies were performed during and one year after surgery. Inclusion and exclusion criteria have been described earlier, briefly a total of forty-one individuals eligible for bariatric surgery were included, as described47. This analysis included baseline and one-year follow-up data from morbidly obese patients, respectively, who underwent RYGB surgery and from whom data on SAT tissue transcriptomics were available. Biopsies were collected from abdominal SAT via needle aspiration under local anesthesia during euglycemic-hyperinsulinemic clamp; thus, taken under hyperinsulinemic conditions, before and one year after surgery. To assess whole-body insulin sensitivity, we calculated the homeostatic model assessment of insulin resistance (HOMA-IR) as described48. Gene expression was determined by mRNA sequencing. Library construction and sequencing outsourced to GenomeScan B.V. Paired-end reads were produced by Illumina HiSeq 4000. R statistical package version 3.2.3 (R Foundation for Statistical Computing, Vienna, Austria) was used to analyze the data. The quality of the sequenced reads was assessed by the FastQC version 0.11.5 dupRadar version 1.0.049, and Picard50 tools (https://bioinformaticshome.com/tools/rna-seq/descriptions/Picard.html). The adaptor sequences and low-quality bases were trimmed from the reads using Trimmomatic51. Quality trimmed raw reads were aligned to the latest version of the human genome using HISAT52, and counts were obtained at the gene level using HTSeq version 0.6.152. Statistical analyses were performed using the edgeR53 and limma/voom R packages54. Genes without counts across all the libraries were removed. Genes with more than 1 count-per-million reads in at least 15 of the samples were kept for downstream analysis. Count data were transformed to log2-counts per million, normalized by applying the trimmed mean of M-values method53 and precision weighted using the voom method55. Genes were re-annotated using current Ensembl BioMart databases version 90. Before correlation analyses, Shapiro-Wilk tests were performed to assess the right method of use (i.e., Pearson- or Spearman’s rank correlation coefficient). The phenotypic differences between groups were assessed using one-way ANOVA for continuous variables with Bonferroni post hoc tests and X2 tests for categorical variables. The threshold for statistical significance was set at p<0.05. A related-samples Wilcoxon signed-rank test was performed, and data are presented as mean±SD.
Statistics.
Data are presented as mean ± SD and all statistical analysis was done using GraphPad Prism 8 software. For 2-group comparisons, Student t test was used for data that passed normality test; Mann-Whitney U test was used if data failed normality test. For experiments with more than two groups, p values were calculated using on-way or two-way ANOVA as indicated for normally distributed data and Tukey’s multiple comparison test. Metabolic rate measures were corrected for the covariate of body mass via generalized linear modeling, using SPSS 24.