

Abstract
Although corticothalamic neurons (CThNs) represent the largest source of synaptic input to thalamic neurons, their role in regulating thalamocortical interactions remains incompletely understood. CThNs in sensory cortex have historically been divided into two types, those with cell bodies in layer 6 (L6) that project back to primary sensory thalamic nuclei and those with cell bodies in layer 5 (L5) that project to higher order thalamic nuclei and subcortical structures. Recently, diversity among L6 CThNs has increasingly been appreciated. In the rodent somatosensory cortex, two major classes of L6 CThNs have been identified: one projecting to the ventral posterior medial nucleus (VPM-only L6 CThNs) and one projecting to both VPM and the posterior medial nucleus (VPM/POm L6 CThNs). Using rabies-based tracing methods in mice, we asked whether these L6 CThN populations integrate similar synaptic inputs. We found that both types of L6 CThNs received local input from somatosensory cortex and thalamic input from VPM and POm. However, VPM/POm L6 CThNs received significantly more input from a number of additional cortical areas, higher order thalamic nuclei, and subcortical structures. We also found that the two types of L6 CThNs target different functional regions within the thalamic reticular nucleus (TRN). Together, our results indicate that these two types of L6 CThNs represent distinct information streams in the somatosensory cortex and suggest that VPM-only L6 CThNs regulate, via their more restricted circuits, sensory responses related to a cortical column while VPM/POm L6 CThNs, which are integrated into more widespread POm-related circuits, relay contextual information.
Keywords: corticothalamic neurons, layer 6, somatosensory cortex, thalamic reticular nucleus, rabies virus, trans-synaptic tracing
Graphical Abstract

INTRODUCTION
The majority of synaptic inputs to primary sensory thalamic nuclei originate from corticothalamic neurons (CThNs) with cell bodies located in layer 6 (L6) of sensory cortex (Deschênes, Veinante, & Zhang, 1998; Sherman & Koch, 1986; Usrey & Sherman, 2019). Although these modulatory synapses play an important role in shaping neural responses to sensory stimuli in the thalamus and in the cortex (Sherman & Guillery, 1998, 2002), their receptive field properties and influence on cortical and thalamic sensory responses are heterogeneous (Augustinaite & Kuhn, 2020; Crandall, Cruikshank, & Connors, 2015; Kwegyir-Afful & Simons, 2009; Mease, Krieger, & Groh, 2014; Sillito, Jones, Gerstein, & West, 1994; Spacek et al., 2020; Stoelzel, Bereshpolova, Alonso, & Swadlow, 2017; Wang, Jones, Andolina, Salt, & Sillito, 2006). Increasingly appreciated morphological diversity among L6 CThNs across model organisms suggests that this heterogeneity results from functional differences among different morphological types of L6 CThNs (Ansorge, Humanes-Valera, Pauzin, Schwarz, & Krieger, 2020; Bourassa & Deschênes, 1995; Bourassa, Pinault, & Deschênes, 1995; Briggs, Kiley, Callaway, & Usrey, 2016; Briggs & Usrey, 2009; Chevée, Robertson, Cannon, Brown, & Goff, 2018; Fitzpatrick, Usrey, Schofield, & Einstein, 1994; Frandolig et al., 2019; Hasse, Bragg, Murphy, & Briggs, 2019; Hoerder-Suabedissen et al., 2018; Ichida, Mavity-Hudson, & Casagrande, 2014; Kwegyir-Afful & Simons, 2009; Tsumoto & Suda, 1980; Usrey & Fitzpatrick, 1996; Zhang & Deschênes, 1997). In rodents, two main types of CThNs have been described in layer 6a (L6a) of the primary somatosensory cortex, one type with cell bodies biased to upper L6a that projects to the ventral posterior nucleus of the thalamus (VPM-only L6 CThNs) and one with cell bodies biased to lower L6a that projects to both VPM and the posterior medial nucleus (VPM/POm L6CThNs) (Bourassa, et al., 1995; Chevée, et al., 2018; Killackey & Sherman, 2003). These two types also differ in their local intracortical connectivity with VPM-only L6 CThNs, for example, projecting to layer 4 (L4), the main target of VPM thalamocortical (TC) input, while VPM/POm L6 CThNs project to layer 5a (L5a), a major target of POm TC axons (Frandolig, et al., 2019; Zhang & Deschênes, 1997). Here, by comparing their synaptic inputs and outputs, we further test the hypothesis that VPM-only L6 CThNs interface with VPM circuits to modulate the spatiotemporal responses to sensory input in cortical columns, while VPM/POm L6 CThNs are embedded in POm-related circuits and integrate contextual information from subcortical and cortical brain regions.
The lack of tools to access the two types of L6 CThNs independently represents a major hurdle to systematically comparing the synaptic inputs and outputs of the two cell types. For example, the Neurotensin receptor1-Cre (Ntsr1-Cre) transgenic mouse line, which expresses Cre recombinase selectively in L6 CThNs in primary sensory cortex (Bortone, Olsen, & Scanziani, 2014; Gong et al., 2007; Guo, Clause, Barth-Maron, & Polley, 2017; Kim, Matney, Blankenship, Hestrin, & Brown, 2014), labels both subtypes of L6 CThNs (Chevée, et al., 2018). Retrograde labeling from VPM also labels both subtypes, while retrograde labeling from POm labels POm-projecting layer 5 (L5) CThNs in addition to VPM/POm L6 CThNs. To overcome these obstacles and compare the synaptic inputs to VPM-only and VPM/POm L6 CThNs, we developed a multi-pronged approach to perform rabies-based viral synaptic tracing on starter cell populations enriched for VPM-only or VPM/POm L6 CThNs (Callaway & Luo, 2015; Reardon et al., 2016; Wall, Wickersham, Cetin, De La Parra, & Callaway, 2010; Wickersham et al., 2007), enabling an analysis of synaptic inputs to the two subtypes of L6 CThNs. A modification of this approach also allowed us to identify differences in the two cell types’ axonal projections into the thalamic reticular nucleus (TRN), the major source of inhibitory modulation of thalamic neurons.
We found that VPM/POm L6 CThNs receive significantly more presynaptic inputs originating from distant brain regions than VPM-only L6 CThNs. While both L6 CThN cell types receive local inputs from S1 as well as TC input from VPM and POm, VPM/POm L6 CThNs receive substantially more input from cortical regions involved in sensorimotor integration during whisking, such as secondary somatosensory cortex (S2) and cortical motor areas (M1/M2) (Kwon, Yang, Minamisawa, & O’Connor, 2016; Manita et al., 2015; Minamisawa, Kwon, Chevée, Brown, & O’Connor, 2018; Petersen, 2014; Sreenivasan, Karmakar, Rijli, & Petersen, 2015; Zagha, Casale, Sachdev, McGinley, & McCormick, 2013), as well as contralateral cortical areas. VPM/POm L6 CThNs also receive input from brain regions thought to convey broader contextual information in the mouse such as the retrosplenial cortex (RSP) (Cho & Sharp, 2001; Flossmann & Rochefort, 2020) and subcortical areas such as the basolateral amygdala (BLA) (O’Neill, Gore, & Salzman, 2018) and the parafascicular nucleus (PF) of the thalamus (Mandelbaum et al., 2019). Finally, we found that these two types of L6 CThNs target distinct sectors of the somatosensory TRN associated with VPM and POm circuits respectively. Together, our findings indicate that these two types of L6 CThNs represent different information streams within L6a. Combined with previously published work (Born et al., 2020; Clayton et al., 2020; Guo, et al., 2017; Olsen, Bortone, Adesnik, & Scanziani, 2012; Temereanca & Simons, 2004; Velez-Fort et al., 2018; Velez-Fort et al., 2014; Wang, et al., 2006), our data provide further evidence that L6 CThNs that project only to primary sensory nuclei modulate the spatiotemporal response to sensory input in cortical columns, while L6 CThNs that project to both primary and higher order thalamic nuclei play a role in contextual modulation of sensory processing.
MATERIALS AND METHODS
Animals
Experiments were conducted in accordance with the guidelines set by the Society for Neuroscience and the National Institutes of Health, and protocols were approved by the Johns Hopkins University Animal Care and Use Committee. The following mouse lines were used: Neurotensin receptor-1 Cre recombinase (Ntsr1-Cre, GENSAT 220, Mutant Mouse Regional Resource Center 017266-UCD; (Gong, et al., 2007)), Parvalbumin-Cre recombinase (PV-Cre, Jackson 008069, (Hippenmeyer et al., 2005)) and loxP-STOP-loxP-tdTomato Cre reporters (Ai9 and Ai14, Allen Institute for Brain Science, Jackson 007905 and 007908; (Madisen et al., 2010)). Both males and females were used in this study, ranging in age from postnatal day (P)19 to P210 at the time of the first viral injection and P33 to P233 when analyzed. Eight mice were used in the rabies tracing experiments, aged P106, 53, 47, 53, 45, 48, 45 and 61, as plotted in Figure 1e from lowest to highest mean starter cell location. Six additional mice were used for control experiments, aged P57, P64, P65, P65, P233 and P233. For anterograde tracing to the TRN, some mice were injected in S1 bilaterally. Experiments from a total of eight mice, aged P53 to P60, and 15 hemispheres were analyzed for the overall L6 CThN projection into TRN. Anterograde tracing experiments for populations enriched for VPM-only or VPM/POm L6 CThNs used three and four mice respectively, aged P33 to P75. Animals had unlimited access to food and water and were housed in a 12 h light/dark cycle.
Figure 1.
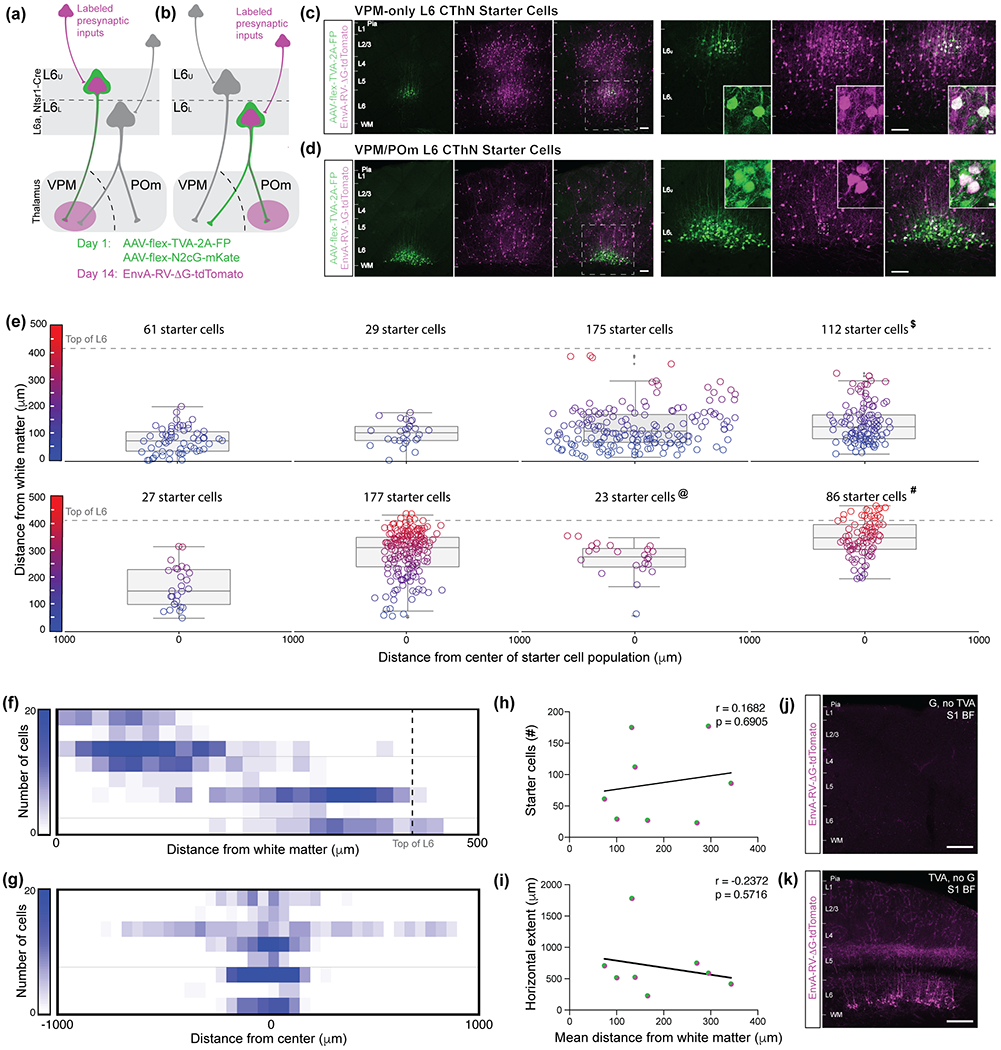
Summary of experimental approach for identifying presynaptic inputs to different classes of layer 6 corticothalamic neurons (L6 CThNs). (a,b) On Day 1, stereotactic injections of two helper AAV viruses encoding rabies G protein and the receptor TVA respectively were biased to upper L6a (a) or lower L6a (b) to enrich transfections for VPM-only (a) or VPM/POm (b) L6 CThNs. Two weeks later, an EnvA-pseudotyped G-deleted rabies virus was injected into VPM (a) or POm (b) to infect VPM-projecting or POm-projecting L6 CThNs. (c,d) Lower (left three panels) and higher (right three panels) magnification images of the starter cell population for an experiment enriched for VPM-only L6 CThNs (c) or VPM/POm L6 CThNs (d). The dashed white boxes indicate the regions shown at higher magnification in the right three panels. Starter cells co-express tdTomato (magenta) due to the rabies virus and either Blue Fluorescent Protein (BFP, green) or enhanced Green Fluorescent Protein (eGFP, green) due to the AAV TVA helper virus as shown in the higher magnification insets. (e) The location of each double-labeled starter cell for the eight experiments is shown. The box plots represent quartiles centered on the median laminar position of each starter cell population. Outliers more than 1.5 time the interquartile range are also shown. Higher magnification images from the experiment marked with (#, 86 starter cells) are shown in Figure 2a and 3c, left; the experiment marked with ($, 112 starter cells) in Figure 2b, 3a, right, 3c, right, 3e, right, 5b; and the experiment marked with (@; 23 starter cells) in Figure 3a, left, 3e, left and 5a. Summary of the vertical (f) and horizontal (g) distribution of the starter cell population for the eight experiments. (h) The total number of starter cells in each experiment did not correlate with the mean laminar position of the starter cell population (r = 0.1682, p = 0.6905, n = 8 mice). (i) The horizontal extent of each starter cell population did not correlate with the mean laminar position of the starter cell population (r = −0.2372, p = 0.5716, n = 8 mice). (j) Example control experiment showing the lack of rabies infection in the absence of TVA expression. (k) Example control experiment showing the lack of trans-synaptic spread of the rabies in the absence of G protein expression. Scale bars: (c,d,j,k) = 200 μm, insets in (c,d) = 10 μm.
Stereotactic injections of viral vectors
To label presynaptic inputs to each subtype of L6 CThN, two surgeries to introduce viral vectors were performed, separated by approximately two weeks. During the first surgery, mice were injected with two helper adenoassociated viral vectors (AAVs) to express the TVA receptor and the rabies G protein in potential starter neurons. Mice were initially anesthetized in an isoflurane chamber with ~3% isoflurane in oxygen (1 L/min), and intraperitoneally injected with ketamine (50 mg/kg) and dexmedetomidine (25 μg/kg). The mice were then placed in a custom stereotactic frame and anesthesia was maintained with 1-2% isoflurane in oxygen (1 L/min). An incision was made to reveal the skull, and a small craniotomy was made above the somatosensory cortex barrel field (S1BF). A 1:1 mixture of two AAVs (rAAV2-flex-N2cG-mKate, Janelia Viral Tools Facility, (Tervo et al., 2016), and either rAAV2-flex-TVA-2A-BFP, Janelia Viral Tools Facility, n = 5 mice, or AAV1-SynP-flex-TVA-2A-EGFP-2A-B19G, titer: 3.9e12 viral genomes/mL, n = 2 mice, UNC Vector Core, Addgene 52473) or AAV1-SynP-flex-TVA-2A-EGFP-2A-B19G alone (titer: 3.9e12 viral genomes/mL, n = 1 mouse, UNC Vector Core, Addgene 52473) was loaded into a glass pipette (inner diameter: 12 μm; outer diameter: 18 μm) which was lowered into the S1BF. To bias transfected cells towards upper L6a (n = 4 mice), ~10 nL of virus cocktail were injected at 1.1 mm posterior to Bregma, 3.1 mm lateral to Bregma, and 0.85 mm from the surface of the brain. To bias transfected cells towards lower L6a (n = 4 mice), ~10 nL of virus cocktail were injected at 1.1 mm posterior to Bregma, 3.1 mm lateral to Bregma, and 1.5 mm from the surface of the brain. The injection coordinates accounted for the spread of the injection volume around the pipette tip when biasing transfections to upper or lower L6a. The pipette was left in place for 5-10 min following the viral injection before it was slowly removed. The incision was sutured, and buprenorphine (0.5 mg/kg) was administered subcutaneously.
Approximately two weeks later, the same animals were injected with ~30 nL of an EnvA-pseudotyped, G-deleted rabies virus encoding a red fluorescent protein (EnvA-RV-ΔG-tdTomato (N2c), titer: 2.4e9, n = 7 mice, Janelia Viral Tools Facility, Addgene 73452 (Reardon, et al., 2016)) or EnvA-RV-ΔG-mCherry (SAD B19), n = 1 mouse, Salk Institute Viral Vector Core (Wickersham, et al., 2007)) into the thalamus, similar to previous studies which used G-deleted rabies virus to transfect CThNs (Briggs, et al., 2016; Hasse, et al., 2019). Animals with injections of the TVA and G-encoding AAVs biased towards upper L6a received the injection of rabies virus into VPM. Animals with injections of the TVA- and G-encoding viruses biased towards lower L6a received the injection of rabies virus into POm, providing additional selectivity for VPM/POm L6 CThNs in lower L6a. The injection coordinates used were: 1.1 mm posterior, 1.7 to 1.8 mm lateral and 3.2 to 3.4 mm ventral to bregma for VPM and 1.35 mm posterior, 1.23 mm lateral and 3.3 mm ventral to bregma for POm.
To identify the innervation patterns of VPM-only and VPM/POm L6 CThNs within the TRN, we performed three sets of experiments. In the first set, stereotactic injections of an AAV encoding for Cre-dependent expression of YFP (AAV-DJ-EF1α-DIO-EYFP, Stanford Medicine Gene Vector and Virus Core) were targeted to the middle of L6a, 1 mm from the surface of the S1BF, of Ntsr1-Cre;tdTomato mice to transfect L6 CThNs through the full thickness of L6a, resulting in the expression of YFP in both VPM-only and VPM/POm L6 CThNs. In addition, we performed two sets of injections to enrich the transfected population for VPM-only or VPM/POm L6 CThNs. Transfections were biased to VPM-only or VPM/POm L6 CThNs by injecting 5 to 10 nL of AAV-DJ-EF1α-DIO-EYFP into the S1BF of Ntsr1-Cre;tdTomato mice at 1.1 mm posterior to Bregma, 3.1 mm lateral to Bregma and 0.85 mm from the surface of the brain or 1.1 mm posterior to Bregma, 3.1 mm lateral to Bregma, and 1.5 mm from the surface of the brain as described above. For five experiments (n = 5 hemispheres from 4 mice), the distribution of the transfected cells and their processes within S1BF was reported in (Frandolig, et al., 2019). Two additional experiments are included here, one enriched for VPM-only and one for VPM/POm L6 CThNs.
Immunohistochemistry
Seven to ten days following the injection of the rabies virus into VPM or POm, mice were sacrificed and transcardially perfused with 10 mL of 0.1 M phosphate buffered saline (PBS) followed by 10 mL of 4% paraformaldehyde (PFA) in 0.1 M PBS. Brains were then removed and fixed in 4% PFA for 3 h at room temperature. The brains were then rinsed three times for 10 min in 0.1 M PBS. Then, 60 μm thick coronal sections were cut on a vibratome (VT-1000S, Leica). Every other section was immunohistochemically processed to enhance the eGFP and tdTomato or mCherry signals, resulting in approximately 40 to 50 immunostained sections per animal. Sections were first placed in 24 well plates, and 300 μL of a blocking solution consisting of 3% normal donkey serum (NDS) and 0.3% TritonX-100 in 0.1 M PBS were added to each well. The plates were then agitated for 2 to 3 h at room temperature. The blocking solution was removed from each well and replaced with 300 μL of primary antibodies diluted in 3% NDS and 0.3% TritonX-100 in 0.1 M PBS (1:2000 rabbit anti-DsRed, Takara Bio Clontech, Cat. No 632496 RRID: AB_10013483 and 1:2000 chicken anti-GFP, Aves, Cat. No GFP-1020 RRID: AB_10000240) to enhance the fluorescent signals. The sections remained in the primary antibody solution for 16 to 20 h at 4 °C. Sections were then rinsed with 0.1 M PBS three times while being agitated at room temperature for 10 min each rinse. The 0.1 M PBS in each well was then replaced with 300 μL of secondary antibodies diluted in 3% NDS and 0.3% TritonX-100 in 0.1 M PBS (1:1000 AlexaFluor 594-conjugated donkey anti-Rabbit IgG, Jackson ImmunoResearch Labs, Cat No. R37119 RRID: AB_141637 and 1:1000 AlexaFluor 488-conjugated donkey anti-Chicken antibody IgG, Jackson ImmunoResearch Labs, Cat No. 703-545-155 RRID: AB_2340375), and the sections were agitated for 2 h at room temperature. Sections were counterstained with DAPI (ThermoFisher , Cat. No.: D1306) unless they contained BFP-expressing neurons, rinsed three times with 0.1 M PBS, and mounted on glass slides in Aqua-Poly/Mount mounting medium (Cat. No 18606-20, Polysciences).
To visualize the axonal projections of L6 CThNs in the TRN, mice were sacrificed 10 to 14 days following the viral injections into S1BF. Mice were transcardially perfused first with PBS followed by 4% PFA, as described above. The brains were removed, fixed in 4% PFA for 3 h at room temperature and rinsed three times in PBS. Coronal sections, 60-80 μm thick, were cut (VT-1000S, Leica) as described above. Sections were processed as described above with primary (1:2000 chicken anti-GFP; Aves, Cat. No GFP-1020 RRID: AB_10000240) and secondary (1:1000 AlexaFluor 488-conjugated donkey anti-Chicken antibody IgG; Jackson ImmunoResearch Labs, Cat No. 703-545-155 RRID: AB_2340375) antibody solutions and were then mounted on glass slides using Aqua-Poly/Mount mounting medium (Cat. No 18606-20, Polysciences).
In a subset of animals (n = 8 mice), sections were stained for inhibitory neuron markers to identify the shell and core regions of the TRN. 80 μm thick sections were processed as described above with primary (1:2000 anti-GFP; Aves, Cat. No GFP-1020 RRID: AB_10000240, 1:1000 anti-PV, Sigma Aldrich, Cat. No P3088 RRID: AB_477329, and 1:1000 rabbit polyclonal anti-Somatostatin 14, Peninsula Laboratories, Cat. No T4103, RRID: AB_518614) and secondary antibodies (1:500 DyLight 405 AffiniPure donkey anti-Mouse IgG; Jackson ImmunoResearch Labs, Cat No. 715-475-140, RRID: AB_2340839, 1:1000 AlexaFluor 488-conjugated donkey anti-Chicken antibody IgG; Jackson ImmunoResearch Labs, Cat No. 703-545-155, RRID: AB_2340375, 1:1000 AlexaFluor 647-conjugated donkey anti-Rabbit antibody IgG; Invitrogen, Cat No. A31573, RRID: AB_2536183). Sections were then mounted on glass slides using Aqua-Poly/Mount mounting medium (Cat. No 18606-20, Polysciences).
Antibody characterization
The rabbit polyclonal anti-DsRed antibody (Takara Bio Clontech, Cat. No 632496, RRID: AB_10013483) was raised against DsRed-Express and, according to the manufacturer’s instructions, recognizes mCherry and tdTomato. When mCherry or tdTomato were not expressed in the tissue, no signal was observed (Figure 1j).
The chicken anti-GFP antibody was raised against GFP (Aves, Cat. No GFP-1020 RRID: AB_10000240) to enhance the visualization of eGFP and YFP. When GFP is not expressed in mouse brain tissue, no signal is observed (Ribeiro et al., 2019).
The antibody used to identify parvalbumin-expressing (PV) neurons is a widely used mouse monoclonal antibody raised against frog muscle PV. According to the manufacturer, this antibody recognizes PV in a calcium-independent manner without cross-reacting to other EF-hand family members such as calmodulin. We found close agreement between the distribution of PV-positive neurons identified with this antibody and tdTomato expression in PV-Cre;tdTomato mice (data not shown). The pattern of immunostaining we observed was similar to the previously published immunostaining of PV neurons in the TRN (Clemente-Perez et al., 2017; Martinez-Garcia et al., 2020).
The antibody used to identify somatostatin-expressing (SOM) neurons was raised against Somatostatin-14 coupled to a carrier protein. According to the manufacturer, this antibody does not cross-react with neuropeptide Y (NPY) or vasoactive intestinal protein (VIP). The pattern of immunostaining we observed was similar to the previously published immunostaining of SOM neurons and Cre expression in the TRN of Sst-Cre mice (Clemente-Perez, et al., 2017; Martinez-Garcia, et al., 2020).
Image acquisition
Images of the barrel cortex and the TRN were acquired with a confocal microscope (LSM 880 or LSM 800, Zeiss) using 10x (0.3 NA) or 20x (0.8 NA) objectives, and tiled images were stitched using ZEN software (Zeiss). Whole sections were imaged on an epifluorescence microscope (Keyence BZ-X 710) using a 10x objective (0.45 NA) and stitched using the Keyence BZX software. For the tiled images of coronal sections in Figure 2, 4a,b, and 5a,b,left, the stitched images extended beyond the sections imaged. However, in the figures, these stitched images were placed on black backgrounds for the purpose of visualizing the images all at the same scale.
Figure 2.
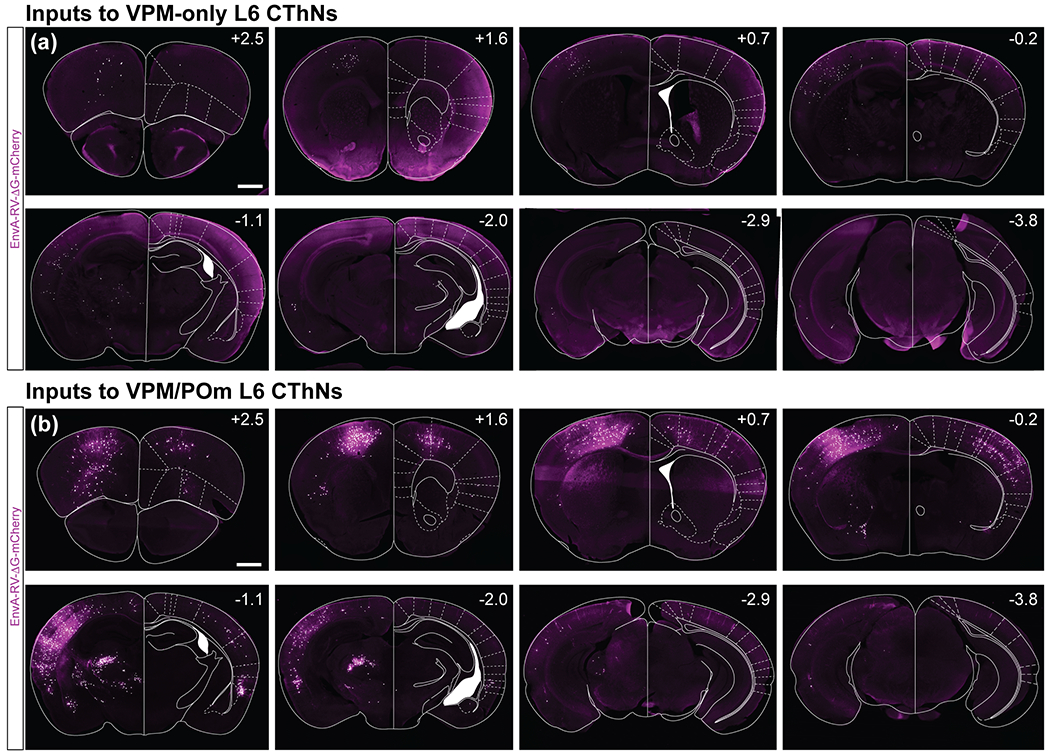
Distribution of tdTomato-expressing neurons in the brains from two example experiments. (a,b) Eight coronal sections spanning the anterior-posterior axis for an experiment with a starter cell population enriched for VPM-only L6 CThNs (a) or VPM/POm L6 CThNs (b). The experiment in (a) corresponds to the experiment marked with a (#) in Figure 1e with 86 starter cells and the experiment in (b) corresponds to the experiment marked with a ($) with 112 starter cells. The starter cells were located in the hemisphere on the left in all images. Schematics of major landmarks were overlaid on the images. Scale bars: (a,b) = 1 mm.
Figure 4.
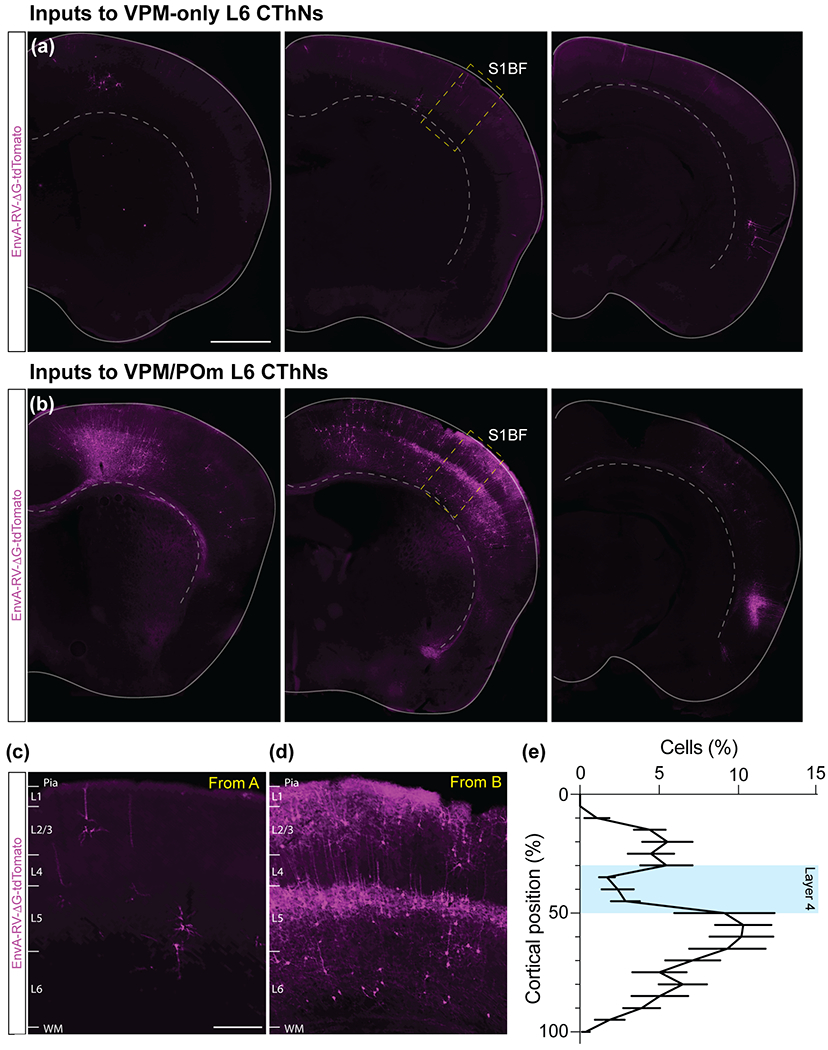
VPM/POm layer 6 corticothalamic neurons (L6 CThNs) receive more input from contralateral cortex than VPM-only L6 CThNs. (a,b) Three example coronal sections of the cortex contralateral to the starter cell population for an experiment with a starter cell population enriched for VPM-only L6 CThNs (a) or VPM/POm L6 CThNs (b). (c,d) Higher magnification images of S1 contralateral to the starter cell population for an experiment with a starter cell population enriched for VPM-only L6 CThNs (c) or VPM/POm L6 CThNs (d). (e) Summary data showing the distribution of tdTomato-positive cells for the four experiments in which the starter cell population was most enriched for VPM/POm L6 CThNs (n = 12 sections from 4 mice). Scale bars: (a,b) = 1 mm, (c,d) = 200 μm.
Figure 5.
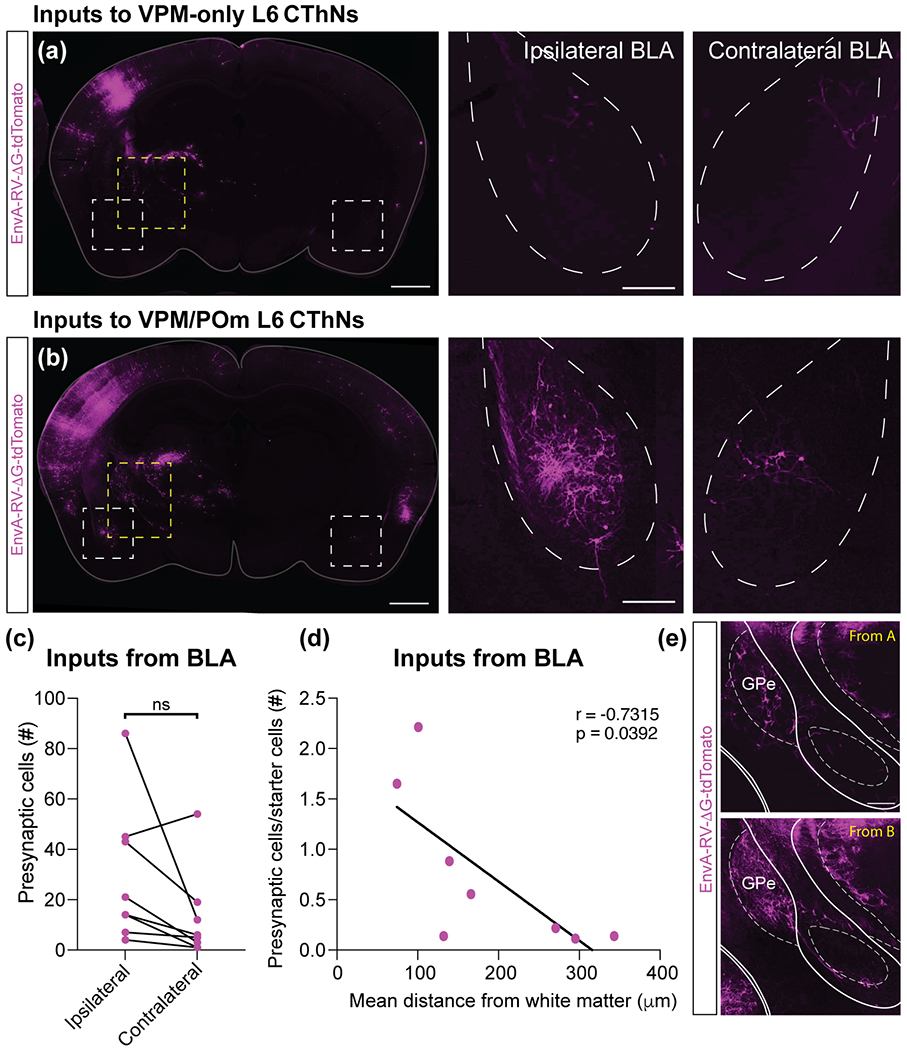
VPM/POm layer 6 corticothalamic neurons (L6 CThNs) receive subcortical input bilaterally from the basolateral amygdala (BLA). (a,b) Images of a coronal section of the brain for example experiments with a starter cell population enriched for VPM-only (a) or VPM/POm L6 CThNs (b). The areas outlined by the white boxes focused on the BLA are shown at higher magnification in the right two panels. The area outlined by the yellow boxes focused on the external globus pallidus and caudal basal forebrain are shown in (e, top, bottom). (c) The total number of tdTomato-positive neurons in the ipsilateral and contralateral BLA for each experiment was not significantly different (Wilcoxon Signed Rank Test, n = 8 mice, p = 0.078). (d) Correlation between the mean laminar position of the starter cell population and the normalized number of tdTomato-positive cells in the BLA (r = −0.7315, p = 0.0392, n = 8 mice). (e) Higher magnification images of a region containing the external globus pallidus (GPe) and caudal basal forebrain (included within GPe borders) for experiments with a starter cell population enriched for VPM-only L6 (top) or VPM/POm L6 CThNs (bottom). Scale bars: (a,b, left panels) = 1 mm; (a,b, right two panels) = 200 μm; (e) = 200 μm.
Image analysis
To identify neurons double-labeled with mCherry or tdTomato and either eGFP or BFP, mCherry/tdTomato-positive cells (subsequently referred to as tdTomato-positive for simplicity) in confocal images of the barrel cortex acquired with a 20x objective were automatically detected using IMARIS (Oxford Instruments, Abingdon, UK) by decreasing the threshold for automatic spot detection until most cells identified visually were marked by Imaris. The cells’ identification was verified manually and corrected as needed to ensure that all tdTomato-positive cells were annotated, and non-tdTomato-expressing cells were excluded. Following this initial identification, tdTomato-positive cells that also expressed eGFP or BFP were identified manually. To determine the distance of each double-labeled starter cell from the white matter border, a surface was drawn along the white matter border directly below the cortex. The distance transformation function was used to determine the distance of each spot to this surface. The location of the top of L6a shown in Figure 1e was estimated using the average most pial extent of BFP or eGFP expression in the three experimental animals with AAV expression most biased towards upper L6a.
The locations of tdTomato-positive neurons presynaptic to the tdTomato/eGFP-positive or tdTomato/BFP-positive starter cell populations were identified and quantified using the QUINT workflow (Yates et al., 2019). FIJI (NIH; (Schneider, Rasband, & Eliceiri, 2012)) was used to downscale stitched images acquired using the Keyence system by 50% to meet the input requirements for the atlas registration and cell detection software. For atlas registration, the image contrast was increased using FIJI to reveal the outlines of anatomical landmarks. Section series from each animal were then registered to the Allen Mouse Brain Atlas (CCF v2; (Oh et al., 2014)) using the Quick NII software (Puchades, Csucs, Ledergerber, Leergaard, & Bjaalie, 2019), generating customized atlas maps for each section. These atlas maps were then used to analyze the distribution of tdTomato-positive cells throughout the brain.
To identify tdTomato-positive neurons in each experiment, the images of the brain sections (41 to 53 sections per animal) acquired using the Keyence system were segmented for tdTomato-labeled cells using the pixel classification and object classification functions of the ilastik software (Berg et al., 2019). First, for pixel classification, ten percent of the images from each series of brain sections (4-5 sections per animal) were used to train the classifier using all available features and feature scales (features: color/intensity, edge, and texture, scales: σ0-σ8, (Yates, et al., 2019)). During the classifier training, the user first manually selected a subset of pixels within tdTomato-positive cells in the first training image. The image was then processed through the classifier and the algorithm’s predictions for high probability pixel locations were visually compared to the tdTomato-positive cells. This process was serially repeated for the 4-5 training images. If tdTomato-positive cells were not detected by the algorithm, pixels within additional tdTomato-positive cells were manually selected in the next round of training. If pixels were incorrectly identified as tdTomato-positive, these pixels were labeled as artifact in the next round of training. Typically, by the fourth or fifth round of training, the algorithm began classifying groups of pixels smaller than a typical neuron’s diameter as high probability tdTomato pixels. At this point, the user reverted to the results from the prior training step, and the classifier was then batch applied to the remainder of the images of the sections from that animal, generating prediction maps of the tdTomato-positive pixel locations for each brain section for that experiment. This process was repeated separately for each animal.
For each animal, the images of each section and their respective pixel prediction maps were then subjected to the ilastik object classifier, using all object features except those related to object location (Yates, et al., 2019). The images of the same 4 to 5 brain sections used to train the pixel classifier were used to train the object classifier. Training consisted of manually labelling objects identified via pixel classification as cells or as artifacts. Typically, by the third training section, there was concordance between the object classifier output and the experimenter’s visual classification. The trained object classifier was then batch applied to the remainder of the brain sections from that animal, and the resulting object segmentations were exported for each section. The custom atlas maps of each brain section and the object segmentations were combined in the Nutil Quantifier application (Groeneboom, Yates, Puchades, & Bjaalie, 2020; Yates, et al., 2019), returning object counts for each atlas brain region. This process was repeated separately for each animal. A custom MATLAB routine was then used to identify brain regions with one or more cells detected by the Nutil Quantifier (Yates, et al., 2019).
To verify that cell counts obtained using these procedures were not biased by the number of labeled cells in a region, tdTomato-positive cells in 6 sections with varying degrees of cell density were manually counted using the FIJI Cell Counter (Kurt De Vos) and assigned to brain regions by referring to the Allen Mouse Brain Atlas. The images selected for manual counting were not the same images that were used to train the ilastik software (Berg, et al., 2019). We then compared the manual counts and the automated counts using the QUINT workflow by first normalizing the number of cells counted in each brain region containing tdTomato-positive cells by the total number of cells counted. For each region analyzed, we then compared the percent of neurons in that region using both workflows. The difference between the normalized counts for each brain region generated manually and by the QUINT workflow averaged 1.0 ± 0.4%, indicating that comparisons among regions with different cell densities generated by the QUINT workflow gave results similar to manual cell counting. We therefore used this automated pipeline to analyze the distribution of putative presynaptic tdTomato-positive cells across sections from all eight experiments.
To determine the laminar distribution of tdTomato-positive cells in S1 contralateral to the starter cell populations, the FIJI Cell Counter was used. Approximately 1 mm wide segments of sections containing S1 from experiments with starter cell populations enriched for VPM/POm L6 CThNs (n = 12 sections from 4 mice) were analyzed. To measure the vertical extent of the cortex, markers were placed at the pia and white matter border and their pixel coordinates recorded. A marker was then placed on every tdTomato-positive cell, and the distance of each from the white matter was recorded in pixels. This distance was then normalized by the vertical extent of the cortex in that section, resulting in a normalized distance from the white matter, with a possible range between 0 and 100%. The normalized values were then binned into 5% increments, and the number of cells per bin for each section was then divided by the total number of cells counted from that section. These normalized counts per bin were then averaged across the 12 sections analyzed and are reported with the standard error of the mean. Three sections were counterstained with DAPI to visualize the barrels and aid in the localization of layer 4.
Statistical analysis
The starter cell populations spanned the vertical depth of L6a (Figure 1f). Therefore, to determine if there was a significant relationship between the laminar position of the starter cell population within L6a and the number of tdTomato-positive cells identified in a brain region, we first normalized the number of cells counted in each region by the number of starter cells in that experimental animal. We then used the fit linear regression model function (fitlm; MATLAB) to perform a linear regression between the mean location of the starter cell populations and the normalized number of presynaptic cells identified across the eight experiments. Plots were generated using GraphPad Prism 9.
RESULTS
Experimental approach for enriching transfected populations for VPM-only or VPM/POm layer 6 corticothalamic neurons
To compare the presynaptic inputs to VPM-only and VPM/POm L6 CThNs in S1BF, we used a rabies-based trans-synaptic viral tracing strategy (Callaway & Luo, 2015; Reardon, et al., 2016; Wall, et al., 2010; Wickersham, et al., 2007) and a multi-pronged approach to enrich starter cell populations for each cell type. First, we used a transgenic mouse line, Neurotensin receptor 1-Cre (Ntsr1-Cre), that selectively expresses Cre recombinase in L6 CThNs in sensory cortical areas (Bortone, et al., 2014; Chevée, et al., 2018; Frandolig, et al., 2019; Gong, et al., 2007; Guo, et al., 2017; Kim, et al., 2014) to restrict expression to L6 CThNs and exclude L5 CThNs. Second, we biased stereotactic injections of two helper viruses to the upper or lower edge of L6a, where VPM-only L6 CThNs and VPM/POm L6 CThNs are respectively located (Figure 1a,b) (Bourassa, et al., 1995; Chevée, et al., 2018; Frandolig, et al., 2019; Killackey & Sherman, 2003). By biasing the location of the injections of these adenoassociated viruses (AAVs), encoding for Cre-dependent expression of TVA, the receptor for the EnvA-pseudotyped rabies vector, and for Cre-dependent expression of G protein to complement the G-deleted rabies virus and allow for trans-synaptic retrograde labeling, we further enriched starter cell populations for L6 CThNs in either upper (Figure 1a) or lower (Figure 1b) L6a. The third component involved targeted thalamic injections of rabies virus into VPM or POm (Figure 1a,b). When the helper AAVs were injected into upper L6a, we injected EnvA-pseudotyped, G-deleted rabies virus into VPM to infect the axonal terminals of L6 CThNs projecting to VPM (Figure 1c). When the injections of the helper AAVs were biased towards lower L6a, we injected rabies virus into medial POm (Figure 1d). This approach generated additional specificity for VPM/POm L6 CThNs in lower L6a.
Starter L6 CThNs were identified as cells expressing both tdTomato from the rabies and eGFP/BFP from a helper AAV. The axonal processes of cells expressing both tdTomato, from the retrograde infection of CThNs by rabies and eGFP or BFP from the transfection of CThNs in the cortex by the TVA helper virus were clearly visible in the thalamus (data not shown). To quantify the mean location of the starter cells in each experiment, we manually identified each double-labeled neuron and measured its distance from the white matter (Figure 1e; n = 8 mice). Mean starter cell laminar position ranged from strongly biased towards lower L6a to strongly biased towards upper L6a, spanning the depth of L6 (Figure 1e,f). The horizontal extent of starter cells within L6a was similar across experiments although one experiment which used a different virus combination generated a broader horizontal spread of starter cells (Figure 1g). There was no significant correlation between mean laminar position of the starter cells and number of infected starter cells (Figure 1h, r = 0.1682; p = 0.6905, n = 8 mice), suggesting that any differences in infection rates between the subtypes of L6 CThNs were minimal and could not account for subsequent differences in the number of putative presynaptic inputs between the two subtypes identified in several brain areas across experiments. There also was no significant relationship between mean laminar position of starter cells and horizontal extent of infected cells in L6a (Figure 1i). These results show that our viral strategy successfully labeled subpopulations of L6 CThNs enriched for VPM-only or VPM/POm L6 CThNs, providing an approach to compare the sources of their presynaptic inputs.
To further verify our approach, we next performed two sets of control experiments. First, we confirmed that the EnvA-pseudotyped rabies virus only infected axons displaying the TVA receptor by injecting the G protein-encoding AAV in L6a of Ntsr1-Cre mice while omitting the AAV encoding the TVA receptor. Approximately two weeks later, we injected EnvA-pseudotyped G-deleted rabies into VPM. Following a similar delay as experiments in which both helper viruses were injected, we observed no visible tdTomato-expressing cells in the brain (Figure 1j, n = 2 mice), confirming that the EnvA-pseudotyped rabies required TVA expression to transfect neurons. Next, we confirmed that G protein co-expression was required for trans-synaptic spread of the G-deleted rabies virus. When we omitted the G-protein encoding AAV from the AAV cocktail, we observed tdTomato-expressing CThNs, but no additional tdTomato-labeled cell types in the cortex or thalamus (Figure 1k, n = 6 hemispheres from 4 mice), confirming that the rabies virus required the G protein to spread trans-synaptically. Finally, we did not observe starter cells located in layer 5 (L5), where L5 CThNs projecting to POm are found, in the four experiments in which the TVA virus was biased to lower L6 (Figure 1e), suggesting that TVA expression was limited to Cre-expressing L6 CThNs.
We imaged 41 to 53 coronal sections for each of the trans-synaptic tracing experiments. Eight coronal sections spanning the anterior-posterior extent of the brain are shown for two example experiments, one with starter cells enriched for VPM-only L6 CThNs (Figure 2a) and the other enriched for VPM/POm L6 CThNs (Figure 2b). These series of sections come from the two experiments marked in Figure 1e (# for Figure 2a, $ for Figure 2b), showing the corresponding distributions of starter cells. To analyze the distribution of tdTomato-positive presynaptic neurons in each experiment, we used publicly available software to automatically count the tdTomato-positive cells in each processed section and to assign each counted neuron to a specific brain region (see Methods).
VPM/POm layer 6 corticothalamic neurons (L6 CThNs) receive significantly more inputs from secondary somatosensory and motor cortex than VPM-only L6 CThNs
In rodents, S1BF receives corticocortical input from other cortical areas including secondary somatosensory cortex (S2) and primary and secondary motor cortex (M1/M2) (Carvell & Simons, 1987; Cauller, Clancy, & Connors, 1998; Mao et al., 2011; Minamisawa, et al., 2018; Petreanu, Mao, Sternson, & Svoboda, 2009; Veinante & Deschênes, 2003), areas thought to act in concert to perceive and interpret whisker-based sensory stimuli (Crochet, Lee, & Petersen, 2019; Staiger & Petersen, 2021). Whether S2 corticocortical input to S1BF preferentially synapses onto VPM-only or VPM/POm L6 CThNs is not clear. We found tdTomato-positive neurons in ipsilateral S2 across the eight experiments, although the number ranged from approximately 100 to over 1000 labeled neurons (Table 1). When the starter cell population was enriched for VPM-only L6 CThNs, few tdTomato-positive cells were observed in S2 (Figure 3a, left). In contrast, we observed numerous tdTomato-positive cells in S2 when the starter population was enriched with VPM/POm L6 CThNs (Figure 3a, right). To compare the S2 inputs to the two subtypes of L6 CThNs, we first calculated the normalized tdTomato-positive cell count, the number of tdTomato-positive cells in a region divided by the number of starter cells in that experiment (Reardon, et al., 2016). We then determined the relationship between the laminar position of the starter cell populations and the normalized tdTomato cell counts in S2 across the eight experiments. We found a significant correlation between the laminar position of starter cells and the normalized cell counts: the more superficial the starter population was in L6a, the fewer tdTomato-positive cells in S2 (Figure 3b; r = −0.8255, p = 0.0116, n = 8 mice). In contrast, there was no significant correlation between the laminar position of the starter cell populations and the normalized tdTomato-positive cell counts for S1 (r = −0.4328, p = 0.2842, n = 8 mice), where a substantial fraction of the total tdTomato-positive cells were located (42 ± 4% of tdTomato neurons, n = 8 mice). These results suggest that while both VPM-only and VPM/POm L6 CThNs receive similar numbers of local inputs from within S1, VPM/POm L6 CThNs receive more inputs from S2 than VPM-only L6 CThNs.
Table 1.
Table related to the tdTomato-positive cells in cortical regions ipsilateral to the starter cell populations. The minimum and maximum number of cells observed in each region across the 8 mice is shown. No cells were observed in cortical regions not included. The r value and p value for the regressions between the mean laminar position of the starter cell populations and the normalized tdTomato-positive cell counts are also shown.
| Ipsilateral Cortical Region | Range (# of tdTomato cells) (n = 8 mice) |
r | p |
|---|---|---|---|
| M1/M2 | 229-2095 | −0.8489 | 0.0077 |
| Retrosplenial | 0-33 | −0.8415 | 0.0088 |
| S2 | 93-1320 | −0.8255 | 0.0116 |
| Visceral | 1-147 | −0.7454 | 0.0338 |
| Cingulate | 1-66 | −0.7278 | 0.0407 |
| Piriform | 1-31 | −0.6967 | 0.0549 |
| Orbitofrontal | 11-187 | −0.6931 | 0.0566 |
| Temporal Association | 8-141 | −0.6785 | 0.0643 |
| Perirhinal | 0-19 | −0.6227 | 0.0991 |
| Insular | 0-120 | −0.6028 | 0.1137 |
| Limbic | 1-68 | −0.5888 | 0.1246 |
| Visual | 4-248 | −0.5725 | 0.1381 |
| Ectorhinal | 0-66 | −0.5693 | 0.1408 |
| Auditory | 19-662 | −0.4946 | 0.2128 |
| S1 | 410-2751 | −0.4328 | 0.2842 |
| Gustatory | 0-5 | −0.0284 | 0.9467 |
Figure 3.
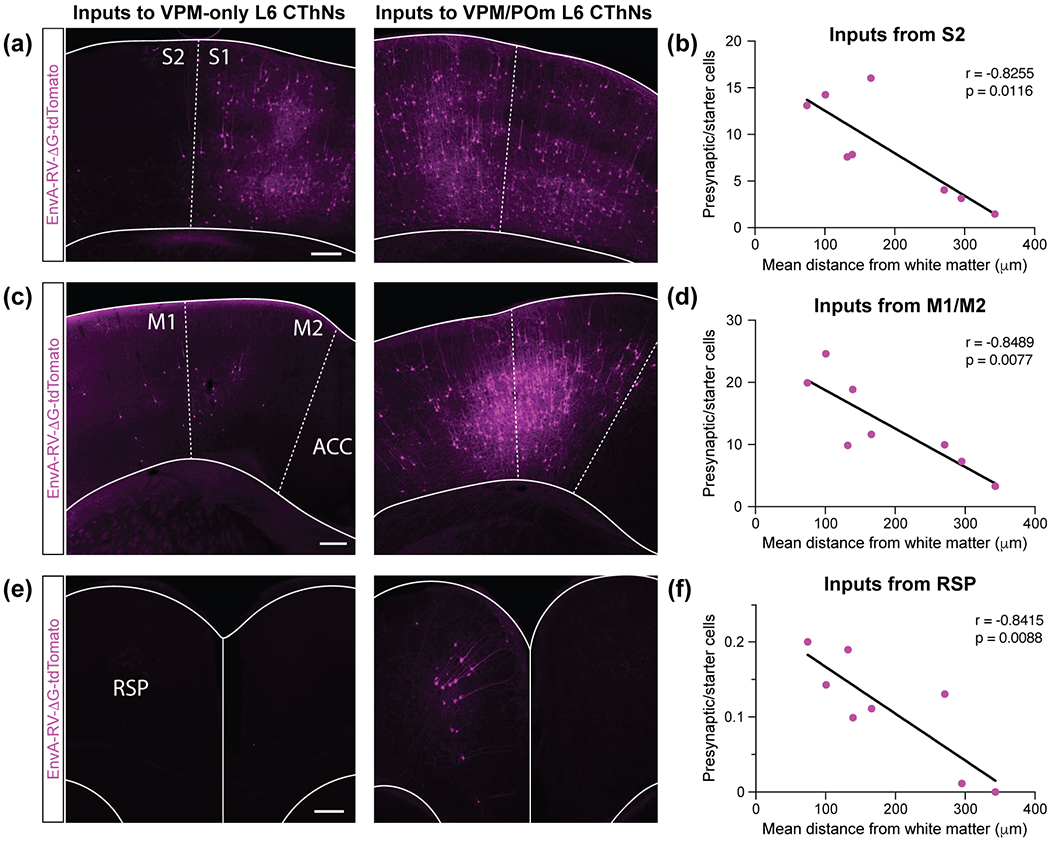
VPM/POm layer 6 corticothalamic neurons (L6 CThNs) receive more input from ipsilateral secondary somatosensory cortex (S2), cortical motor areas and retrosplenial cortex than VPM-only L6 CThNs. (a) Images of coronal sections of primary sensory cortex (S1) and S2 for an example experiment with a starter cell population enriched for VPM-only (left) or VPM/POm L6 CThNs (right). (b) Correlation between the mean laminar position of the starter cell population and the normalized number of tdTomato-positive cells in ipsilateral S2 (r = −0.8255, p = 0.0116, n = 8 mice). (c) Images of coronal sections of primary and secondary motor cortex (M1/M2) for an example experiment with a starter cell population enriched for VPM-only (left) or VPM/POm L6 CThNs (right). (d) Correlation between the mean laminar position of the starter cell population and the normalized number of tdTomato-positive cells in ipsilateral M1/M2 (r = −0.8489, p = 0.0077, n = 8 mice). (e) Images of coronal sections of retrosplenial cortex (RSP) for an example experiment with a starter cell population enriched for VPM-only (left) or VPM/POm L6 CThNs (right). (f) Correlation between the mean laminar position of the starter cell population and the normalized number of tdTomato-positive cells in ipsilateral RSP (r = −0.8415, p = 0.0088, n = 8 mice). Dashed lines indicate areal boundaries. Solid line indicates boundary between the hemispheres. Scale bars: (a,c,e) = 200 μm.
Next, we compared inputs from ipsilateral motor cortical areas (M1/M2). Anatomical studies indicate that axons from neurons in M1 project most densely to L5 and L6 as well as layer 1 (L1) (Cauller, et al., 1998; Kinnischtzke, Simons, & Fanselow, 2014; Mao, et al., 2011; Petreanu, et al., 2009; Veinante & Deschênes, 2003). Although electrophysiological studies suggest that M1 provides relatively weak input to L6 CThNs as compared to L6 corticocortical neurons (CCNs) (Kinnischtzke, Fanselow, & Simons, 2016), whether there are differences in the input from motor cortical areas to VPM-only or VPM/POm L6 CThNs remains unknown. We found a range of tdTomato-positive neurons in M1/M2, spanning approximately 200 to 2000 neurons across the eight experiments (Table 1). When the starter cell population was enriched for VPM-only L6 CThNs, few cells were observed in either M1 or M2 (Figure 3c, left) while numerous tdTomato-positive cells were observed in M1/M2 when the starter population was enriched with VPM/POm L6 CThNs (Figure 3c, right). Across the eight experiments, we found a significant correlation between normalized cell counts in M1/M2 and laminar position of the starter cell population in L6a: experiments with starter populations deeper in L6a exhibited more tdTomato-positive cells in M1/M2 than experiments with starter populations biased to superficial L6a (Figure 3d, r = −0.8489, p = 0.0077, n = 8 mice), indicating that VPM/POm L6 CThNs receive significantly more synaptic input from M1/M2 than VPM-only L6 CThNs.
In addition to finding tdTomato-positive cells in S2 and M1/M2, we observed tdTomato-labeled neurons across a number of additional cortical areas, including up to several hundred tdTomato-positive cells in primary sensory cortical areas like auditory and visual cortex and higher order cortical areas such as retrosplenial cortex (RSP), orbitofrontal cortex (OFC) and cingulate cortex (Table 1). As for S2 and M1/M2, we found more tdTomato-positive cells in RSP when the starter cell population was biased to lower L6a than when the starter cell population was biased towards upper L6a (Figure 3e), resulting in a significant correlation between the laminar position of the starter cell population in L6a and the normalized number of tdTomato-labeled cells across the eight experiments (Figure 3f; r = −0.8415, p = 0.0088, n = 8 mice). Two additional areas, the cingulate cortex and the visceral cortex, also exhibited a similar significant correlation (Table 1) (Cingulate: r = −0.7278, p = 0.0407; Visceral: r = −0.7454, p = 0.0338; n = 8 mice). Among the remaining cortical regions with tdTomato-positive cells in the ipsilateral hemisphere, we did not find any that provided greater synaptic input to VPM-only L6 CThNs (Table 1). Together, these data indicate that although both VPM-only and VPM/POm L6 CThNs receive inputs from a number of additional ipsilateral cortical areas in addition to S1 and M1/M2, VPM/POm L6 CThNs integrate significantly more corticocortical inputs from these cortical regions than VPM-only L6 CThNs.
VPM/POm layer 6 corticothalamic neurons (L6 CThNs) receive significantly more inputs from contralateral cortex than VPM-only L6 CThNs
In addition to receiving input from ipsilateral areas, S1BF receives input from contralateral cortical areas, most prominently from contralateral S1BF (Cauller, et al., 1998; Koralek, Olavarria, & Killackey, 1990; Olavarria, Van Sluyters, & Killackey, 1984; Ramos, Tam, & Brumberg, 2008; Shuler, Krupa, & Nicolelis, 2001; Wall et al., 2016; White & DeAmicis, 1977). While the vast majority of tdTomato-positive cells were found in cortex ipsilateral to the starter cells (71.0 ± 3.4% of tdTomato neurons, n = 8 mice), contralateral cortical regions closely associated with the barrel cortex, including contralateral S1, S2 and M1/M2, contained numerous tdTomato-labeled neurons (Figure 4a,b; Table 2). Furthermore, we found a significant correlation between the mean laminar position of starter neurons and the normalized number of tdTomato-labeled cells in contralateral cortex (r = −0.7226, p = 0.0429, n = 8 mice), with VPM/POm L6 CThNs receiving significantly more input. In addition, experiments in which starter cells were enriched for VPM/POm L6 CThNs display a striking laminar distribution of tdTomato-positive neurons in contralateral S1, with a band of labeled neurons in L5a (Figure 4c–e). Thus, as with ipsilateral cortical areas, VPM/POm L6 CThNs received more long-range synaptic input from contralateral cortex than VPM-only L6 CThNs, and suggest that a wide range of cortical areas influence the activity of VPM/POm L6 CThNs.
Table 2.
Table related to the tdTomato-positive cells in cortical regions contralateral to the starter cell populations. The minimum and maximum number of cells observed in each region across the 8 mice is shown. No cells were observed in cortical regions not included. The r value and p value for the regressions between the mean laminar position of the starter cell populations and the normalized tdTomato-positive cell counts are also shown.
| Contralateral Cortical Region | Range (# of tdTomato cells) (n = 8 mice) |
r | p |
|---|---|---|---|
| S2 | 8-484 | −0.7079 | 0.0495 |
| Ectorhinal | 4-38 | −0.6825 | 0.0622 |
| M1/M2 | 19-905 | −0.6663 | 0.0712 |
| Cingulate | 1-71 | −0.6272 | 0.096 |
| S1 | 20-1099 | −0.6255 | 0.0972 |
| Limbic | 0-72 | −0.589 | 0.1245 |
| Visceral | 0-45 | −0.5843 | 0.1282 |
| Temporal Association | 0-13 | −0.5791 | 0.1325 |
| Retrosplenial | 0-22 | −0.5745 | 0.1364 |
| Perirhinal | 0-8 | −0.5443 | 0.1631 |
| Insular | 1-80 | −0.5223 | 0.1842 |
| Auditory | 0-87 | −0.4572 | 0.2547 |
| Orbitofrontal | 0-110 | −0.4368 | 0.2792 |
| Pirifom | 3-49 | −0.4323 | 0.2848 |
| Visual | 0-12 | −0.2303 | 0.5833 |
| Gustatory | 0-5 | −0.169 | 0.6891 |
The basolateral amygdala provides more input to VPM/POm than to VPM-only layer 6 corticothalamic neurons
In addition to corticocortical input, S1BF receives long-range synaptic input from a number of subcortical nuclei and neuromodulatory systems (Kirifides, Simpson, Lin, & Waterhouse, 2001; Sachdev, Lu, Wiley, & Ebner, 1998; Staiger & Petersen, 2021). Whether these inputs preferentially target one type of L6 CThN remains unknown. While we found that the vast majority of tdTomato-positive neurons were located in cortex (86 ± 1% of tdTomato-positive cells, n = 8 mice), we observed tdTomato-labeled neurons in several subcortical areas in addition to the thalamus (Figure 5). For example, consistent with a previous report on L6 CThNs in auditory cortex (Clayton, et al., 2020), we found tdTomato-positive cells in a region including the external globus pallidus and caudal basal forebrain (Figure 5e; n = 8 mice). However, we found no significant correlation between the normalized number of tdTomato-labeled cells in this region and the mean laminar position of the starter cells (r = −0.4685, p = 0.2416, n = 8 mice), suggesting that similar numbers of neurons in the globus pallidus and basal forebrain are presynaptic to VPM-only and VPM/POm L6 CThNs.
We also found tdTomato-positive neurons in the basolateral amygdala (BLA) bilaterally (Figure 5a,b). Interestingly, we did not find a statistically significant difference between the number of tdTomato-positive cells in the ipsilateral versus contralateral BLA (Figure 5c), indicating that both provide input to L6 CThNs. When we assessed the relationship between mean laminar position of the starter cells and normalized tdTomato-positive cell counts in the BLA, we found that VPM/POm L6 CThNs received significantly more input than VPM-only L6 CThNs (Figure 5d, r = −0.7315, p = 0.0392, n = 8 mice), mirroring results from the cortex indicating that VPM/POm L6 CThNs integrate more inputs than VPM-only L6 CThNs from BLA.
VPM-only and VPM/POm layer 6 corticothalamic neurons receive different sources of thalamic input
Tactile information from the sensory periphery is transmitted to S1BF mainly through two thalamic nuclei: VPM and POm (Sermet et al., 2019; Staiger & Petersen, 2021). VPM thalamocortical (TC) axons primarily target L4 as well as the L5/6 border while POm TC axons ramify in L5a as well as L1 (Jouhanneau et al., 2014; Ohno et al., 2012; Wimmer, Bruno, de Kock, Kuner, & Sakmann, 2010). Functional studies have identified monosynaptic TC inputs onto L6 CThNs (Beierlein & Connors, 2002; Constantinople & Bruno, 2013; Crandall, Patrick, Cruikshank, & Connors, 2017; Frandolig, et al., 2019; Yang et al., 2014). We found a range of tdTomato-positive cells, from 25 to several hundred, in both VPM and POm across the eight experiments (Figure 6a,b; Table 3). However, there was no significant correlation between the location of the starter cells in L6a and the normalized number of tdTomato-labeled cells in either VPM or POm (Figure 6c,d; Table 3). We also found tdTomato-positive cells in additional higher order thalamic nuclei (Table 3), which previous studies showed provide input to S1BF (Theyel, Llano, & Sherman, 2010; Zhang & Deschênes, 1998). The mean laminar position of starter cells and the normalized number of tdTomato-labeled neurons from the parafascicular nucleus (PF, Figure 6e) and the centrolateral nucleus (CL, Table 3) were significantly correlated. Thus, while both cell types receive similar inputs from VPM and POm, these data indicate that VPM/POm L6 CThNs receive significantly more synaptic input from these higher order thalamic nuclei than do VPM-only L6 CThNs.
Figure 6.
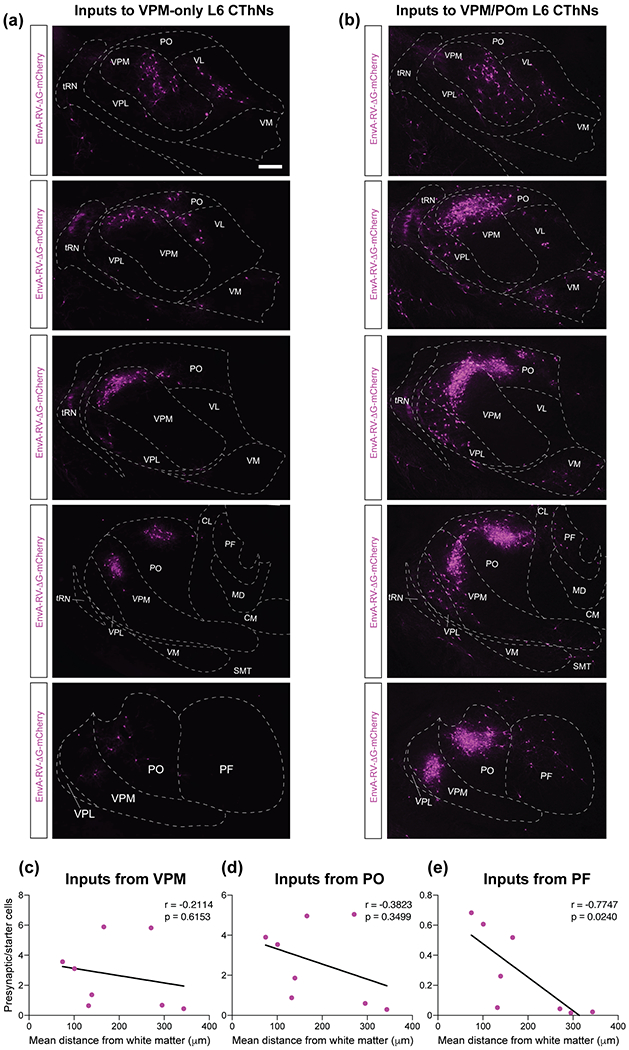
Shared and divergent thalamic input to VPM-only and VPM/POm layer 6 corticothalamic neurons (L6 CThNs). (a,b) Coronal sections through the anterior-posterior axis of the thalamus (top to bottom panels) for example experiments with a starter cell population enriched for VPM-only L6 (a) or VPM/POm L6 CThNs (b). (c) Correlation between the mean laminar position of the starter cell population and the normalized number of tdTomato-positive cells in ipsilateral VPM (r = −0.2114, p = 0.6153, n = 8 mice). (d) Correlation between the mean laminar position of the starter cell population and the normalized number of tdTomato-positive cells in ipsilateral POm (r = −0.3823, p = 0.3499, n = 8 mice). (e) Correlation between the mean laminar position of the starter cell population and the normalized number of tdTomato-positive cells in the ipsilateral parafascicular nucleus (PF; r = −0.7747, p = 0.0240, n = 8 mice). Scale bars: (a,b) = 200 μm.
Table 3.
Table related to the tdTomato-positive cells in thalamic nuclei ipsilateral to the starter cell populations. The minimum and maximum number of cells observed in each region across the 8 mice is shown. No cells were observed in thalamic nuclei not included. The r value and p value for the regressions between the mean laminar position of the starter cell populations and the normalized tdTomato-positive cell counts are also shown.
| Thalamic Nuclei | Range (# of tdTomato cells) (n = 8 mice) |
r | p |
|---|---|---|---|
| Parafascicular nucleus | 1-41 | −0.7747 | 0.0240 |
| Central lateral nucleus | 2-52 | −0.7099 | 0.0485 |
| Geniculate group of dorsal thalamus | 1-27 | −0.6836 | 0.0616 |
| Central medial nucleus | 1-24 | −0.6684 | 0.0700 |
| Mediodorsal nucleus | 0-46 | −0.6255 | 0.0972 |
| Ventral posterolateral nucleus | 5-122 | −0.571 | 0.1393 |
| Submedial nucleus | 0-43 | −0.5698 | 0.1404 |
| Ventral medial nucleus | 2-114 | −0.558 | 0.1507 |
| Ethmoid nucleus | 11-54 | −0.5237 | 0.1828 |
| Rhomboid nucleus | 0-16 | −0.5045 | 0.2023 |
| Posterior limiting nucleus | 0-10 | −0.4745 | 0.2349 |
| Posterior triangular nucleus | 1-16 | −0.456 | 0.2561 |
| Paracentral nucleus | 0-30 | −0.4497 | 0.2636 |
| Lateral dorsal nucleus | 0-20 | −0.447 | 0.2668 |
| Ventral anterior-lateral complex | 0-68 | −0.4191 | 0.3014 |
| Lateral posterior nucleus | 3-37 | −0.4142 | 0.3076 |
| Posterior complex | 25-234 | −0.3823 | 0.3499 |
| Suprageniculate nucleus | 0-16 | −0.306 | 0.461 |
| Ventral posteromedial nucleus | 38-214 | −0.2114 | 0.6153 |
VPM-only and VPM/POm layer 6 corticothalamic neurons (L6 CThNs) exhibit distinct axonal projection patterns to the thalamic reticular nucleus
Together, our results show that VPM-only and VPM/POm L6 CThNs receive different synaptic inputs, with VPM/POm L6 CThNs integrating across a larger number of synaptic inputs across brain regions than VPM-only L6 CThNs. These differences complement previous work showing that the two types of L6 CThNs are also distinguished by their pattern of intracortical axonal arborization (Frandolig, et al., 2019; Zhang & Deschênes, 1997) and thalamic projections to VPM and POm (Bourassa, et al., 1995; Chevée, et al., 2018; Deschênes, et al., 1998; Killackey & Sherman, 2003; Rouiller & Welker, 2000). L6 CThNs across model organisms also send axonal branches to the TRN, a thin nucleus of inhibitory GABAergic neurons representing the major source of feedforward and feedback inhibition to the thalamus (Crabtree, 2018; Pinault, 2004), distinguishing them from L5 CThNs in primary sensory cortices which do not target TRN (Deschênes, Bourassa, & Pinault, 1994; Guillery, 1995; Veinante, Lavallee, & Deschênes, 2000). Not only is the TRN topographically organized, but anatomical, molecular and functional studies indicate that the somatosensory TRN (ssTRN) is further divided into sublaminae, each targeted by distinct sets of TC axons (Clemente-Perez, et al., 2017; Hoseini et al., 2020; Lam & Sherman, 2007; Lee, Patrick, Richardson, & Connors, 2014; Martinez-Garcia, et al., 2020; Pinault, Bourassa, & Deschenes, 1995). Axon collaterals from POm TC neurons target the outer edges of the TRN, the shell, which includes somatostatin-expressing (SOM) TRN neurons (Clemente-Perez, et al., 2017; Martinez-Garcia, et al., 2020). TRN shell neurons project in turn to POm (Pinault, et al., 1995). In contrast, VPM is reciprocally connected with the core of the TRN, which is enriched for neurons expressing parvalbumin (PV) (Clemente-Perez, et al., 2017; Lam & Sherman, 2007; Martinez-Garcia, et al., 2020; Pinault, et al., 1995). How projections from the two L6 CThN subtypes in mice relate to this functional organization remains unclear.
To visualize the innervation of the TRN by the overall population of L6 CThNs, we first injected an AAV encoding a Cre-dependent YFP reporter in the middle of L6a of Ntsr1-Cre mice (Figure 7a). In addition to axonal processes in VPM and POm, we found that these injections generated two regions of dense axonal processes in the TRN (Figure 7b), similar to prior studies of L6 projections to the TRN (Lee, et al., 2014). To determine how these termination zones related to the functional organization of the TRN, we next compared the location of the YFP-labeled L6 CThN axons with the location of TRN neurons expressing PV, enriched in the TRN core, and SOM, enriched in the TRN shell. After immunostaining sections for PV and SOM in which the L6 CThN axons were labeled with YFP (Figure 7b–h), we found one termination zone was located within the PV-enriched core while the other was found at the medial edge of the TRN, in the medial shell.
Figure 7.
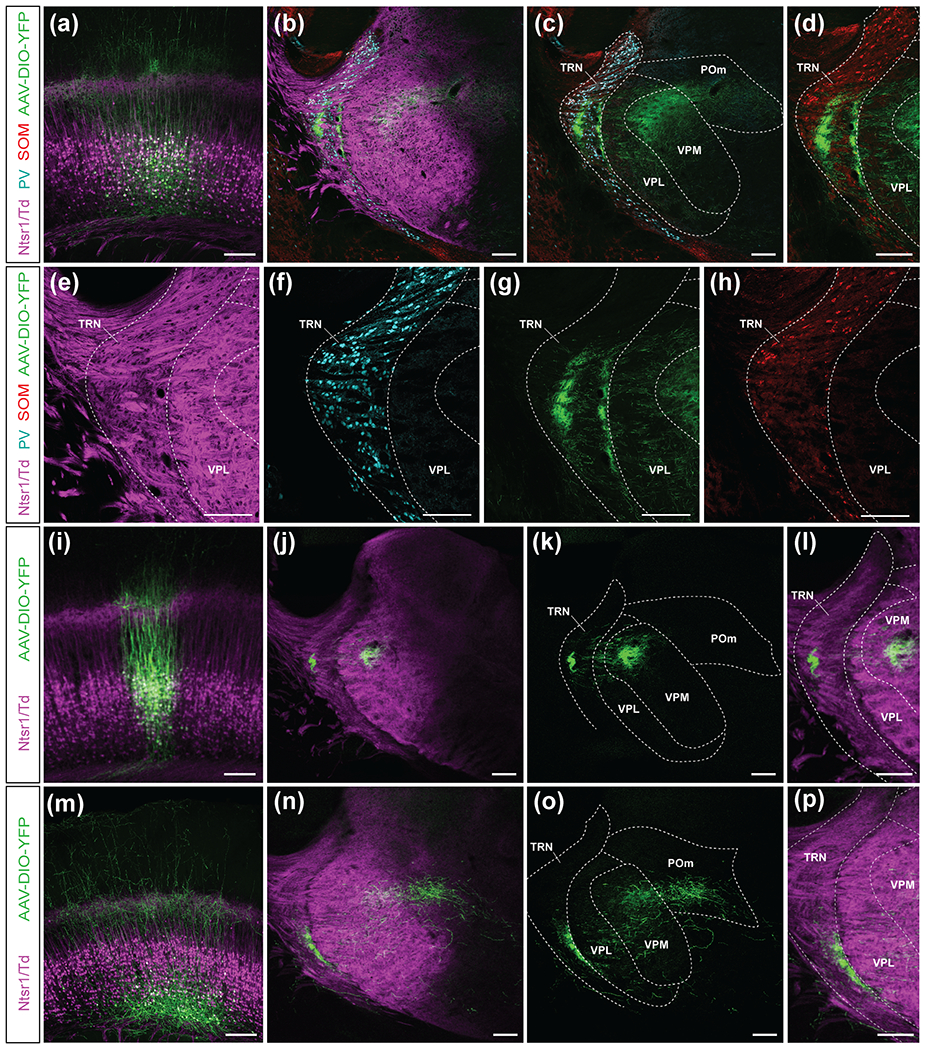
Axonal projections of VPM-only and VPM/POm layer 6 corticothalamic neurons (L6 CThNs) into the thalamic reticular nucleus (TRN). (a) Confocal image of a coronal section centered on L6a in which both VPM-only and VPM/POm L6 CThNs were transfected with a YFP-expressing virus. (b,c) Confocal images of a coronal section centered on the TRN showing two regions of YFP axon termination. Immunohistochemical staining was performed for parvalbumin (PV) and somatostatin (SOM). In (c), the Ntsr1-Cre;tdTomato-positive axons are not shown. (d) Higher magnification view of the image in (c) showing the SOM-positive cell bodies and YFP-expressing axons. (e,f,g,h) Higher magnification confocal images of the experiment shown in (a-d) with each channel separated to better visualize the components. (i) Confocal image of a coronal section centered on L6a from an example experiment in which the starter cells were enriched for VPM-only L6 CThNs. (j,k,l) Confocal images of the TRN from the experiment in (i) showing a single region of YFP axons in the TRN as well as axons in VPM. (m) Confocal image of a coronal section centered on L6a from an example experiment in which the starter cells are enriched for VPM/POm L6 CThNs. (n,o,p) Confocal images of the TRN from the experiment shown in (m) showing a single region of YFP axons in the TRN as well as axons in VPM and POm. Scale bars = 200 μm.
To determine how the two types of L6 CThNs contribute to this overall pattern of axonal projections in the TRN, we next biased our viral injections to upper or lower L6a to enrich for VPM-only or VPM/POm L6 CThNs (Frandolig, et al., 2019). When the population of transfected neurons was enriched for VPM-only L6 CThNs (Figure 7i), we observed YFP-labeled axons restricted to the core of the TRN (Figure 7j–l). In contrast, when the transfected population was enriched for VPM/POm L6 CThNs (Figure 7m), the YFP-labeled axons innervated the medial shell of the TRN (Figure 7n–p), which also receives POm input (Martinez-Garcia, et al., 2020). Interestingly, neither L6 CThN subtype projected to the lateral edge of the TRN. These results indicate that VPM-only L6 CThNs project to the same region of the TRN as VPM TC axons. In contrast, while POm TC axons project to both the medial and lateral shell of the TRN, the axons of VPM/POm L6 CThNs only project to the medial shell.
DISCUSSION
Determining the contributions of two major classes of L6 CThNs to sensory processing has been hindered in part because they have been difficult to access separately in many experimental paradigms. Here, we overcome these obstacles and identify differences in the synaptic inputs and outputs of enriched populations of VPM-only and VPM/POm L6 CThNs. Using trans-synaptic rabies tracing, we found that VPM/POm L6 CThNs in lower L6a receive more inputs from a broad range of brain areas than VPM-only L6 CThNs in upper L6a, including cortical areas such as M1/M2, S2, and RSP and subcortical areas such as the BLA, PF and CL. Previous studies have shown that the overall population of L6 CThNs in S1BF and other sensory areas receive inputs from regions similar to those described here for VPM/POm L6 CThNs (Clayton, et al., 2020; DeNardo, Berns, DeLoach, & Luo, 2015; Velez-Fort, et al., 2014). In these other sensory cortical areas, the organization of L6 CThNs exhibit parallels with those in S1. In visual cortex, for example, CThNs in upper L6 project to the lateral geniculate nucleus (LGN-only L6 CThNs) while CThNs in lower L6 project to the LGN as well as the pulvinar (L6 LGN/Pulv CThNs) (Bourassa & Deschênes, 1995; Kim, et al., 2014; Zarrinpar & Callaway, 2006). Based on our results, we hypothesize that previously reported long-range inputs to the overall population of L6 CThNs principally reflects input to the L6 CThNs in lower L6.
As for the targets of VPM-only and VPM/POm L6 CThNs in the thalamus, the complicated topology of projections within VPM and POm made it difficult to compare the axonal terminations of VPM-only and VPM/POm L6 CThNs in VPM. Previous work suggests that VPM-only L6 CThNs project to thalamic barreloids in a one-to-one manner (Deschênes, et al., 1998; Land, Buffer, & Yaskosky, 1995) while there has been some disagreement over the pattern of axonal terminations of VPM/POm L6 CThNs in VPM (Deschênes, et al., 1998; Hoogland, Welker, & Van der Loos, 1987; Land, et al., 1995). However, we did find marked differences in the projections of VPM-only and VPM/POm L6 CThNs into the TRN. These were spatially segregated, with distinct relationships to the termination zones of VPM and POm TC axons. VPM-only L6 CThNs projected to the central zone of the TRN, a region reciprocally connected with VPM (Lam & Sherman, 2007; Martinez-Garcia, et al., 2020; Pinault, et al., 1995). In contrast, VPM/POm L6 CThNs did not project to this central zone but rather projected to the medial edge of the TRN, a region that receives input from POm TC axons and contains neurons that project back to POm (Lam & Sherman, 2007; Martinez-Garcia, et al., 2020; Pinault, et al., 1995). Interestingly, a second region targeted by POm TC axons at the lateral edge of the TRN (Martinez-Garcia, et al., 2020) received neither VPM-only or VPM/POm L6 CThN input (Figure 7). Prior studies indicate that neither L5 CThNs nor a small population of L6 CThNs that projects to POm-only have axonal terminations in the TRN (Ansorge, et al., 2020; Deschênes, et al., 1994; Hoerder-Suabedissen, et al., 2018), suggesting that the lateral edge of the TRN may not receive CThN input from S1. These results indicate that, while VPM-only L6 CThN inputs and VPM TC inputs target the same region of the TRN, L6 VPM/POm CThNs are integrated into POm-related TRN circuits.
Technical considerations
With rabies-based trans-synaptic tracing, the possibility exists for trans-neuronal rather than trans-synaptic transmission between cells and for viral tropisms to influence the input cell types identified (Rogers & Beier, 2021). Furthermore, how differences in synaptic input influence the activity of the postsynaptic neurons remains unknown, particularly as trans-synaptic tracing does not directly reveal the functional properties of synaptic connections. For example, although trans-synaptic tracing indicated that both VPM and VPM/POm L6 CThNs receive input from VPM, we previously found that VPM input to VPM-only L6 CThNs was stronger than VPM input to VPM/POm L6 CThNs using a functional assessment, Channelrhodopsin-2-assisted circuit mapping (Frandolig, et al., 2019). Similar inconsistencies between functional connectivity and rabies-based anatomical connectivity have been previously noted (Audette, Bernhard, Ray, Stewart, & Barth, 2019; DeNardo, et al., 2015). Whether these are due to biological considerations such as synaptic strengths that are state dependent or technical considerations with rabies tracing will require further study. Nonetheless, the overall distribution of brain areas providing input to two L6 CThN cell types reported here is largely consistent with previous studies of the overall population of L6 CThNs in visual and auditory cortex.
Although there is good correspondence between Cre expression and VPM-only and VPM/POm L6 CThNs in S1BF by traditional retrograde labeling (Chevée, et al., 2018; Kim, et al., 2014), it also remains possible that a small population of additional cell types expresses Cre in Ntsr1-Cre mice such as L6 CThNs at the bottom of L6a that project to POm-only (Ansorge, et al., 2020; Bourassa, et al., 1995; Hoerder-Suabedissen, et al., 2018). However, experiments with starter neurons modestly biased for lower L6, and therefore relatively depleted of neurons in L6b, revealed tdTomato-labeled presynaptic cells in similar areas to experiments with starter neurons strongly biased to lower L6, suggesting any effects of this population on our results are small. However, further studies are needed to fully understand the diversity of L6 CThNs in the rodent S1BF and any differences in their synaptic organization.
Functional implications of the circuit organization of L6 CThNs subtypes
Our results add to growing evidence supporting distinct roles for VPM-only and VPM/POm L6 CThNs in sensory processing. The organization of the outputs of VPM-only L6 CThNs is consistent with a role in modulating neural activity related to a specific barrel column and barreloid. Not only do VPM-only L6 CThNs send axons to their related barreloid in VPM (Deschênes, et al., 1998; Land, et al., 1995), they also project axonal processes to the overlying barrel in L4 (Zhang & Deschênes, 1997) and synapse onto interlaminar PV inhibitory interneurons (Frandolig, et al., 2019). Here, we also found that VPM-only L6 CThNs project to a region of the TRN that is reciprocally connected with VPM, indicating that the outputs of these cells reflect the topographic organization of the barrel system. We also found that VPM-only L6 CThNs receive fewer synaptic inputs from distant brain regions than VPM/POm L6 CThNs. Together, these results suggest that VPM-only L6 CThNs contribute to the finely tuned control of sensory representations in cortex. The regulation of the gain of cortical responses to sensory input seen when optogenetically manipulating L6 CThNs using the Ntsr1-Cre mouse line or otherwise manipulating L6 CThN activity is consistent with this interpretation as is the spatiotemporal sculpting of receptive field properties (Born, et al., 2020; Guo, et al., 2017; Olsen, et al., 2012; Sillito, et al., 1994; Spacek, et al., 2020; Temereanca & Simons, 2004; Wang, et al., 2006).
In contrast, VPM/POm L6 CThNs project their thalamic axons to both VPM and POm, but how the VPM/POm L6 CThNs projections into VPM relate to the barreloid organization remains unclear (Deschênes, et al., 1998; Hoogland, et al., 1987; Land, et al., 1995). We show here that VPM/POm L6 CThN axons do not terminate in the core of the somatosensory TRN, which is reciprocally connected with VPM. Rather, VPM/POm L6 CThNs send axons to only one of two regions of the TRN that receive POm TC input, the medial shell of the TRN. Within S1BF, VPM/POm L6 CThNs densely ramify within S1 L5a (Bourassa, et al., 1995; Frandolig, et al., 2019), which is a major recipient layer for POm TC axons (Bureau, von Saint Paul, & Svoboda, 2006; Jouhanneau, et al., 2014; Ohno, et al., 2012; Wimmer, et al., 2010) and which contains corticostriatal neurons (Hattox & Nelson, 2007). VPM/POm L6 CThNs also receive inputs from L5a in the contralateral S1BF. Together, these results indicate that VPM/POm L6 CThNs are integrated into POm-related circuits. In addition, we show here that VPM/POm L6 CThNs receive more synaptic input than VPM-only L6 CThNs from a wide range of cortical and subcortical regions, including not only areas closely related to whisker-based perception and whisker control such as S2, M1/M2 and contralateral whisker areas, but also from cortical and subcortical areas thought to represent higher order contextual information such RSP, BLA and thalamic nuclei like PF. These results suggest that lower L6 CThNs may integrate motion information as detected in recent functional studies (Clayton, et al., 2020; Velez-Fort, et al., 2018; Velez-Fort, et al., 2014) and other contextual information, and may interface with cortico-thalamo-striatal circuits (Mandelbaum, et al., 2019). As some aspects of L6 CThNs in somatosensory cortex have parallels in other sensory systems, it will be important to assess whether some of these organizational principles generalize across sensory modalities and possibly across organisms.
Acknowledgements:
The authors thank Su-Jeong Kim, Alina Spiegel and Alan Wei for comments on the manuscript. We also thank the Stanford Neuroscience Gene Vector and Virus Core, the Janelia Viral Tools Facility, and the UNC Vector Core for viral vectors. This work was supported by the National Institutes of Health (RO1 NS085121; P30NS050274; RF1 MH121539) and the National Science Foundation (NSF 1656592). This work was also supported by the GT3 Core Facility of the Salk Institute with funding from NIH-NCI CCSG: P30 014195, an NINDS R24 Core Grant and funding from NEI. C.M.W. was supported by a Johns Hopkins Provost’s Undergraduate Research Award. M.C. was supported by a Boehringer-Ingelheim Fonds Fellowship. S.P.B. was supported by a Klingenstein-Simons Fellowship in the Neurosciences.
Footnotes
Competing financial interests: The authors declare no competing financial interests.
Data availability:
The data supporting the findings reported in this study will be made available from the corresponding author upon reasonable request.
REFERENCES
- Ansorge J, Humanes-Valera D, Pauzin FP, Schwarz MK, & Krieger P (2020). Cortical layer 6 control of sensory responses in higher-order thalamus. J Physiol, 598, 3973–4001. 10.1113/JP279915 [DOI] [PubMed] [Google Scholar]
- Audette NJ, Bernhard SM, Ray A, Stewart LT, & Barth AL (2019). Rapid plasticity of higher-order thalamocortical inputs during sensory learning. Neuron, 103, 277–291 e274. 10.1016/j.neuron.2019.04.037 [DOI] [PMC free article] [PubMed] [Google Scholar]
- Augustinaite S, & Kuhn B (2020). Complementary Ca2+ activity of sensory activated and suppressed layer 6 corticothalamic neurons reflects behavioral state. Curr Biol, 30, 3945–3960 e3945. 10.1016/j.cub.2020.07.069 [DOI] [PubMed] [Google Scholar]
- Beierlein M, & Connors BW (2002). Short-term dynamics of thalamocortical and intracortical synapses onto layer 6 neurons in neocortex. J Neurophysiol, 88, 1924–1932. 10.1152/jn.2002.88.4.1924 [DOI] [PubMed] [Google Scholar]
- Berg S, Kutra D, Kroeger T, Straehle CN, Kausler BX, Haubold C, … Kreshuk A (2019). ilastik: interactive machine learning for (bio)image analysis. Nat Methods, 16, 1226–1232. 10.1038/s41592-019-0582-9 [DOI] [PubMed] [Google Scholar]
- Born G, Erisken S, Schneider FA, Klein AM, Mornarhan MH, Lao CL, … Busse L (2020). Corticothalamic feedback sculpts visual spatial integration in mouse thalamus. bioRxiv, 10.1101/2020.05.19.104000. [DOI] [PubMed] [Google Scholar]
- Bortone DS, Olsen SR, & Scanziani M (2014). Translaminar inhibitory cells recruited by layer 6 corticothalamic neurons suppress visual cortex. Neuron, 82, 474–485. 10.1016/j.neuron.2014.02.021 [DOI] [PMC free article] [PubMed] [Google Scholar]
- Bourassa J, & Deschênes M (1995). Corticothalamic projections from the primary visual cortex in rats: a single fiber study using biocytin as an anterograde tracer. Neuroscience, 66, 253–263. 10.1016/0306-4522(95)00009-8 [DOI] [PubMed] [Google Scholar]
- Bourassa J, Pinault D, & Deschênes M (1995). Corticothalamic projections from the cortical barrel field to the somatosensory thalamus in rats: a single-fibre study using biocytin as an anterograde tracer. Eur J Neurosci, 7, 19–30. 10.1111/j.1460-9568.1995.tb01016.x [DOI] [PubMed] [Google Scholar]
- Briggs F, Kiley CW, Callaway EM, & Usrey WM (2016). Morphological substrates for parallel streams of corticogeniculate feedback originating in both V1 and V2 of the macaque monkey. Neuron, 90, 388–399. 10.1016/j.neuron.2016.02.038 [DOI] [PMC free article] [PubMed] [Google Scholar]
- Briggs F, & Usrey WM (2009). Parallel processing in the corticogeniculate pathway of the macaque monkey. Neuron, 62, 135–146. 10.1016/j.neuron.2009.02.024 [DOI] [PMC free article] [PubMed] [Google Scholar]
- Bureau I, von Saint Paul F, & Svoboda K (2006). Interdigitated paralemniscal and lemniscal pathways in the mouse barrel cortex. PLoS Biol, 4, e382. 10.1371/journal.pbio.0040382 [DOI] [PMC free article] [PubMed] [Google Scholar]
- Callaway EM, & Luo L (2015). Monosynaptic circuit tracing with glycoprotein-deleted rabies viruses. J Neurosci, 35, 8979–8985. 10.1523/JNEUROSCI.0409-15.2015 [DOI] [PMC free article] [PubMed] [Google Scholar]
- Carvell GE, & Simons DJ (1987). Thalamic and corticocortical connections of the second somatic sensory area of the mouse. J Comp Neurol, 265, 409–427. 10.1002/cne.902650309 [DOI] [PubMed] [Google Scholar]
- Cauller LJ, Clancy B, & Connors BW (1998). Backward cortical projections to primary somatosensory cortex in rats extend long horizontal axons in layer I. J Comp Neurol, 390, 297–310. [PubMed] [Google Scholar]
- Chevée M, Robertson JJ, Cannon GH, Brown SP, & Goff LA (2018). Variation in activity state, axonal projection, and position define the transcriptional identity of individual neocortical projection neurons. Cell Rep, 22, 441–455. 10.1016/j.celrep.2017.12.046 [DOI] [PMC free article] [PubMed] [Google Scholar]
- Cho J, & Sharp PE (2001). Head direction, place, and movement correlates for cells in the rat retrosplenial cortex. Behav Neurosci, 115, 3–25. 10.1037/0735-7044.115.1.3 [DOI] [PubMed] [Google Scholar]
- Clayton KK, Williamson RS, Hancock KE, Tasaka GI, Mizrahi A, Hackett TA, & Polley DB (2020). Auditory corticothalamic neurons are recruited by motor preparatory inputs. Curr Biol. 10.1016/j.cub.2020.10.027 [DOI] [PMC free article] [PubMed] [Google Scholar]
- Clemente-Perez A, Makinson SR, Higashikubo B, Brovarney S, Cho FS, Urry A, … Paz JT (2017). Distinct thalamic reticular cell types differentially modulate normal and pathological cortical rhythms. Cell Rep, 19, 2130–2142. 10.1016/j.celrep.2017.05.044 [DOI] [PMC free article] [PubMed] [Google Scholar]
- Constantinople CM, & Bruno RM (2013). Deep cortical layers are activated directly by thalamus. Science, 340, 1591–1594. 10.1126/science.1236425 [DOI] [PMC free article] [PubMed] [Google Scholar]
- Crabtree JW (2018). Functional diversity of thalamic reticular subnetworks. Front Syst Neurosci, 12, 41. 10.3389/fnsys.2018.00041 [DOI] [PMC free article] [PubMed] [Google Scholar]
- Crandall SR, Cruikshank SJ, & Connors BW (2015). A corticothalamic switch: controlling the thalamus with dynamic synapses. Neuron, 86, 768–782. 10.1016/j.neuron.2015.03.040 [DOI] [PMC free article] [PubMed] [Google Scholar]
- Crandall SR, Patrick SL, Cruikshank SJ, & Connors BW (2017). Infrabarrels are layer 6 circuit modules in the barrel cortex that link long-range inputs and outputs. Cell Rep, 21, 3065–3078. 10.1016/j.celrep.2017.11.049 [DOI] [PMC free article] [PubMed] [Google Scholar]
- Crochet S, Lee SH, & Petersen CCH (2019). Neural circuits for goal-directed sensorimotor transformations. Trends Neurosci, 42, 66–77. 10.1016/j.tins.2018.08.011 [DOI] [PubMed] [Google Scholar]
- DeNardo LA, Berns DS, DeLoach K, & Luo L (2015). Connectivity of mouse somatosensory and prefrontal cortex examined with trans-synaptic tracing. Nat Neurosci, 18, 1687–1697. 10.1038/nn.4131 [DOI] [PMC free article] [PubMed] [Google Scholar]
- Deschênes M, Bourassa J, & Pinault D (1994). Corticothalamic projections from layer V cells in rat are collaterals of long-range corticofugal axons. Brain Res, 664, 215–219. 10.1016/0006-8993(94)91974-7 [DOI] [PubMed] [Google Scholar]
- Deschênes M, Veinante P, & Zhang ZW (1998). The organization of corticothalamic projections: reciprocity versus parity. Brain Research Reviews, 28, 286–308. 10.1016/s0165-0173(98)00017-4 [DOI] [PubMed] [Google Scholar]
- Fitzpatrick D, Usrey WM, Schofield BR, & Einstein G (1994). The sublaminar organization of corticogeniculate neurons in layer 6 of macaque striate cortex. Vis Neurosci, 11, 307–315. 10.1017/s0952523800001656 [DOI] [PubMed] [Google Scholar]
- Flossmann T, & Rochefort NL (2020). Spatial navigation signals in rodent visual cortex. Curr Opin Neurobiol, 67, 163–173. 10.1016/j.conb.2020.11.004 [DOI] [PubMed] [Google Scholar]
- Frandolig JE, Matney CJ, Lee K, Kim J, Chevee M, Kim SJ, … Brown SP (2019). The synaptic organization of layer 6 circuits reveals inhibition as a major output of a neocortical sublamina. Cell Rep, 28, 3131–3143 e3135. 10.1016/j.celrep.2019.08.048 [DOI] [PMC free article] [PubMed] [Google Scholar]
- Gong S, Doughty M, Harbaugh CR, Cummins A, Hatten ME, Heintz N, & Gerfen CR (2007). Targeting Cre recombinase to specific neuron populations with bacterial artificial chromosome constructs. J Neurosci, 27, 9817–9823. 10.1523/JNEUROSCI.2707-07.2007 [DOI] [PMC free article] [PubMed] [Google Scholar]
- Groeneboom NE, Yates SC, Puchades MA, & Bjaalie JG (2020). Nutil: A pre- and post-processing toolbox for histological rodent brain section images. Front Neuroinform, 14, 37. 10.3389/fninf.2020.00037 [DOI] [PMC free article] [PubMed] [Google Scholar]
- Guillery RW (1995). Anatomical evidence concerning the role of the thalamus in corticocortical communication: a brief review. J Anat, 187 ( Pt 3), 583–592. [PMC free article] [PubMed] [Google Scholar]
- Guo W, Clause AR, Barth-Maron A, & Polley DB (2017). A corticothalamic circuit for dynamic switching between feature detection and discrimination. Neuron, 95, 180–194 e185. 10.1016/j.neuron.2017.05.019 [DOI] [PMC free article] [PubMed] [Google Scholar]
- Hasse JM, Bragg EM, Murphy AJ, & Briggs F (2019). Morphological heterogeneity among corticogeniculate neurons in ferrets: quantification and comparison with a previous report in macaque monkeys. J Comp Neurol, 527, 546–557. 10.1002/cne.24451 [DOI] [PMC free article] [PubMed] [Google Scholar]
- Hattox AM, & Nelson SB (2007). Layer V neurons in mouse cortex projecting to different targets have distinct physiological properties. J Neurophysiol, 98, 3330–3340. 10.1152/jn.00397.2007 [DOI] [PubMed] [Google Scholar]
- Hippenmeyer S, Vrieseling E, Sigrist M, Portmann T, Laengle C, Ladle DR, & Arber S (2005). A developmental switch in the response of DRG neurons to ETS transcription factor signaling. PLoS Biol, 3, e159. 10.1371/journal.pbio.0030159 [DOI] [PMC free article] [PubMed] [Google Scholar]
- Hoerder-Suabedissen A, Hayashi S, Upton L, Nolan Z, Casas-Torremocha D, Grant E, … Molnar Z (2018). Subset of cortical layer 6b neurons selectively innervates higher order thalamic nuclei in mice. Cereb Cortex, 28, 1882–1897. 10.1093/cercor/bhy036 [DOI] [PMC free article] [PubMed] [Google Scholar]
- Hoogland PV, Welker E, & Van der Loos H (1987). Organization of the projections from barrel cortex to thalamus in mice studied with Phaseolus vulgaris-leucoagglutinin and HRP. Exp Brain Res, 68, 73–87. 10.1007/BF00255235 [DOI] [PubMed] [Google Scholar]
- Hoseini MS, Higashikubo B, Cho FS, Chang AH, Clemente-Perez A, Lew I, … Paz JT (2020). Gamma rhythms and visual information in mouse V1 specifically modulated by somatostatin-positive neurons in reticular thalamus. BioRxiv, DOI: 10.1101/2020.05.06.081877. [DOI] [PMC free article] [PubMed] [Google Scholar]
- Ichida JM, Mavity-Hudson JA, & Casagrande VA (2014). Distinct patterns of corticogeniculate feedback to different layers of the lateral geniculate nucleus. Eye Brain, 2014, 57–73. 10.2147/EB.S64281 [DOI] [PMC free article] [PubMed] [Google Scholar]
- Jouhanneau JS, Ferrarese L, Estebanez L, Audette NJ, Brecht M, Barth AL, & Poulet JF (2014). Cortical fosGFP expression reveals broad receptive field excitatory neurons targeted by POm. Neuron, 84, 1065–1078. 10.1016/j.neuron.2014.10.014 [DOI] [PubMed] [Google Scholar]
- Killackey HP, & Sherman SM (2003). Corticothalamic projections from the rat primary somatosensory cortex. J Neurosci, 23, 7381–7384. 10.1523/JNEUROSCI.23-19-07381.2003 [DOI] [PMC free article] [PubMed] [Google Scholar]
- Kim J, Matney CJ, Blankenship A, Hestrin S, & Brown SP (2014). Layer 6 corticothalamic neurons activate a cortical output layer, layer 5a. J Neurosci, 34, 9656–9664. 10.1523/JNEUROSCI.1325-14.2014 [DOI] [PMC free article] [PubMed] [Google Scholar]
- Kinnischtzke AK, Fanselow EE, & Simons DJ (2016). Target-specific M1 inputs to infragranular S1 pyramidal neurons. J Neurophysiol, 116, 1261–1274. 10.1152/jn.01032.2015 [DOI] [PMC free article] [PubMed] [Google Scholar]
- Kinnischtzke AK, Simons DJ, & Fanselow EE (2014). Motor cortex broadly engages excitatory and inhibitory neurons in somatosensory barrel cortex. Cereb Cortex, 24, 2237–2248. 10.1093/cercor/bht085 [DOI] [PMC free article] [PubMed] [Google Scholar]
- Kirifides ML, Simpson KL, Lin RC, & Waterhouse BD (2001). Topographic organization and neurochemical identity of dorsal raphe neurons that project to the trigeminal somatosensory pathway in the rat. J Comp Neurol, 435, 325–340. 10.1002/cne.1033 [DOI] [PubMed] [Google Scholar]
- Koralek KA, Olavarria J, & Killackey HP (1990). Areal and laminar organization of corticocortical projections in the rat somatosensory cortex. J Comp Neurol, 299, 133–150. 10.1002/cne.902990202 [DOI] [PubMed] [Google Scholar]
- Kwegyir-Afful EE, & Simons DJ (2009). Subthreshold receptive field properties distinguish different classes of corticothalamic neurons in the somatosensory system. J Neurosci, 29, 964–972. 10.1523/JNEUROSCI.3924-08.2009 [DOI] [PMC free article] [PubMed] [Google Scholar]
- Kwon SE, Yang H, Minamisawa G, & O’Connor DH (2016). Sensory and decision-related activity propagate in a cortical feedback loop during touch perception. Nat Neurosci, 19, 1243–1249. 10.1038/nn.4356 [DOI] [PMC free article] [PubMed] [Google Scholar]
- Lam YW, & Sherman SM (2007). Different topography of the reticulothalmic inputs to first- and higher-order somatosensory thalamic relays revealed using photostimulation. J Neurophysiol, 98, 2903–2909. 10.1152/jn.00782.2007 [DOI] [PubMed] [Google Scholar]
- Land PW, Buffer SA Jr., & Yaskosky JD (1995). Barreloids in adult rat thalamus: three-dimensional architecture and relationship to somatosensory cortical barrels. J Comp Neurol, 355, 573–588. 10.1002/cne.903550407 [DOI] [PubMed] [Google Scholar]
- Lee SC, Patrick SL, Richardson KA, & Connors BW (2014). Two functionally distinct networks of gap junction-coupled inhibitory neurons in the thalamic reticular nucleus. J Neurosci, 34, 13170–13182. 10.1523/JNEUROSCI.0562-14.2014 [DOI] [PMC free article] [PubMed] [Google Scholar]
- Madisen L, Zwingman TA, Sunkin SM, Oh SW, Zariwala HA, Gu H, … Zeng H (2010). A robust and high-throughput Cre reporting and characterization system for the whole mouse brain. Nat Neurosci, 13, 133–140. 10.1038/nn.2467 [DOI] [PMC free article] [PubMed] [Google Scholar]
- Mandelbaum G, Taranda J, Haynes TM, Hochbaum DR, Huang KW, Hyun M, … Sabatini BL (2019). Distinct cortical-thalamic-striatal circuits through the parafascicular nucleus. Neuron, 102, 636–652 e637. 10.1016/j.neuron.2019.02.035 [DOI] [PMC free article] [PubMed] [Google Scholar]
- Manita S, Suzuki T, Homma C, Matsumoto T, Odagawa M, Yamada K, … Murayama M (2015). A top-down cortical circuit for accurate sensory perception. Neuron, 86, 1304–1316. 10.1016/j.neuron.2015.05.006 [DOI] [PubMed] [Google Scholar]
- Mao T, Kusefoglu D, Hooks BM, Huber D, Petreanu L, & Svoboda K (2011). Long-range neuronal circuits underlying the interaction between sensory and motor cortex. Neuron, 72, 111–123. 10.1016/j.neuron.2011.07.029 [DOI] [PMC free article] [PubMed] [Google Scholar]
- Martinez-Garcia RI, Voelcker B, Zaltsman JB, Patrick SL, Stevens TR, Connors BW, & Cruikshank SJ (2020). Two dynamically distinct circuits drive inhibition in the sensory thalamus. Nature, 583, 813–818. 10.1038/s41586-020-2512-5 [DOI] [PMC free article] [PubMed] [Google Scholar]
- Mease RA, Krieger P, & Groh A (2014). Cortical control of adaptation and sensory relay mode in the thalamus. Proc Natl Acad Sci U S A, 111, 6798–6803. 10.1073/pnas.1318665111 [DOI] [PMC free article] [PubMed] [Google Scholar]
- Minamisawa G, Kwon SE, Chevée M, Brown SP, & O’Connor DH (2018). A non-canonical feedback circuit for rapid interactions between somatosensory cortices. Cell Rep, 23, 2718–2731 e2716. 10.1016/j.celrep.2018.04.115 [DOI] [PMC free article] [PubMed] [Google Scholar]
- O’Neill PK, Gore F, & Salzman CD (2018). Basolateral amygdala circuitry in positive and negative valence. Curr Opin Neurobiol, 49, 175–183. 10.1016/j.conb.2018.02.012 [DOI] [PMC free article] [PubMed] [Google Scholar]
- Oh SW, Harris JA, Ng L, Winslow B, Cain N, Mihalas S, … Zeng H (2014). A mesoscale connectome of the mouse brain. Nature, 508, 207–214. 10.1038/nature13186 [DOI] [PMC free article] [PubMed] [Google Scholar]
- Ohno S, Kuramoto E, Furuta T, Hioki H, Tanaka YR, Fujiyama F, … Kaneko T (2012). A morphological analysis of thalamocortical axon fibers of rat posterior thalamic nuclei: a single neuron tracing study with viral vectors. Cereb Cortex, 22, 2840–2857. 10.1093/cercor/bhr356 [DOI] [PubMed] [Google Scholar]
- Olavarria J, Van Sluyters RC, & Killackey HP (1984). Evidence for the complementary organization of callosal and thalamic connections within rat somatosensory cortex. Brain Res, 291, 364–368. 10.1016/0006-8993(84)91270-8 [DOI] [PubMed] [Google Scholar]
- Olsen SR, Bortone DS, Adesnik H, & Scanziani M (2012). Gain control by layer six in cortical circuits of vision. Nature, 483, 47–52. 10.1038/nature10835 [DOI] [PMC free article] [PubMed] [Google Scholar]
- Petersen CC (2014). Cortical control of whisker movement. Annu Rev Neurosci, 37, 183–203. 10.1146/annurev-neuro-062012-170344 [DOI] [PubMed] [Google Scholar]
- Petreanu L, Mao T, Sternson SM, & Svoboda K (2009). The subcellular organization of neocortical excitatory connections. Nature, 457, 1142–1145. 10.1038/nature07709 [DOI] [PMC free article] [PubMed] [Google Scholar]
- Pinault D (2004). The thalamic reticular nucleus: structure, function and concept. Brain Res Brain Res Rev, 46, 1–31. 10.1016/j.brainresrev.2004.04.008 [DOI] [PubMed] [Google Scholar]
- Pinault D, Bourassa J, & Deschenes M (1995). The axonal arborization of single thalamic reticular neurons in the somatosensory thalamus of the rat. Eur J Neurosci, 7, 31–40. 10.1111/j.1460-9568.1995.tb01017.x [DOI] [PubMed] [Google Scholar]
- Puchades MA, Csucs G, Ledergerber D, Leergaard TB, & Bjaalie JG (2019). Spatial registration of serial microscopic brain images to three-dimensional reference atlases with the QuickNII tool. PLoS One, 14, e0216796. 10.1371/journal.pone.0216796 [DOI] [PMC free article] [PubMed] [Google Scholar]
- Ramos RL, Tam DM, & Brumberg JC (2008). Physiology and morphology of callosal projection neurons in mouse. Neuroscience, 153, 654–663. 10.1016/j.neuroscience.2008.02.069 [DOI] [PMC free article] [PubMed] [Google Scholar]
- Reardon TR, Murray AJ, Turi GF, Wirblich C, Croce KR, Schnell MJ, … Losonczy A (2016). Rabies irus CVS-N2c(DeltaG) strain enhances retrograde synaptic transfer and neuronal viability. Neuron, 89, 711–724. 10.1016/j.neuron.2016.01.004 [DOI] [PMC free article] [PubMed] [Google Scholar]
- Ribeiro EA, Nectow AR, Pomeranz LE, Ekstrand MI, Koo JW, & Nestler EJ (2019). Viral labeling of neurons synaptically connected to nucleus accumbens somatostatin interneurons. PLoS One, 14, e0213476. 10.1371/journal.pone.0213476 [DOI] [PMC free article] [PubMed] [Google Scholar]
- Rogers A, & Beier KT (2021). Can transsynaptic viral strategies be used to reveal functional aspects of neural circuitry? J Neurosci Methods, 348, 109005. 10.1016/j.jneumeth.2020.109005 [DOI] [PMC free article] [PubMed] [Google Scholar]
- Rouiller EM, & Welker E (2000). A comparative analysis of the morphology of corticothalamic projections in mammals. Brain Res Bull, 53, 727–741. 10.1016/s0361-9230(00)00364-6 [DOI] [PubMed] [Google Scholar]
- Sachdev RN, Lu SM, Wiley RG, & Ebner FF (1998). Role of the basal forebrain cholinergic projection in somatosensory cortical plasticity. J Neurophysiol, 79, 3216–3228. 10.1152/jn.1998.79.6.3216 [DOI] [PubMed] [Google Scholar]
- Schneider CA, Rasband WS, & Eliceiri KW (2012). NIH Image to ImageJ: 25 years of image analysis. Nat Methods, 9, 671–675. 10.1038/nmeth.2089 [DOI] [PMC free article] [PubMed] [Google Scholar]
- Sermet BS, Truschow P, Feyerabend M, Mayrhofer JM, Oram TB, Yizhar O, … Petersen CC (2019). Pathway-, layer- and cell-type-specific thalamic input to mouse barrel cortex. Elife, 8. 10.7554/eLife.52665 [DOI] [PMC free article] [PubMed] [Google Scholar]
- Sherman SM, & Guillery RW (1998). On the actions that one nerve cell can have on another: distinguishing “drivers” from “modulators”. Proc Natl Acad Sci U S A, 95, 7121–7126. 10.1073/pnas.95.12.7121 [DOI] [PMC free article] [PubMed] [Google Scholar]
- Sherman SM, & Guillery RW (2002). The role of the thalamus in the flow of information to the cortex. Philos Trans R Soc Lond B Biol Sci, 357, 1695–1708. 10.1098/rstb.2002.1161 [DOI] [PMC free article] [PubMed] [Google Scholar]
- Sherman SM, & Koch C (1986). The control of retinogeniculate transmission in the mammalian lateral geniculate nucleus. Exp Brain Res, 63, 1–20. 10.1007/BF00235642 [DOI] [PubMed] [Google Scholar]
- Shuler MG, Krupa DJ, & Nicolelis MA (2001). Bilateral integration of whisker information in the primary somatosensory cortex of rats. J Neurosci, 21, 5251–5261. 10.1523/JNEUROSCI.21-14-05251.2001 [DOI] [PMC free article] [PubMed] [Google Scholar]
- Sillito AM, Jones HE, Gerstein GL, & West DC (1994). Feature-linked synchronization of thalamic relay cell firing induced by feedback from the visual cortex. Nature, 369, 479–482. 10.1038/369479a0 [DOI] [PubMed] [Google Scholar]
- Spacek MA, Born G, Crombie D, Bauer Y, Liu X, Katzner S, & Busse L (2020). Robust effects of corticothalamic feedback during naturalistc visual stimulation. bioRxiv. 10.1101/776237 [DOI] [PMC free article] [PubMed] [Google Scholar]
- Sreenivasan V, Karmakar K, Rijli FM, & Petersen CC (2015). Parallel pathways from motor and somatosensory cortex for controlling whisker movements in mice. Eur J Neurosci, 41, 354–367. 10.1111/ejn.12800 [DOI] [PMC free article] [PubMed] [Google Scholar]
- Staiger JF, & Petersen CCH (2021). Neuronal circuits in barrel cortex for whisker sensory perception. Physiol Rev, 101, 353–415. 10.1152/physrev.00019.2019 [DOI] [PubMed] [Google Scholar]
- Stoelzel CR, Bereshpolova Y, Alonso JM, & Swadlow HA (2017). Axonal conduction delays, brain state, and corticogeniculate communication. J Neurosci, 37, 6342–6358. 10.1523/JNEUROSCI.0444-17.2017 [DOI] [PMC free article] [PubMed] [Google Scholar]
- Temereanca S, & Simons DJ (2004). Functional topography of corticothalamic feedback enhances thalamic spatial response tuning in the somatosensory whisker/barrel system. Neuron, 41, 639–651. 10.1016/s0896-6273(04)00046-7 [DOI] [PubMed] [Google Scholar]
- Tervo DG, Hwang BY, Viswanathan S, Gaj T, Lavzin M, Ritola KD, … Karpova AY (2016). A designer AAV variant permits efficient retrograde access to projection neurons. Neuron, 92, 372–382. 10.1016/j.neuron.2016.09.021 [DOI] [PMC free article] [PubMed] [Google Scholar]
- Theyel BB, Llano DA, & Sherman SM (2010). The corticothalamocortical circuit drives higher-order cortex in the mouse. Nat Neurosci, 13, 84–88. 10.1038/nn.2449 [DOI] [PMC free article] [PubMed] [Google Scholar]
- Tsumoto T, & Suda K (1980). Three groups of cortico-geniculate neurons and their distribution in binocular and monocular segments of cat striate cortex. J Comp Neurol, 193, 223–236. 10.1002/cne.901930115 [DOI] [PubMed] [Google Scholar]
- Usrey WM, & Fitzpatrick D (1996). Specificity in the axonal connections of layer VI neurons in tree shrew striate cortex: Evidence for distinct granular and supragranular systems. J Neurosci, 16, 1203–1218. 10.1523/JNEUROSCI.16-03-01203.1996 [DOI] [PMC free article] [PubMed] [Google Scholar]
- Usrey WM, & Sherman SM (2019). Corticofugal circuits: Communication lines from the cortex to the rest of the brain. J Comp Neurol, 527, 640–650. 10.1002/cne.24423 [DOI] [PMC free article] [PubMed] [Google Scholar]
- Veinante P, & Deschênes M (2003). Single-cell study of motor cortex projections to the barrel field in rats. J Comp Neurol, 464, 98–103. 10.1002/cne.10769 [DOI] [PubMed] [Google Scholar]
- Veinante P, Lavallee P, & Deschênes M (2000). Corticothalamic projections from layer 5 of the vibrissal barrel cortex in the rat. J Comp Neurol, 424, 197–204. 10.1002/1096-9861(20000821)424:2<197::AID-CNE1>3.0.CO;2-6 [DOI] [PubMed] [Google Scholar]
- Velez-Fort M, Bracey EF, Keshavarzi S, Rousseau CV, Cossell L, Lenzi SC, … Margrie TW (2018). A circuit for integration of head- and visual-motion signals in layer 6 of mouse primary visual cortex. Neuron, 98, 179–191 e176. 10.1016/j.neuron.2018.02.023 [DOI] [PMC free article] [PubMed] [Google Scholar]
- Velez-Fort M, Rousseau CV, Niedworok CJ, Wickersham IR, Rancz EA, Brown AP, … Margrie TW (2014). The stimulus selectivity and connectivity of layer six principal cells reveals cortical microcircuits underlying visual processing. Neuron, 83, 1431–1443. 10.1016/j.neuron.2014.08.001 [DOI] [PMC free article] [PubMed] [Google Scholar]
- Wall NR, De La Parra M, Sorokin JM, Taniguchi H, Huang ZJ, & Callaway EM (2016). Brain-wide maps of synaptic input to cortical interneurons. J Neurosci, 36, 4000–4009. 10.1523/JNEUROSCI.3967-15.2016 [DOI] [PMC free article] [PubMed] [Google Scholar]
- Wall NR, Wickersham IR, Cetin A, De La Parra M, & Callaway EM (2010). Monosynaptic circuit tracing in vivo through Cre-dependent targeting and complementation of modified rabies virus. Proc Natl Acad Sci U S A, 107, 21848–21853. 10.1073/pnas.1011756107 [DOI] [PMC free article] [PubMed] [Google Scholar]
- Wang W, Jones HE, Andolina IM, Salt TE, & Sillito AM (2006). Functional alignment of feedback effects from visual cortex to thalamus. Nat Neurosci, 9, 1330–1336. 10.1038/nn1768 [DOI] [PubMed] [Google Scholar]
- White EL, & DeAmicis RA (1977). Afferent and efferent projections of the region in mouse SmL cortex which contains the posteromedial barrel subfield. J Comp Neurol, 175, 455–482. 10.1002/cne.901750405 [DOI] [PubMed] [Google Scholar]
- Wickersham IR, Lyon DC, Barnard RJ, Mori T, Finke S, Conzelmann KK, … Callaway EM (2007). Monosynaptic restriction of transsynaptic tracing from single, genetically targeted neurons. Neuron, 53, 639–647. 10.1016/j.neuron.2007.01.033 [DOI] [PMC free article] [PubMed] [Google Scholar]
- Wimmer VC, Bruno RM, de Kock CP, Kuner T, & Sakmann B (2010). Dimensions of a projection column and architecture of VPM and POm axons in rat vibrissal cortex. Cereb Cortex, 20, 2265–2276. 10.1093/cercor/bhq068 [DOI] [PMC free article] [PubMed] [Google Scholar]
- Yang Q, Chen CC, Ramos RL, Katz E, Keller A, & Brumberg JC (2014). Intrinsic properties of and thalamocortical inputs onto identified corticothalamic-VPM neurons. Somatosens Mot Res. 10.3109/08990220.2013.869495 [DOI] [PMC free article] [PubMed] [Google Scholar]
- Yates SC, Groeneboom NE, Coello C, Lichtenthaler SF, Kuhn PH, Demuth HU, … Bjaalie JG (2019). QUINT: Workflow for quantification and spatial analysis of features in histological images from rodent brain. Front Neuroinform, 13, 75. 10.3389/fninf.2019.00075 [DOI] [PMC free article] [PubMed] [Google Scholar]
- Zagha E, Casale AE, Sachdev RN, McGinley MJ, & McCormick DA (2013). Motor cortex feedback influences sensory processing by modulating network state. Neuron, 79, 567–578. 10.1016/j.neuron.2013.06.008 [DOI] [PMC free article] [PubMed] [Google Scholar]
- Zarrinpar A, & Callaway EM (2006). Local connections to specific types of layer 6 neurons in the rat visual cortex. J Neurophysiol, 95, 1751–1761. 10.1152/jn.00974.2005 [DOI] [PubMed] [Google Scholar]
- Zhang ZW, & Deschênes M (1997). Intracortical axonal projections of lamina VI cells of the primary somatosensory cortex in the rat: a single-cell labeling study. J Neurosci, 17, 6365–6379. 10.1523/JNEUROSCI.17-16-06365.1997 [DOI] [PMC free article] [PubMed] [Google Scholar]
- Zhang ZW, & Deschênes M (1998). Projections to layer VI of the posteromedial barrel field in the rat: a reappraisal of the role of corticothalamic pathways. Cereb Cortex, 8, 428–436. 10.1093/cercor/8.5.428 [DOI] [PubMed] [Google Scholar]
Associated Data
This section collects any data citations, data availability statements, or supplementary materials included in this article.
Data Availability Statement
The data supporting the findings reported in this study will be made available from the corresponding author upon reasonable request.