Abstract
High-Z nanoparticles (HZNPs) afford high cross-section for high energy radiation and have attracted wide attention as a novel type of radiosensitizer. However, conventional HZNPs are often associated with issues such as heavy metal toxicity, suboptimal pharmacokinetics, and low cellular uptake. Herein, we explore gadolinium-intercalated carbon dots (Gd@Cdots) as a dose-modifying agent for radiotherapy. Gd@Cdots are synthesized through a hydrothermal reaction with an ultrasmall size (~ 3 nm) and a high Gd content. Gd@Cdots can significantly increase hydroxyl radical production under X-ray irradiation; this is attributed to not only the photoelectric effects of Gd, but also the surface catalytic effects of carbon. Because carbon is biologically and chemically inert, Gd@Cdots show low Gd leakage and minimal toxicity. In vitro studies confirm that Gd@Cdots can efficiently enhance radiation-induced cellular damage, causing elevated double strand breaks, lipid peroxidation, and mitochondrial depolarization. When tested in mice bearing non-small cell lung cancer H1299 tumors, intravenously injected Gd@Cdots plus radiation leads to improved tumor suppression and animal survival relative to radiation alone while causing no detectable toxicity. Our studies suggest a great potential of Gd@Cdots as a safe and efficient radiosensitizer.
Keywords: Radiation therapy, high-Z nanoparticles, radiosensitizer, carbon dots, non-small cell lung cancer
Graphical Abstract
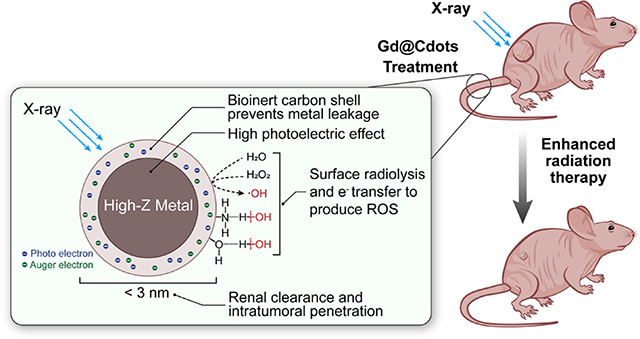
Gd@Cdots show excellent radiosensitizing effects due to small nanoparticle size, accumulation in mitochondria, high-Z photoelectric effects, and surface catalytic effects. Meanwhile, due to the bio-inertness of carbon, Gd@Cdots show very low metal leakage and toxicity. Gd@Cdots can be intravenously injected to enhance radiotherapy against non-small cell lung cancer, without causing dateable systemic toxicity.
Introduction
High-Z nanoparticles (HZNPs) are an emerging type of radiosensitizer.1–3 HZNPs can increase the production of photo- and Auger-electrons under high energy beams, thus enhancing the efficacy of radiotherapy (RT).4–9 Several groups reported that gold nanoparticles can augment cellular damage under KV and MV beams.7, 10, 11 Hafnium oxide nanoparticles (NBTXR3) and Gd-chelate-bound silica nanoparticles (AGuIX) have been tested in the clinic;4, 12 the former were approved in Europe for treatment of locally advanced soft tissue sarcoma. Bi-, Pt-, and W-containing HZNPs have also been synthesized and investigated.5, 8, 9, 13–16 Despite the promise, however, toxicity remains a major concern for HZNPs. Many HZNPs are often made of metals or metal oxides that may degrade over time to release toxic heavy metals. HZNPs made from inert materials cause less acute toxicity but may stay months in the host,17 and their long-term impact remains to be fully investigated. Furthermore, many conventional HZNPs have relatively large sizes (e.g. 20–200 nm in diameter), which limit their accumulation in tumors and uptake by cancer cells. Due to these restrictions, HZNPs are often injected intratumorally rather than systemically, which may limit their potential applications in the clinic.
Herein we explored ultrasmall Gd-encapsulated carbon dots, or Gd@Cdots, as a radiosensitizing agent. Others and us have synthesized Gd@Cdots and shown their potential as a magnetic resonance imaging (MRI) contrast agent.18–21 So far, however, few have investigated Gd@Cdots in radiotherapy. Our previous studies show that Gd@Cdots can accumulate in tumors through the enhanced permeability and retention (EPR) effect.18 We postulate that intravenously (i.v.) administered Gd@Cdots can enhance energy deposition in tumors and improve RT tumor management. Because Gd@Cdots show minimal Gd leakage (due to a biologically and chemically inert carbon coating)22 and efficient renal clearance (due to ultrasmall particle sizes)19, we also expect the treatment to cause minimal side effects. We tested these hypotheses first in vitro and then in vivo in mice bearing H1299 tumors, which originated from human non–small cell lung cancer (NSCLC). NSCLC is diagnosed in more than 187,000 persons each year in the US and is a leading cause of cancer-related mortality.23 RT is the standard care for the majority of NSCLC patients with locally advanced (T3–4) or local regional disease (N2-N3), which accounts for ~50% of newly diagnosed NSCLC cases. Despite technological advances, the rates of local failure in stage III NSCLC have remained high.24 Increasing radiation doses does not improve survival and may be harmful.25 Hence, there is an unmet clinical need for efficient and safe radiosensitizers for radiotherapy against NSCLC.
Experimental Section
Materials
P-phenylenediamine (pPD) (Sigma Aldrich, Cat# 78429), gadolinium nitrate hexahydrate (Gd(NO3)3∙6H2O, Sigma Aldrich, Cat# 211591), ethanol (KOPTEC, Cat# 19J14D), dialysis membrane (Spectrum, MWCO=100–500), Milli-Q H2O, 3-(4,5-dimethylthiazolyl-2)-2,5-diphenyltetrazolium bromide (MTT) (Sigma Aldrich, Cat# M2128).
Gd@Cdots Synthesis
Gd@Cdots were synthesized by a hydrothermal method following our previous publication.18 Briefly, 0.16 g of pPD and 0.6 g of Gd(NO3)3 were dissolved in 60 mL EtOH, and the solution was transferred into a 100 ml poly(tetrafluoroethylene)-lined stainless steel autoclave. The reaction was heated at 180 °C for 12 h and cooled down to room temperature. The resulting dark red suspension was purified using dialysis membrane (MWCO 500) against to Milli-Q water for 17 h to remove bi-carbon products and extra Gd3+ free ions. The final product was freeze dried for further experiment and long-term storage.
Physical characterizations
Transmission electron microscopy (TEM) was carried out on a FEI TECNAI 20 transmission electron microscope at 200 kV. The absorbance and fluorescence spectra were obtained on a BioTek Synergy MX multi-mode microplate reader. Scanning transmission electron microscopy (STEM) image was obtained using FEI G2 TECNAI F30 at 300 kV. The zeta potential and size distribution measurements were carried out on a Malvern Zetasizer Nano ZS system (Zeta potential +33.3mV, DLS 2.01nm). Energy-dispersive X-ray spectroscopy (EDS) and element mapping were performed on a FEI Inspect F FEG-SEM equipped with EDZX EDS system to confirm Gd contents in the carbon dots. Inductively coupled plasma mass spectrometry (ICP-MS) was used to analyze the Gd concentration in the sample for further study.
Mass spectrum analysis
We collected the mass spectra using both laser desorption ionization (LDI) and electrospray ionization (ESI) mass spectroscopy. ESI mass spectroscopy was performed on a Waters LCT Premier mass spectrometer. MassLynx was used as the software to collect spectra. Each ESI mass spectrum shown in this work was an average of 55 mass spectra collected in 1 minute with 0.1 second between every two one-second scans. Samples were diluted about 10 times before injection. For LDI measurements, we used the linear mode of the Comstock RTOF-210 mass spectrometer with a pulsed Nd:YAG laser at 355 nm (New Wave Research Polaris II). The laser power was less than 400 μJ/pulse. All the LDI mass spectra exhibited here were averaged from 200~500 scans. Sample solutions were applied to a solid copper tip, dried in air to form a thin film, and then inserted into the ion source.
Physical stability of Gd@Cdots
The Gd@Cdots were incubated in PBS at different pH (pH = 5.0 and 7.2) to test the stability of the particles and the release of Gd3+. The samples were kept in an incubating shaker at 37 °C. At each time point (0, 0.5, 1, 2, 4, 8 and 24 h), sample solutions were collected and centrifugated on micro-filter units (MWCO: 3k; Amicon® Cat# UFC800308). Solutions passing through the membrane was analyzed by ICP-MS to evaluate free Gd3+.
Optical properties of Gd@Cdots
Gd@Cdots were dispersed in Milli-Q H2O (100 μg/mL) and transferred to a quartz cuvette. Absorbance between 200–800 nm was scanned on a Varian Cary 300 bio UV-visible spectrometer. For emission spectrum, Gd@Cdots were dispersed in Milli-Q H2O (100 μg/mL) and placed in a black 96-well plate (Corning Costar, Cat# 3614). The fluorescence spectra were acquired on a microplate reader (Synergy Mx, BioTeK) with excitation at 457, 520, and 570 nm.
MRI phantom studies
MRI phantom samples were prepared by dispersing Gd@Cdots (0–0.1 mM) in 1% (w/w%) agarose gel. T1 and T2 images were acquired on a Varian Magnex 7 Tesla scanner. For T1-weighted images, a T1 inversion recovery fast spin echo (FSE) sequence was used using the following parameters: TR = 5000 ms, ESP = 7.69, Segment/ETL = 32/8, Effective TE = 30.75 ms, inversion times (TI) = 10.00–1500.0 ms with array size of 8, 256 × 256 matrices. For T2-weighted images, a FSE sequence was used with following parameters: TR = 2000 ms, TE = 8.00 ms, NE = 12, 256 × 256 matrices.
Reactive oxygen species analyses
Overall ROS generation was evaluated using methylene blue assay. Briefly, a series of Gd@Cdots (20, 60, and 120 μg/mL, based on Gd content, the same below) and 60 μg/mL of methylene blue were prepared in Tris Buffer (pH = 7.4). A 100 μL solution of Gd@Cdots and a 100 μL solution of methylene blue were added to a 96-well plate (Corning Costar, Cat#3599), making the final Gd concentrations being 10, 30, and 60 μg/mL. The initial absorbance was measured on a microplate reader (Synergy Mx, BioTeK). The Gd@Cdots methylene blue solution was irradiated with 5 Gy X-ray. The absorbance after irradiation was measured and compared to the initial absorbance. The difference was computed and used to evaluate overall reactive oxygen species generation.
Singlet oxygen (1O2) and hydroxyl radical (∙OH) were measured using Singlet Oxygen Sensor Green (SOSG, Invitrogen™, Cat# S36002) and Terephthalic Acid (TA, Sigma Aldrich, Cat# 185362), respectably. Briefly, a series of Gd@Cdots (20, 60 and 120 μg/mL), 2 μM of SOSG, and 16 mM of TA solution were prepared in Tris buffer solutions. A 100 μL solution of Gd@Cdots, and a 100 μL chemical sensor solution (SOSG or TA) were mixed and added to a 96-well plate (Corning Costar, Cat# 3614); the final Gd concentrations were 10, 30 and 60 μg/mL. The initial fluorescence was measured on a microplate reader (Synergy Mx, BioTeK). The Gd@Cdots solutions received 5 Gy irradiation and the fluorescence was measured again. The variation in fluorescence intensity was computed to evaluate singlet oxygen and hydroxyl radical production. To test whether the surface chemical functional groups of Gd@Cdots facilitate radical production, nanoparticles were incubated in solutions containing 0.1% Triton X-100 before mixing with TA and receiving irradiation.
Cell uptake studies
H1299 cells, which originated from human non-small lung cancer tumors, were cultured by following a protocol provided by ATCC. Gd@Cdots co-localization in the lysosome and mitochondria were tested using LysoTracker™ Green DND-26 (ThermoFisher, Cat# L7526) and MitoTracker™ Green FM (ThermoFisher, Cat# M7514), respectably. Briefly, 1×10⁶ of H1299 cells were seeded on 2-chamber glass slide (Nunc™ Lab-Tek™ II Chamber Slide™ System, ThermoFisher) and incubated with Gd@Cdots at 37 °C for 4 h. After the cells were washed with PBS for 3 times, 20 nM LysoTracker or MitoTracker was added to stain the lysosome or the mitochondria for 30 min, respectably. The cells were fixed with 4% formaldehyde, and cell nuclei were stained with DAPI. Fluorescence images were taken on a Zeiss LSM 710 Confocal Microscope with 40× magnification.
Scanning transmission electron microscopy
To study the intra-cellular distribution of the particle, cells were also imaged by scanning transmission electron microscopy (STEM, FE-SEM FEI Teneo). Briefly, H1299 cells were incubated with Gd@Cdots for 4 h. The cells were collected, fixed with glutaraldehyde, and sectioned into thin slices. Resulting samples were loaded onto a carbon grid. The distribution of Gd@Cdots was evaluated on a FE-SEM Thermo Fisher Teneo system with EDS mapping.
Cytotoxicity
Cell viability was studied with H1299 cells using standard MTT and ATP bioluminescence assays. For MTT assays, H1299 cells (8000 cells per well) were seeded onto a 96-well plates (Corning Costar, Cat#3599). When cells were attached, Gd@CDots at a final concentration of 0–207.6 μg/mL were added into the wells and incubated with cells for 24 h. A 20 μL solution of 10 mg/mL 3-(4,5-dimethylthiazolyl-2)-2,5-diphenyltetrazolium bromide was added into each well. After 4 h, the solution was aspirated, and 100 μL of DMSO was added to each well. The absorbance at 570 nm was measured on a BioTek Synergy MX multi-mode microplate reader. For ATP assays, cells were incubated with Gd@Cdots (60 μg/mL), carbon dots (60 μg/mL), or PBS for 4 h, followed by 5 Gy irradiation. After 24 h incubation, the supernatant was completely removed, and 55 μL cell culture medium and 55 μL ATP kit solution were added. Solution from each well was transferred to a new, opaque 96-well plate and luminescence signal was measured on a microplate reader (Synergy Mx, BioTeK). The result was compared to a standard curve established according to the manufacture’s protocol.
Mitochondrial membrane potential (ΔΨm)
ΔΨm change was assessed by JC-1 staining (Biotium, Cat# 30001). The JC-1 working solution was prepared by adding 10 μL of the concentrated dye to 1 mL of FBS free RPMI medium. 200 μL of cell culture medium containing Gd@Cdots (30 μg/mL) or PBS was incubated with cells for 4 h. The cells were irradiated with 5 Gy and incubated for 24 h. The medium was removed and replaced with the JC-1 working solution. After 15 min incubation, the fluorescence signals of the stained cells were measured on a microplate reader (green: ex/em 510/527 nm; red: ex/em 585/590 nm), and the green-to-red fluorescence intensity ratio was computed.
Cytochrome c release
Cytochrome c release was evaluated using ApoTrack™ Cytochrome c Apoptosis ICC Antibody Kit (Abcam, Cat# ab110417). Briefly, 1×10⁶ of H1299 cells were seeded onto 2-well chamber slide for attachment. The cells were then incubated with Gd@Cdots (30 μg/mL) or PBS for 4 h before receiving 5 Gy irradiation. After 24 h, antibody was added following the manufacture’s protocol. Images were taken on a Zeiss LSM 710 Confocal Microscope and analyzed by ImageJ.
Caspase-3 activity
For caspase-3 activity measurement, H1299 cells were incubated with Gd@Cdots (30 μg/mL) or PBS for 4 h, followed by 5 Gy irradiation. After 24 h incubation, cells were stained using FAM-FLICA® Caspase-3/7 kit (Immunochemistry, Cat# 94) following the manufacturer’s protocol. The caspase-3 activity was evaluated by measuring fluorescence signals (ex/em: 488/530 nm) on a microplate reader (Synergy Mx, BioTeK).
Lipid peroxidation assay
Image-iT Lipid Peroxidation Kit (Abcam, Cat# ab118970) was used to assess lipid peroxidation. Briefly, cells were pre-seeded onto a 96-well plate and incubated with Gd@Cdots (30 μg/mL), carbon dots (30 μg/mL), or PBS at 37 °C for 24 h. After replenishing medium, cells received 5 Gy irradiation. After 24 h, cells were stained with Image-iT Lipid peroxidation sensor (30 μM) for 30 minutes at 37 °C, and washed with PBS for three times. The yellow and green fluorescence intensities (ex/em: 581/591 nm and 488/510 nm, respectively) were recorded on a microplate reader (Synergy Mx, BioTeK), and the ratio between them was computed.
rH2AX assay
The DNA damage was evaluated using anti-rH2AX (Alexa 647) antibody (Millipore Sigma, Cat# 07–164-AF647). Briefly, H1299 cells were pre-seeded onto a 35-mm cell culture dish and incubated with Gd@Cdots (30 μg/mL), carbon dots (30 μg/mL), or PBS. After 4 hour incubation, cells received 5 Gy irradiation and continued incubation for another 1 h at 37 °C. The cells were then collected, fixed, and permeabilized, and stained with anti-rH2AX antibody according to the protocol from the manufacture. Cells with positive anti-rH2AX stain was analyzed using a Millipore Sigma ImageStream X Mark II Imaging Flow Cytometer.
Clonogenic assay
Briefly, H1299 cells were pre-seeded onto a 35-mm cell culture dish (Corning, Cat# 430165) and incubated with Gd@Cdots (10 μg/mL) or PBS for 12 h. After washing, cells were collected and seeded (100–10000 cells, depending on the radiation dose) onto a 100-mm plate (Falcon, Cat# 353003), and irradiated (0–10 Gy). After 14 days, colonies were stained with crystal violet and counted. Data were fit into the linear-quadratic model: S(D)/S(0) = exp-(aD+bD2), where S is cell survival fraction, D is radiation dose, and a&b are fitting coefficients.
In vivo radiation therapy
All animal experiments were performed in accordance with the Guidelines for Care and Use of Laboratory Animals of the University of Georgia and approved by the Institutional Animal Care and Use Committee (IACUC) of the University of Georgia. In vivo therapy studies were performed on H1299 subcutaneous tumor models established on 4-week-old female nude mice purchased from Charles River. The tumor model was developed by subcutaneous injection of 2.5×10⁶ H1299 cells into the right flank of mice. When the tumor size reached 100 mm3, the mice were randomly divided into three groups (PBS, PBS+RT, and Gd@Cdots+RT). The radiation was delivered through an X-RAD 320 system. Gd@Cdots were intravenously injected (0.1 mmol/kg, 200 μL); after 4 hours, tumors received 6 Gy radiation, with the rest of the animal body lead-shielded. The tumor size was measured every 2 days with a caliper, and the tumor volume was calculated using the equation: tumor volume = (tumor length × tumor width2)/2). The mice were euthanized when a humane end point was reached. Tumors and major organs such as the brain, liver, heart, lung, intestine, kidney, and spleen were collected for hematoxylin and eosin (H&E) and TUNEL staining.
Complete blood counts and biochemistry analysis
In a separated experiment, three balb/c mice were intravenously injected with PBS or Gd@Cdots (0.1 mmol Gd/kg). Blood samples were collected using a cardiac puncture blood collection method. 250 μL of blood samples was subjected for complete blood counts. The remaining blood samples were used to evaluate liver and kidney function using Alanine Aminotransferase (ALT) ELISA kit (Abcam, Cat# ab105134) and Urea Nitrogen (BUN) detection kit (Arbor Assays, Cat# K024H1), respectively.
Statistical analysis
Graphpad Prism 8 software (GraphPad Software, San Diego, CA) was used for statistical analysis. For reactive oxygen species studies and all the in vitro studies, data were expressed as mean ± s.e.m. For in vivo study, each group had 5 animals (n = 5). Statistical significance was evaluated by one-way ANOVA or two-way ANOVA with multiple comparison. The statistical significance was set at *p < 0.05.
Results and discussion
Nanoparticle synthesis and characterizations
Gd@Cdots were synthesized through a hydrothermal reaction. Briefly, p-phenylenediamine (pPD) and Gd (NO3)3 were dissolved in EtOH, and the solution was transferred into an autoclave. The reaction took place at 180 °C for 12 h. After reaction, we collected nanoparticles by centrifugation and subjected them to dialysis to remove unreacted precursors and surface-bound metals. The purified products were re-suspended in water, forming a transparent, wine-colored solution (Fig. S1).
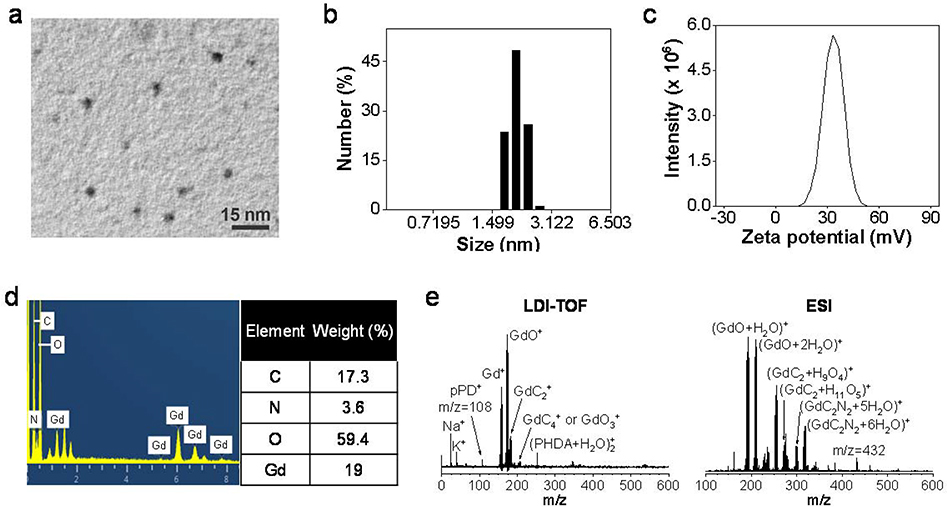
The size and morphology of the nanoparticles was analyzed by transmission electron microscopy (TEM, Fig. 1a) and scanning transmission electron microscopy (STEM, Fig. S2). The average nanoparticle size was 2.6 ± 0.7 nm (n = 50 particles), with a relatively narrow size distribution (Fig. S3). Dynamic light scattering (DLS) confirmed that the nanoparticles were 2–3 nm in diameter with a polydispersity index (PDI) of 0.364 (Fig. 1b). Zeta potential analysis showed that the nanoparticle surface was positively charged (+33.3 mV, Fig. 1c), which is due to surface amine groups inherited from pPD.
Figure 1.
Size and composition analysis of Gd@Cdots. (a) A representative TEM image of Gd@Cdots. The average particle size was 2.6 nm. (b) Hydrodynamic size of Gd@Cdots, measured by DLS. (c) Zeta potential analysis of Gd@Cdots. The nanoparticles carry a positive surface charge (+33.3 mV). (d) Elemental analysis by EDS. Molar ratios between carbon and nitrogen or gadolinium were presented. (e) Mass spectra of Gd@Cdots, analyzed using LDI-TOF (left) and ESI (right).
The composition of Gd@Cdots was investigated by energy dispersive spectroscopy (EDS, Fig. 1d). A high Gd content was observed, with a Gd/C molar ratio of 0.09:1 (Fig. 1d). Moreover, a significant amount of nitrogen was found in the particles, which was mainly attributed to the surface amine groups. We further probed the nanoparticle composition by mass spectroscopy (MS) using a time-of-flight (TOF) detector. Figure 1e shows the MS spectra of Gd@Cdots after laser desorption and electrospray ionization. Oxidized Gd clusters were detected and assigned to GdC2+ clusters or their water/N2 solvated clusters (Fig. 1e). It is reasoned that Gd is tightly bound to the carbon matrix that is fragmented during laser desorption or ionization, forming clusters. Fragmentation and successive loss of C2 units is common among carbon species such as fullerenes.26, 27
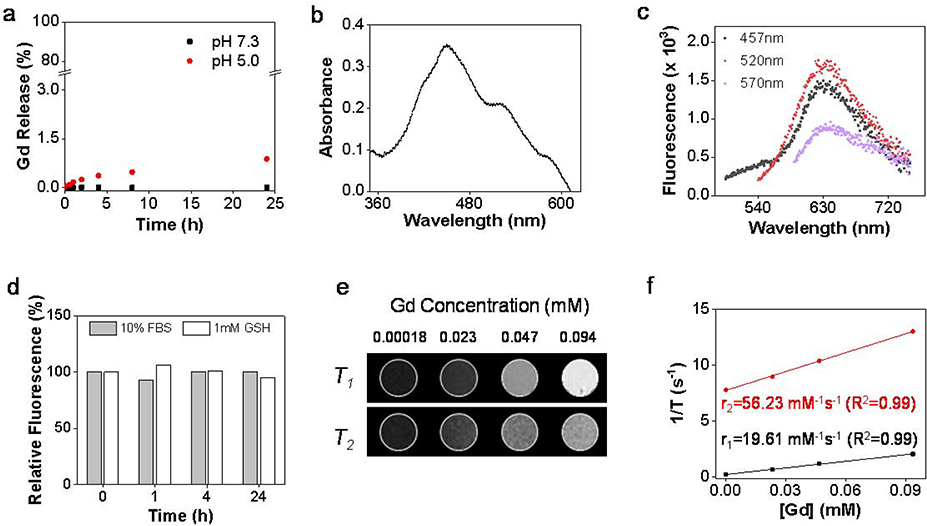
The stability of Gd@Cdots was assessed by analyzing Gd3+ released from the nanoparticles in different solutions. In both neutral and acidic buffer solutions (pH = 7.4 and 5.0, respectively), less than 1% Gd was released over 24 h incubation (Fig. 2a). Minimal Gd3+ release was also observed when nanoparticles were incubated in the serum or glutathione solutions (GSH, Fig. S4). The low Gd leakage was attributed to the inert carbon coating that prevents metal escape.
Figure 2.
Physical characterizations of Gd@Cdots. (a) Gd3+ released from Gd@Cdots in neutral and acidic solutions (pH 7.0 and 5.0) at 37 ºC for 24 h, evaluated by ICP-MS. (b) Absorbance spectrum of Gd@Cdots. There peaks at 457, 520, and 570 nm were observed. (c) Fluorescence spectra of Gd@Cdots. Emission peaks around 630 nm were observed when the nanoparticles were excited by 457, 520, and 570 nm light. (d) Fluorescence intensitiy when Gd@Cdots were incubated in 10% FBS or 1 mM GSH for 24 h at 37 ºC. Compared to pre-incubation solutions, minimal fluorescence change was observed over the incubation, indicating high stability of the nanoparticles. e&f), phantom studies with Gd@Cdots agarose gel samples (Gd concentration 0.00018–0.094 mM), measured on a 7 T magnet. (e) T1 and T2 MR images of Gd@Cdots gel samples. (f) r1 and r2 relaxation of Gd@Cdots, evaluated based on results from e).
Gd@Cdots show three distinct absorbance peaks at 457, 520, and 570 nm (Fig. 2b). This is different from Gd@Cdots or Cdots made from calcination, which often show broad absorbance across the visible spectrum region.28 Gd@Cdots also display intense fluorescence at ~ 635 nm (Fig. 2c&d), which potentially benefits imaging. As observed in previous studies, Gd@Cdots afford strong magnetic properties. This was demonstrated in a phantom study, where Gd@Cdots of different concentrations were dispersed in 1% agarose gel and scanned on a 7T magnet (Fig. 2e). Gd@Cdots showed concentration-dependent signal increase on T1 images. Based on region of interest (ROI) analysis and linear regression fitting, it was determined that the r1 relaxivity of Gd@Cdots was 19.6 mM−1s−1, and the r2/r1 ratio was 2.87 (Fig. 2f).
Radical production under radiation
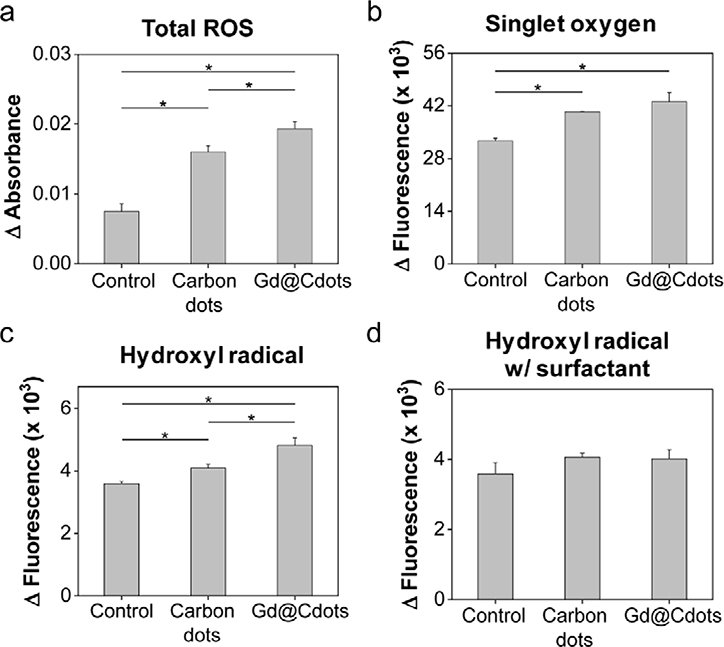
We then examined whether Gd@Cdots can enhance radical production under beam radiation. This was tested in a Tris buffer solution (pH 7.4) using methylene blue, singlet oxygen sensor green (SOSG), and terephthalic acid (TA) as radical probes. While methylene blue can be bleached by a wide range of radicals,29–31 SOSG and TA are selective flurogenic probes for singlet oxygen (1O2) and hydroxyl radicals (∙OH), respectively.32–35 Relative to the control, Gd@Cdots (30 μg/mL) significantly increased the degree of methylene blue bleaching under irradiation (5 Gy, Fig. 3a). Meanwhile, fluorescence signals of SOSG and TA were both increased in solutions containing Gd@Cdots (Fig. 3b&c), suggesting that the particles enhance reactive oxygen species (ROS) production under radiation.
Figure 3.
Radical production in the presence of Gd@Cdots (30 μg/mL). (a) ROS level changes, evaluated by measuring methylene blue fluorescence change. *p < 0.05. (b) Singlet oxygen (1O2) production, measured by SOSG assay. *p < 0.05. (c) Hydroxyl radical (∙OH) generation, measured using TA as a probe. *p < 0.05. (d) Hydroxyl radical production in the presence of Triton X-100.
For comparison, carbon dots of the same size were prepared and tested. Interestingly, in carbon dots solutions, 1O2 and ∙OH were also elevated under radiation, although the amplitude of increase was less prominent than in Gd@Cdots solutions (Fig. 3b). This observation suggests that in addition to gadolinium’s photoelectric effects, the carbon shell may have played a role in boosting radical generation. We reason that this enhancement is attributed to the surface catalytic effects that promote ionization of molecules such as water. Specifically, with a large surface area and multiple surface amine groups, Gd@Cdots/carbon dots may form hydrogen bonds with surrounding water molecules, thus weakening the intramolecular H-OH bond and facilitating water radiolysis. To investigate, we repeated the TA study but adding a surfactant, Triton X-100, into the Gd@Cdots solution to break the hydrogen bond between the particles and water. We found a significantly decreased TA fluorescence, supporting the postulation that surface catalytic effects contribute to radical production (Fig. 3d).
Cellular uptake and cytotoxicity
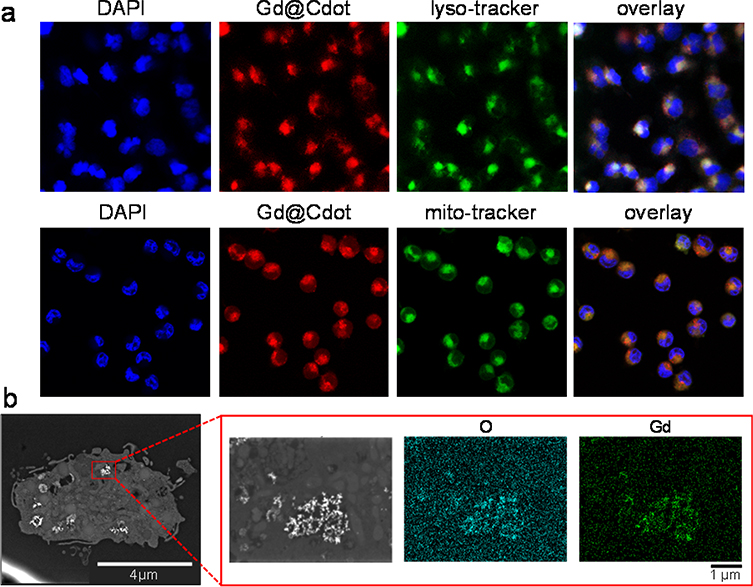
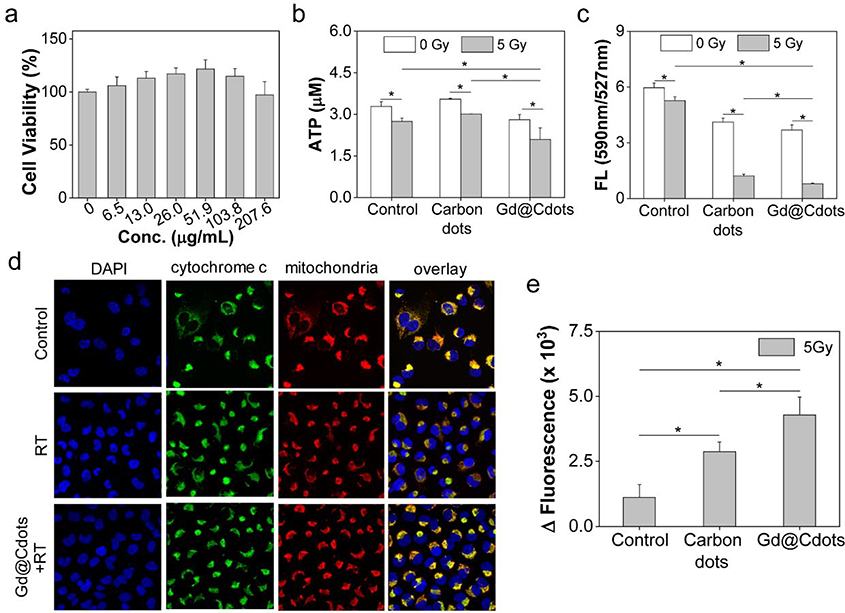
We next examined Gd@Cdots uptake by cancer cells. We tested this in H1299 cells, which are a human NSCLC cell line. Gd@Cdots can be readily traced under a microscope due to intrinsic fluorescence. We observed a good signal overlap between LysoTracker and Gd@Cdots, suggesting that Gd@Cdots enter cells through endocytosis (Fig. 4a). This was supported by STEM analysis of sectioned cell samples, which found many nanoparticles in the endosomes/lysosomes (Fig. 4b). Meanwhile, MitoTracker staining revealed that a significant amount of Gd@Cdots were accumulated in the mitochondria (Figs. 4a and S5). This is attributed to Gd@Cdots’ compact size and their positive surface charge, both factors benefiting mitochondrion translocation and retention.36, 37 We then assessed the cytotoxicity of Gd@Cdots by MTT assay. No significant viability drop was observed even at high Gd concentrations (e.g. 1.32 mM, Fig. 5a). This low toxicity is consistent with our previous observations, and is attributable to minimal Gd leakage.18, 19
Figure 4.
Cell uptake of Gd@Cdots. (a) Fluorescence microscopy analysis. LysoTracker and MitoTracker green were as counter-stains to label endosomes/lysosomes and mitochondria, respectively. (b) STEM analysis of sectioned cell samples. Clusters of Gd@Cdots in the endosomes were visualized.
Figure 5.
Impact of Gd@Cdots on cell viability, evaluated with H1299 cells. (a) Cell viability in the absence of radiation, measured by MTT assay. (b) Cell viability under radiation (5 Gy), measured by ATP bioluminescence assay. Gd@Cdots (30 μg/mL) were incubated with cells during radiation. Cdots were also tested as a comparison. (c) Mitochondrial membrane potential change, measured by JC-1 staining. (d) Cytochrome c release, evaluated by cytochrome c and mitochondria double staining. Cytochrome c translocation into the cytosol was indicated by red arrows. (e) Activation of apoptosis, evaluated by caspase 3 activity assay. *, p < 0.05.
Cytotoxicity and clonogenicity studies
We further assessed the impact of Gd@Cdots on radiation-induced cell killing. ATP bioluminescence assay found that Gd@Cdots plus radiation (Gd@Cdots+RT, 5 Gy) caused a significant drop of cell viability by 36.1%, compared to 16.3% for RT alone (Fig. 5b). Considering that Gd@Cdots accumulate in mitochondria, we postulate that the particles may promote damage to the organelle. Indeed, JC-1 staining found that Gd@Cdots+RT led to a significant decrease of mitochondrial membrane potential (ΔΨm) relative to RT alone (manifested in a decrease of red-to-green fluorescence ratio, Fig. 5c). The mitochondrial depolarization in turn caused cytochrome c translocation to the cytosol (Fig. 5d) and activation of the intrinsic apoptosis pathway, which was evidenced by increased caspase 3 activity (Fig. 5e).
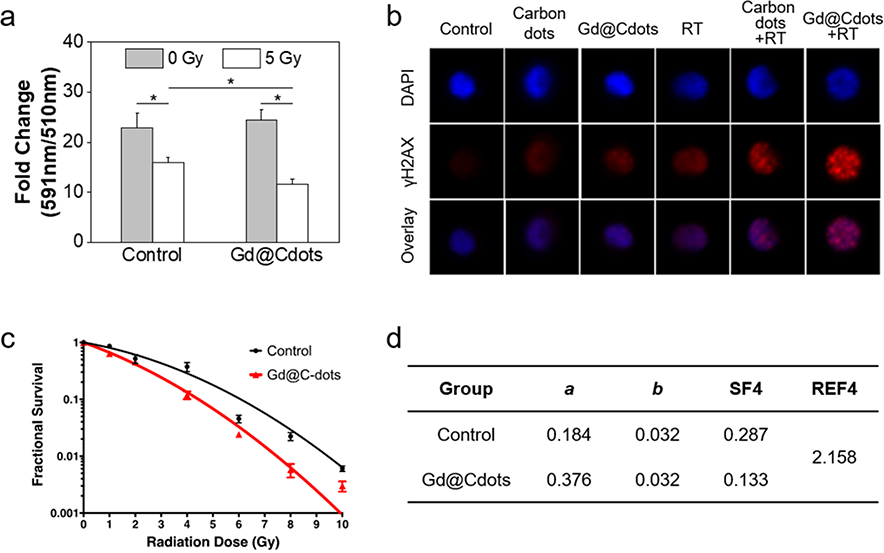
Mitochondrion damage would also exacerbate oxidative stress in cells and in turn cause extensive damage to other cellular components. For instance, BODIPY fluorogenic assay showed that cell lipid peroxidation level was increased by 49.4% in the presence of Gd@Cdots (Fig. 6a). γH2AX staining identified an increased foci number, indicating enhanced DNA damage with Gd@Cdots+RT (Figs. 6b and S6). It is worth mentioning that some Gd@Cdots were found inside cell nuclei (Fig. 4a), which may have contributed to the double-strand breaks.
Figure 6.
Radiosensitizing effects, tested in H1299 cells with Gd@Cdots (30 μg/mL). (a) Lipid peroxidation, measured by Image-iT BODIPY assay. A decrease of 590/510 nm fluorescence ratio indicates an increased level of lipid peroxidation. *, p < 0.05. (b) DNA damage, measured by rH2AX staining. The images were acquired on an ImageStream X Mark II Imaging Flow Cytometer. (c) Clonogenic assay results. H1299 cells treated with Gd@Cdots (30 μg/mL) or PBS only and received 0–10 Gy radiation. The results were fit into an linear-quadratic equation: S(D)/S(0) = exp-(aD+bD2), where S is cell Survival fraction, D is radiation dose, and a&b are coefficients. (d) Radiation enhancement factor at 4 Gy (REF4), computed based on results from (c).
Last but not least, we assessed the dose-modifying effects of Gd@Cdots by clonogenic assay. Briefly, H1299 cells were incubated with Gd@Cdots (10 μg·Gd/mL) or PBS and then subjected to radiation at elevated doses (0–10 Gy). The treated cells were then seeded onto a petri-dish, and after 14 days, colonies with more than 50 cells were counted. The results were fitted into the linear-quadratic equation (Figs. 6c&d). The presence of Gd@Cdots significantly enhanced the efficacy of RT at all tested doses. The survival fraction at 4 Gy, or SF4, was 0.133 for the Gd@Cdots+RT group, compared to 0.287 in the RT-only control. This represents a radiation enhanced factor at 4 Gy, or REF, of 2.158. For comparison, gold nanoparticles at the same metal concentration were also tested. Although Au is a much heavier atom (Z=79, compared to 64 of Gd), gold nanoparticles showed a lower REF of 1.759 (Fig. S7). The superior radiosensitizing effects are attributed to Gd@Cdots’ surface effects and possibly their accumulation in critical organelles such as the mitochondria and nuclei.
In vivo therapy studies
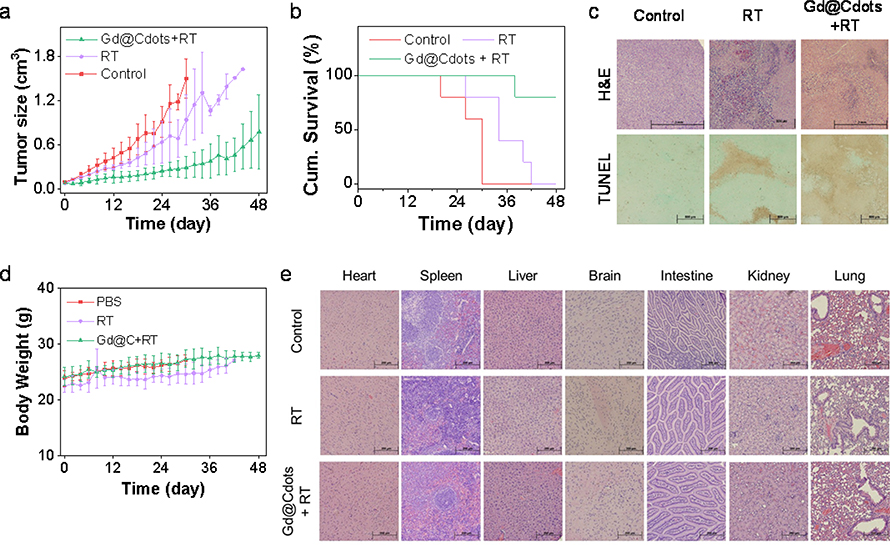
The benefits of Gd@Cdots for RT were further evaluated in vivo in a H1299 xenograft model. The animals were randomly divided to receive treatments by Gd@Cdots plus radiation (Gd@Cdots+RT), radiation only (RT), or PBS only (n = 5). For the Gd@Cdots+RT group, Gd@Cdots at 0.1 mmol·Gd/kg were i.v. injected, and X-ray (6 Gy) in a single beam was applied to tumors at 4 h, with the rest of the body lead-shielded. For the RT only group, the same radiation dose was applied. Relative to the PBS control, Gd@Cdots+RT led to a tumor inhibition rate (TIR) of 80.3% on Day 30 (Fig. 7a). By the end of the study (Day 48), 80% of the animals in the Gd@Cdots+RT group remained alive (Fig. 7b). As a comparison, RT showed a mediocre TIR of 37.2% on Day 30 (Fig. 7a), with all the animals reaching a humane endpoint by Day 42 (Fig. 7b). Post-mortem H&E and TUNEL staining found a reduced level of cancer cell density and an increased level of apoptosis in tumors taken from the Gd@Cdots+RT group (Fig. 7c), confirming the radiosensitizing effects of Gd@Cdots.
Figure 7.
In vivo therapy results, tested in a H1299 bearing xenograft model. The animals were treated with Gd@Cdots (0.1 mmol·Gd/kg) plus 6 Gy radiation (Gd@Cdots+RT), radiation only (RT), or PBS only (n = 5). (a) Tumor growth curves. *, p < 0.05. (b) Kaplan Meir survival curves. (c) Histology analysis of tumor samples. Both H&E and TUNEL assays were performed. Scale bars, 500 μm. (d) Body weight curves. No significant body weight drop was observed throughout the studies. (e) Histology analysis of major organ samples by H&E staining. Scale bars, 200 μm.
Meanwhile, no body weight drop was observed throughout the experiment for the Gd@Cdots+RT group (Fig. 7d). After euthanizing the animals, major organs, including the heart, spleen, liver, brain, intestine, kidneys, and lung, were harvested and analyzed by histology. H&E staining found no sign of toxicity in all tested organs (Fig. 7e). For better assessment of toxicity, in a separate study, Gd@Cdots (0.1 mmol/kg) were injected into healthy mice, and blood samples were collected on Day 14 for analysis. Complete blood count (CBC) and biochemistry analyses found no significant difference between the Gd@Cdots and PBS groups in all tested indices (Table S1). BUN and ALT levels were also in the normal ranges (Table S1), confirming low toxicity.
Conclusion
A number of studies have demonstrated radiosensitizing effects with gold, hafnium oxide, and gadolinium nanoparticles under KV and MV beams.1, 38–41 However, HZNPs are often associated with issues such as slow clearance and heavy metal toxicity. Unlike conventional HZNPs that are often made of a single-component metal or metal oxide, Gd@Cdots are a composite nanomaterial. Heavy metals, in this case Gd, are tightly intercalated into a carbon matrix; the latter serves as a low-toxic and biologically inert capsule that effectively prevents heavy metal leakage and toxicity. Meanwhile, carbon is electronically active, helping dissipate photoelectrons from high-Z centers to the surroundings. The surface catalytic effects of carbon also contribute to radical production under radiation. It is also worth mentioning that Gd@Cdots afford strong fluorescence and magnetic properties that allow them to be traced both macroscopically and microscopically. Indeed, our studies show that Gd@Cdots accumulation in tumors can be monitored by MRI (Fig. S8); this property may allow for image-guided radiation that improves radiation delivery accuracy. Overall, the composite nature is linked to a number of merits that improve the biocompatibility and radiosensitizing effects of Gd@Cdots. Moreover, because the photoelectric effects and surface effects depend on two components of the particle, each of which can be adjusted, it is possible to tune the composition of the particles to further enhance the radiosensitizing effects. For instance, it is possible to encapsulate other metals, including heavier elements such as Eu and Bi, into the carbon shell. It is also feasible to change carbon precursors, so that Gd@Cdots of different shell compositions and surface properties can be yielded; these changes may in turn affect the cellular uptake, biodistribution, and radiosensitizing effects of Gd@Cdots. One limitation is that the efficacy study was performed in a subcutaneous tumor model rather than more clinically relevant models. Also, dose escalation study was not conducted. These possibilities and limitations will be addressed in future experiments.
Supplementary Material
Acknowledgements
This work was supported by the National Science Foundation (CAREER grant no. NSF1552617 to J.X.), the National Institute of Biomedical Imaging and Bioengineering (grant no. R01EB022596 to J.X.), and the National Cancer Institute (grant no. R01CA247769 to J. X. and Z. L.). M.A.D. acknowledges support from the Air Force Office of Scientific Research grant no. FA-9550-15-1-0088. We thank the support by the National Institute of Dental and Craniofacial Research (R01DE028351 to Y. T.). This work was also supported by the National Center for Advancing Translational Sciences of the National Institutes of Health under Award number UL1TR002378. The content is solely the responsibility of the authors and does not necessarily represent the official views of the National Institutes of Health.
Footnotes
Conflicts of interest
There are no conflicts to declare.
Electron Supplementary Material
Supplementary material (an abbreviation list, CBC biochemistry results, Figure S1–S8, and Table S1) is available in the online version of this article.
References
- 1.Song G, Cheng L, Chao Y, Yang K and Liu Z, Adv. Mater, 2017, 29, 1700996. [DOI] [PubMed] [Google Scholar]
- 2.Hao Y, Altundal Y, Moreau M, Sajo E, Kumar R and Ngwa W, Phys. Med. Biol, 2015, 60, 7035–7043. [DOI] [PMC free article] [PubMed] [Google Scholar]
- 3.Kim D and Wang I, Med. Phys, 2012, 39, 3872. [DOI] [PubMed] [Google Scholar]
- 4.Bonvalot S, Le Pechoux C, De Baere T, Kantor G, Buy X, Stoeckle E, Terrier P, Sargos P, Coindre JM, Lassau N, Ait Sarkouh R, Dimitriu M, Borghi E, Levy L, Deutsch E and Soria JC, Clin. Cancer Res, 2017, 23, 908–917. [DOI] [PubMed] [Google Scholar]
- 5.Deng J, Xu S, Hu W, Xun X, Zheng L and Su M, Biomaterials, 2018, 154, 24–33. [DOI] [PubMed] [Google Scholar]
- 6.Detappe A, Thomas E, Tibbitt MW, Kunjachan S, Zavidij O, Parnandi N, Reznichenko E, Lux F, Tillement O and Berbeco R, Nano Lett, 2017, 17, 1733–1740. [DOI] [PMC free article] [PubMed] [Google Scholar]
- 7.Hainfeld JF, Dilmanian FA, Zhong Z, Slatkin DN, Kalef-Ezra JA and Smilowitz HM, Phys. Med. Biol, 2010, 55, 3045–3059. [DOI] [PubMed] [Google Scholar]
- 8.Li Y, Yun KH, Lee H, Goh SH, Suh YG and Choi Y, Biomaterials, 2019, 197, 12–19. [DOI] [PubMed] [Google Scholar]
- 9.Zhang M, Cui Z, Song R, Lv B, Tang Z, Meng X, Chen X, Zheng X, Zhang J, Yao Z and Bu W, Biomaterials, 2018, 155, 135–144. [DOI] [PubMed] [Google Scholar]
- 10.Changizi O, Khoei S, Mahdavian A, Shirvalilou S, Mahdavi SR and Rad JK, Photodiagn. Photodyn. Ther, 2020, 29, 101602. [DOI] [PubMed] [Google Scholar]
- 11.Saberi A, Shahbazi-Gahrouei D, Abbasian M, Fesharaki M, Baharlouei A and Arab-Bafrani Z, Int. J. Radiat. Biol, 2017, 93, 315–323. [DOI] [PubMed] [Google Scholar]
- 12.Bonvalot S, Rutkowski PL, Thariat J, Carrere S, Ducassou A, Sunyach MP, Agoston P, Hong A, Mervoyer A, Rastrelli M, Moreno V, Li RK, Tiangco B, Herraez AC, Gronchi A, Mangel L, Sy-Ortin T, Hohenberger P, de Baere T, Le Cesne A, Helfre S, Saada-Bouzid E, Borkowska A, Anghel R, Co A, Gebhart M, Kantor G, Montero A, Loong HH, Verges R, Lapeire L, Dema S, Kacso G, Austen L, Moureau-Zabotto L, Servois V, Wardelmann E, Terrier P, Lazar AJ, Bovee J, Le Pechoux C and Papai Z, Lancet Oncol, 2019, 20, 1148–1159. [DOI] [PubMed] [Google Scholar]
- 13.Rajaee A, Wang S, Zhao L, Wang D, Liu Y, Wang J and Ying K, Phys. Med. Biol, 2019, 64, 195007. [DOI] [PubMed] [Google Scholar]
- 14.Wu B, Lu ST, Yu H, Liao RF, Li H, Lucie Zafitatsimo BV, Li YS, Zhang Y, Zhu XL, Liu HG, Xu HB, Huang SW and Cheng Z, Biomaterials, 2018, 159, 37–47. [DOI] [PubMed] [Google Scholar]
- 15.Yong Y, Cheng X, Bao T, Zu M, Yan L, Yin W, Ge C, Wang D, Gu Z and Zhao Y, ACS Nano, 2015, 9, 12451–12463. [DOI] [PubMed] [Google Scholar]
- 16.Zang Y, Gong L, Mei L, Gu Z and Wang Q, ACS Appl. Mater. Interfaces, 2019, 11, 18942–18952. [DOI] [PubMed] [Google Scholar]
- 17.Kolosnjaj-Tabi J, Javed Y, Lartigue L, Volatron J, Elgrabli D, Marangon I, Pugliese G, Caron B, Figuerola A, Luciani N, Pellegrino T, Alloyeau D and Gazeau F, ACS Nano, 2015, 9, 7925–7939. [DOI] [PubMed] [Google Scholar]
- 18.Chen H, Qiu Y, Ding D, Lin H, Sun W, Wang GD, Huang W, Zhang W, Lee D, Liu G, Xie J and Chen X, Adv. Mater, 2018, 30, 1802748. [DOI] [PMC free article] [PubMed] [Google Scholar]
- 19.Chen H, Wang GD, Tang W, Todd T, Zhen Z, Tsang C, Hekmatyar K, Cowger T, Hubbard R, Zhang W, Stickney J, Shen B and Xie J, Adv. Mater, 2014, 26, 6761–6766. [DOI] [PMC free article] [PubMed] [Google Scholar]
- 20.He X, Luo Q, Zhang J, Chen P, Wang HJ, Luo K and Yu XQ, Nanoscale, 2019, 11, 12973–12982. [DOI] [PubMed] [Google Scholar]
- 21.Xu Y, Jia XH, Yin XB, He XW and Zhang YK, Anal. Chem, 2014, 86, 12122–12129. [DOI] [PubMed] [Google Scholar]
- 22.Schipper ML, Nakayama-Ratchford N, Davis CR, Kam NW, Chu P, Liu Z, Sun X, Dai H and Gambhir SS, Nat. Nanotechnol, 2008, 3, 216–221. [DOI] [PubMed] [Google Scholar]
- 23.Jemal A, Siegel R, Xu J and Ward E, CA Cancer J. Clin, 2010, 60, 277–300. [DOI] [PubMed] [Google Scholar]
- 24.Baker S, Dahele M, Lagerwaard FJ and Senan S, Radiat. Oncol, 2016, 11, 115. [DOI] [PMC free article] [PubMed] [Google Scholar]
- 25.Bradley JD, Paulus R, Komaki R, Masters G, Blumenschein G, Schild S, Bogart J, Hu C, Forster K, Magliocco A, Kavadi V, Garces YI, Narayan S, Iyengar P, Robinson C, Wynn RB, Koprowski C, Meng J, Beitler J, Gaur R, Curran W Jr. and Choy H, Lancet Oncol, 2015, 16, 187–199. [DOI] [PMC free article] [PubMed] [Google Scholar]
- 26.Luffer DR and Schram KH, Rapid Communications in Mass Spectrometry, 1990, 4, 552–556. [Google Scholar]
- 27.O’Brien SC, Heath JR, Curl RF and Smalley RE, J. Chem. Phys, 1988, 88, 220–230. [Google Scholar]
- 28.Chen H, Wang GD, Sun X, Todd T, Zhang F, Xie J and Shen B, Adv. Funct. Mater, 2016, 26, 3973–3982. [DOI] [PMC free article] [PubMed] [Google Scholar]
- 29.Javaid R and Qazi UY, Int. J. Environ. Res. Public Health, 2019, 16, 2066. [DOI] [PMC free article] [PubMed] [Google Scholar]
- 30.Ncube P, Bingwa N, Baloyi H and Meijboom R, Appl. Catal., A, 2015, 495, 63–71. [Google Scholar]
- 31.Sun L, Hu D, Zhang Z and Deng X, Int. J. Environ. Res. Public Health, 2019, 16, 4773. [DOI] [PMC free article] [PubMed] [Google Scholar]
- 32.Li S, Timoshkin IV, Maclean M, Macgregor SJ, Wilson MP, Given MJ, Wang T and Anderson JG, IEEE Trans. Dielectr. Electr. Insul, 2015, 22, 1856–1865. [Google Scholar]
- 33.Mason TJ, Lorimer JP, Bates DM and Zhao Y, Ultrason. Sonochem, 1994, 1, S91–S95. [Google Scholar]
- 34.Page SE, Arnold WA and McNeill K, J. Environ. Monit, 2010, 12, 1658–1665. [DOI] [PubMed] [Google Scholar]
- 35.Ragàs X, Jiménez-Banzo A, Sánchez-García D, Batllori X and Nonell S, Chem. Commun, 2009, 20, 2920–2922. [DOI] [PubMed] [Google Scholar]
- 36.Cheng G, Zielonka J, McAllister D, Hardy M, Ouari O, Joseph J, Dwinell MB and Kalyanaraman B, Cancer Lett, 2015, 365, 96–106. [DOI] [PMC free article] [PubMed] [Google Scholar]
- 37.Marrache S and Dhar S, Proc. Natl. Acad. Sci. U.S.A, 2012, 109, 16288–16293. [DOI] [PMC free article] [PubMed] [Google Scholar]
- 38.Retif P, Pinel S, Toussaint M, Frochot C, Chouikrat R, Bastogne T and Barberi-Heyob M, Theranostics, 2015, 5, 1030–1044. [DOI] [PMC free article] [PubMed] [Google Scholar]
- 39.Chithrani DB, Jelveh S, Jalali F, van Prooijen M, Allen C, Bristow RG, Hill RP and Jaffray DA, Radiat. Res, 2010, 173, 719–728. [DOI] [PubMed] [Google Scholar]
- 40.Rahman WN, Bishara N, Ackerly T, He CF, Jackson P, Wong C, Davidson R and Geso M, Nanomed. Nanotechnol. Biol. Med, 2009, 5, 136–142. [DOI] [PubMed] [Google Scholar]
- 41.Liu C-J, Wang C-H, Chen S-T, Chen H-H, Leng W-H, Chien C-C, Wang C-L, Kempson IM, Hwu Y and Lai T-C, Phys. Med. Biol, 2010, 55, 931. [DOI] [PubMed] [Google Scholar]
Associated Data
This section collects any data citations, data availability statements, or supplementary materials included in this article.


