Abstract
Optical mapping methods utilize fluorescence dyes to measure dynamic response of cardiac tissue such as changes in transmembrane potential (Vm). For the commonly used Vm sensitive dyes, a dye absorption and emission spectra shift as Vm changes. Signals relevant to Vm are calculated as a relative fluorescence change with respect to the fluorescence baseline. The amplitude of the change depends on the long-pass (LP) filter cut-on wavelength, placed on the sensor side, and the excitation wavelength. An excitation wavelength near the absorption peak, termed the isosbestic point, results in minimal absorption coefficient change as absorption spectra shifts. Consequentially the fluorescence intensity virtually does not change, when fluorescence across the entire emission spectra is measured, irrelevant of Vm changes. In this study we experimentally determined the isosbestic point for a near infrared dye Di-4-ANBDQPQ. We then present a theoretical study examining the dye linear or non-linear response as the fractional fluorescence change of Vm change, due to emission spectra shift and amplitude change, over a range of excitation wavelengths and LP filters. Linear “optical” response is important to quantify certain aspects of cardiac dynamics such as the action potential (AP) shape and duration, especially when studying drug effects and dynamical substrates for arrhythmia development.
Keywords: Optical mapping, isosbestic point, transmembrane voltage signal
1. Introduction
Since its first implementation dating to early seventies, optical mapping techniques have become indispensable research tool in cardiac physiology [1,2]. With its high spatial resolution replacing traditionally used microelectrode recording, optical mapping has made it possible to study and identify many spatiotemporal properties of cardiac dynamics [3,4]. Optical mapping studies have expanded our knowledge about arrhythmia initiation and sustainability, and differentiation between various mechanisms that can lead to deadly arrhythmias, such as tachycardia and fibrillation. Optical mapping has also been key in identifying Action Potential Duration (APD) Alternans [5], Action Potential Amplitude (APA) Alternans [6], and their role as substrates for reentrant arrhythmias. These alternations are not only confined to the field of cardiac physiology, but are also part of bigger and more general field of chaos theory and non-linear dynamics where general principles govern a dynamical system to chaos [7]. Optical mapping methods provide the ability to bridge the gap between non-linear dynamics theory and cardiac physiology allowing for many experimental observations to be explained with the well-defined and generalized theory. Therefore, optical mapping methods are valuable tools toward understating the underlying arrhythmia mechanisms, and recently, a tool for novel anti-arrhythmic drugs testing and development [8]. On the whole heart level, optical mapping methods are valuable tools to study heart responses to defibrillation shocks, the necessary tool for progress in defibrillation techniques, especially in the exciting novel research towards low-energy defibrillation [9, 10].
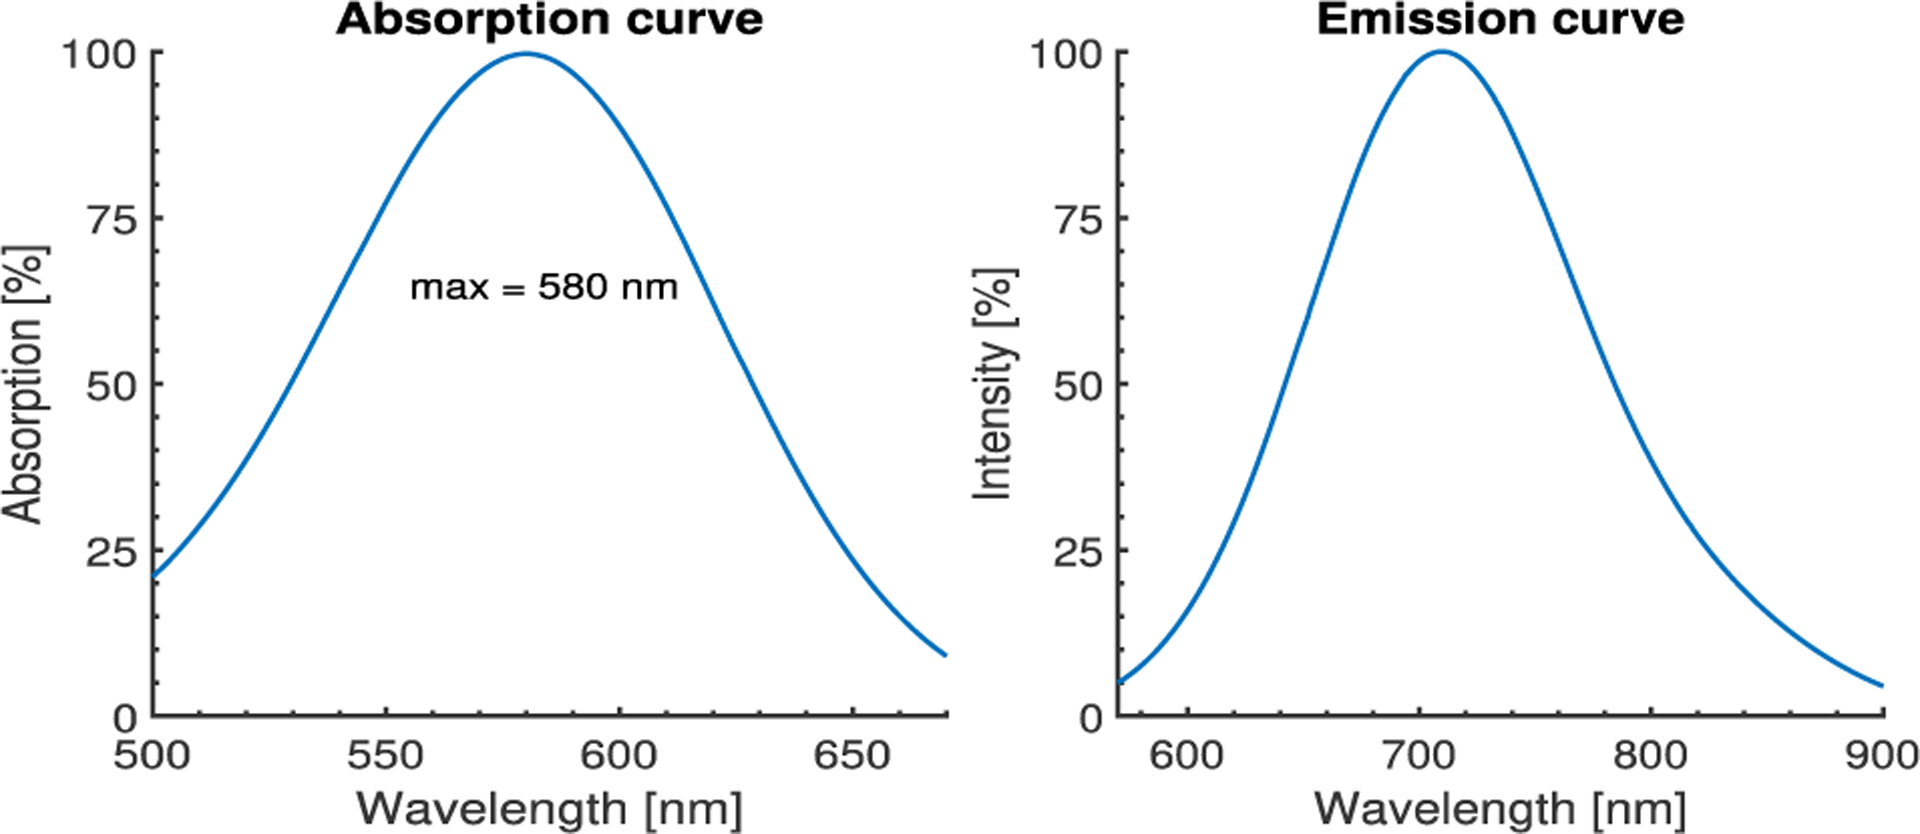
The most commonly used class of Vm sensitive dyes are electrochromic dyes where absorption and subsequently emission spectra (Figure 1) shift towards shorter wavelengths as a function of Vm change. When the LP filter is placed over the camera sensor, the emission spectra is partially blocked and spectral shift results in a fractional change of the fluorescence intensity. It is expected to be fairly linear response of the Vm change. This is the primary idea optical mapping methods are based on.
Figure 1.

Absorption and emission spectra from publicly available Di-4-ANNEPS data shifted to the absorption and emission maximums of Di-4-ANBDQPQ, 580 nm and 710 mn respectively. The absorption maximum was experimentally obtained, Table 1, while the maximum emission corresponds to the dye spectra in MLV [12].
Typically in optical mapping methods narrow spectral sources such as lasers or band-pass filtered LEDs are used, and excitation of an electrochromic dye can be modeled as excitation with a single wavelength. As the absorption spectra of any fluorescence dye resembles a bell-shaped curve, depending on which side of the curve the excitation wavelength is, the absorption spectra shift as the cell membrane depolarises, results in either positive or negative change of the absorption coefficient. The change directly affects the intensity of the emitted fluorescence spectra and modulates the fractional fluorescence change caused by the primary effect. Although these two effects can amplify the fractional fluorescence change, together they can introduce non-linear fractional change in response to Vm change. Since the change of the absorption coefficient can be positive or negative, continuity implies existence of a point (wavelength) at which the absorption coefficient for both polarized and depolarized cell membrane is unchanged. This point is called an isosbestic point [11]. The isosbestic point is independent of the actual optical setup and filters, and is solely a property of the particular electrochromic dye absorption spectra. The point is close to the absorption peak on the left side. When the absorption spectra shifts, the point will move over the peak to the same height on the right side of absorption spectra. Consequentially the total fluorescence intensity will not change as the cell membrane depolarizes [11]. In order to experimentally determine the isosbestic point, an entire emission spectrum needs to be collected to eliminate the primary effect outlined above. Figure 1 shows the absorption and emission spectra with no optical filter in the path of the emitted fluorescence.
2. Methods
The experimental setup has been published in details elsewhere [9]. All experimental procedures were approved by the office of Research Integrity Assurance of Georgia Tech under IACUC no. A15034. Briefly, New Zealand Rabbits hearts (n = 3) were excised and Langerdorff perfused. Hearts were stained with Di-4-ANBDQPQ dye, a relatively novel dye with large fractional response >10%. 0.4 mg of dye dissolved in Ethanol and recirculated twice with 200 mL of oxygenated Tyrode solution. Motion contraction was suppressed with Blebbistatin (3 – 5 uM). The illumination system PLUMBUS (Pulsed LUMinos Bimodal Uniform Source), provided by Aleksa Tech, consisted of high power, 120 W, green LED with the center wavelength at 525 nm (Luminus Devices) for voltage coupled with excitation 10 nm OD4 band-pass (BP) filters ranging from 500 to 595 nm (Edmund Optics). For each BP filter, sequence of images were recorded at 500 fps with EMCCD camera (Evolve 128) with four different OD6 LP filters placed on the camera side, LP575 (Chroma Technology), LP600, LP610 and LP620 (Omega Optical). Excluded are all overlapping pass-band combinations of BP and LP filters. To increase the signal to noise ratio, signal stacking was used [13]. For each BP-LP combination, the heart was paced at a constant cycle length of 400ms and sequence of images were recorded for 3 minutes. Signal were then stacked to lower the noise signal. This technique was especially needed when calculating ΔF/F values close to zero.
3. Results
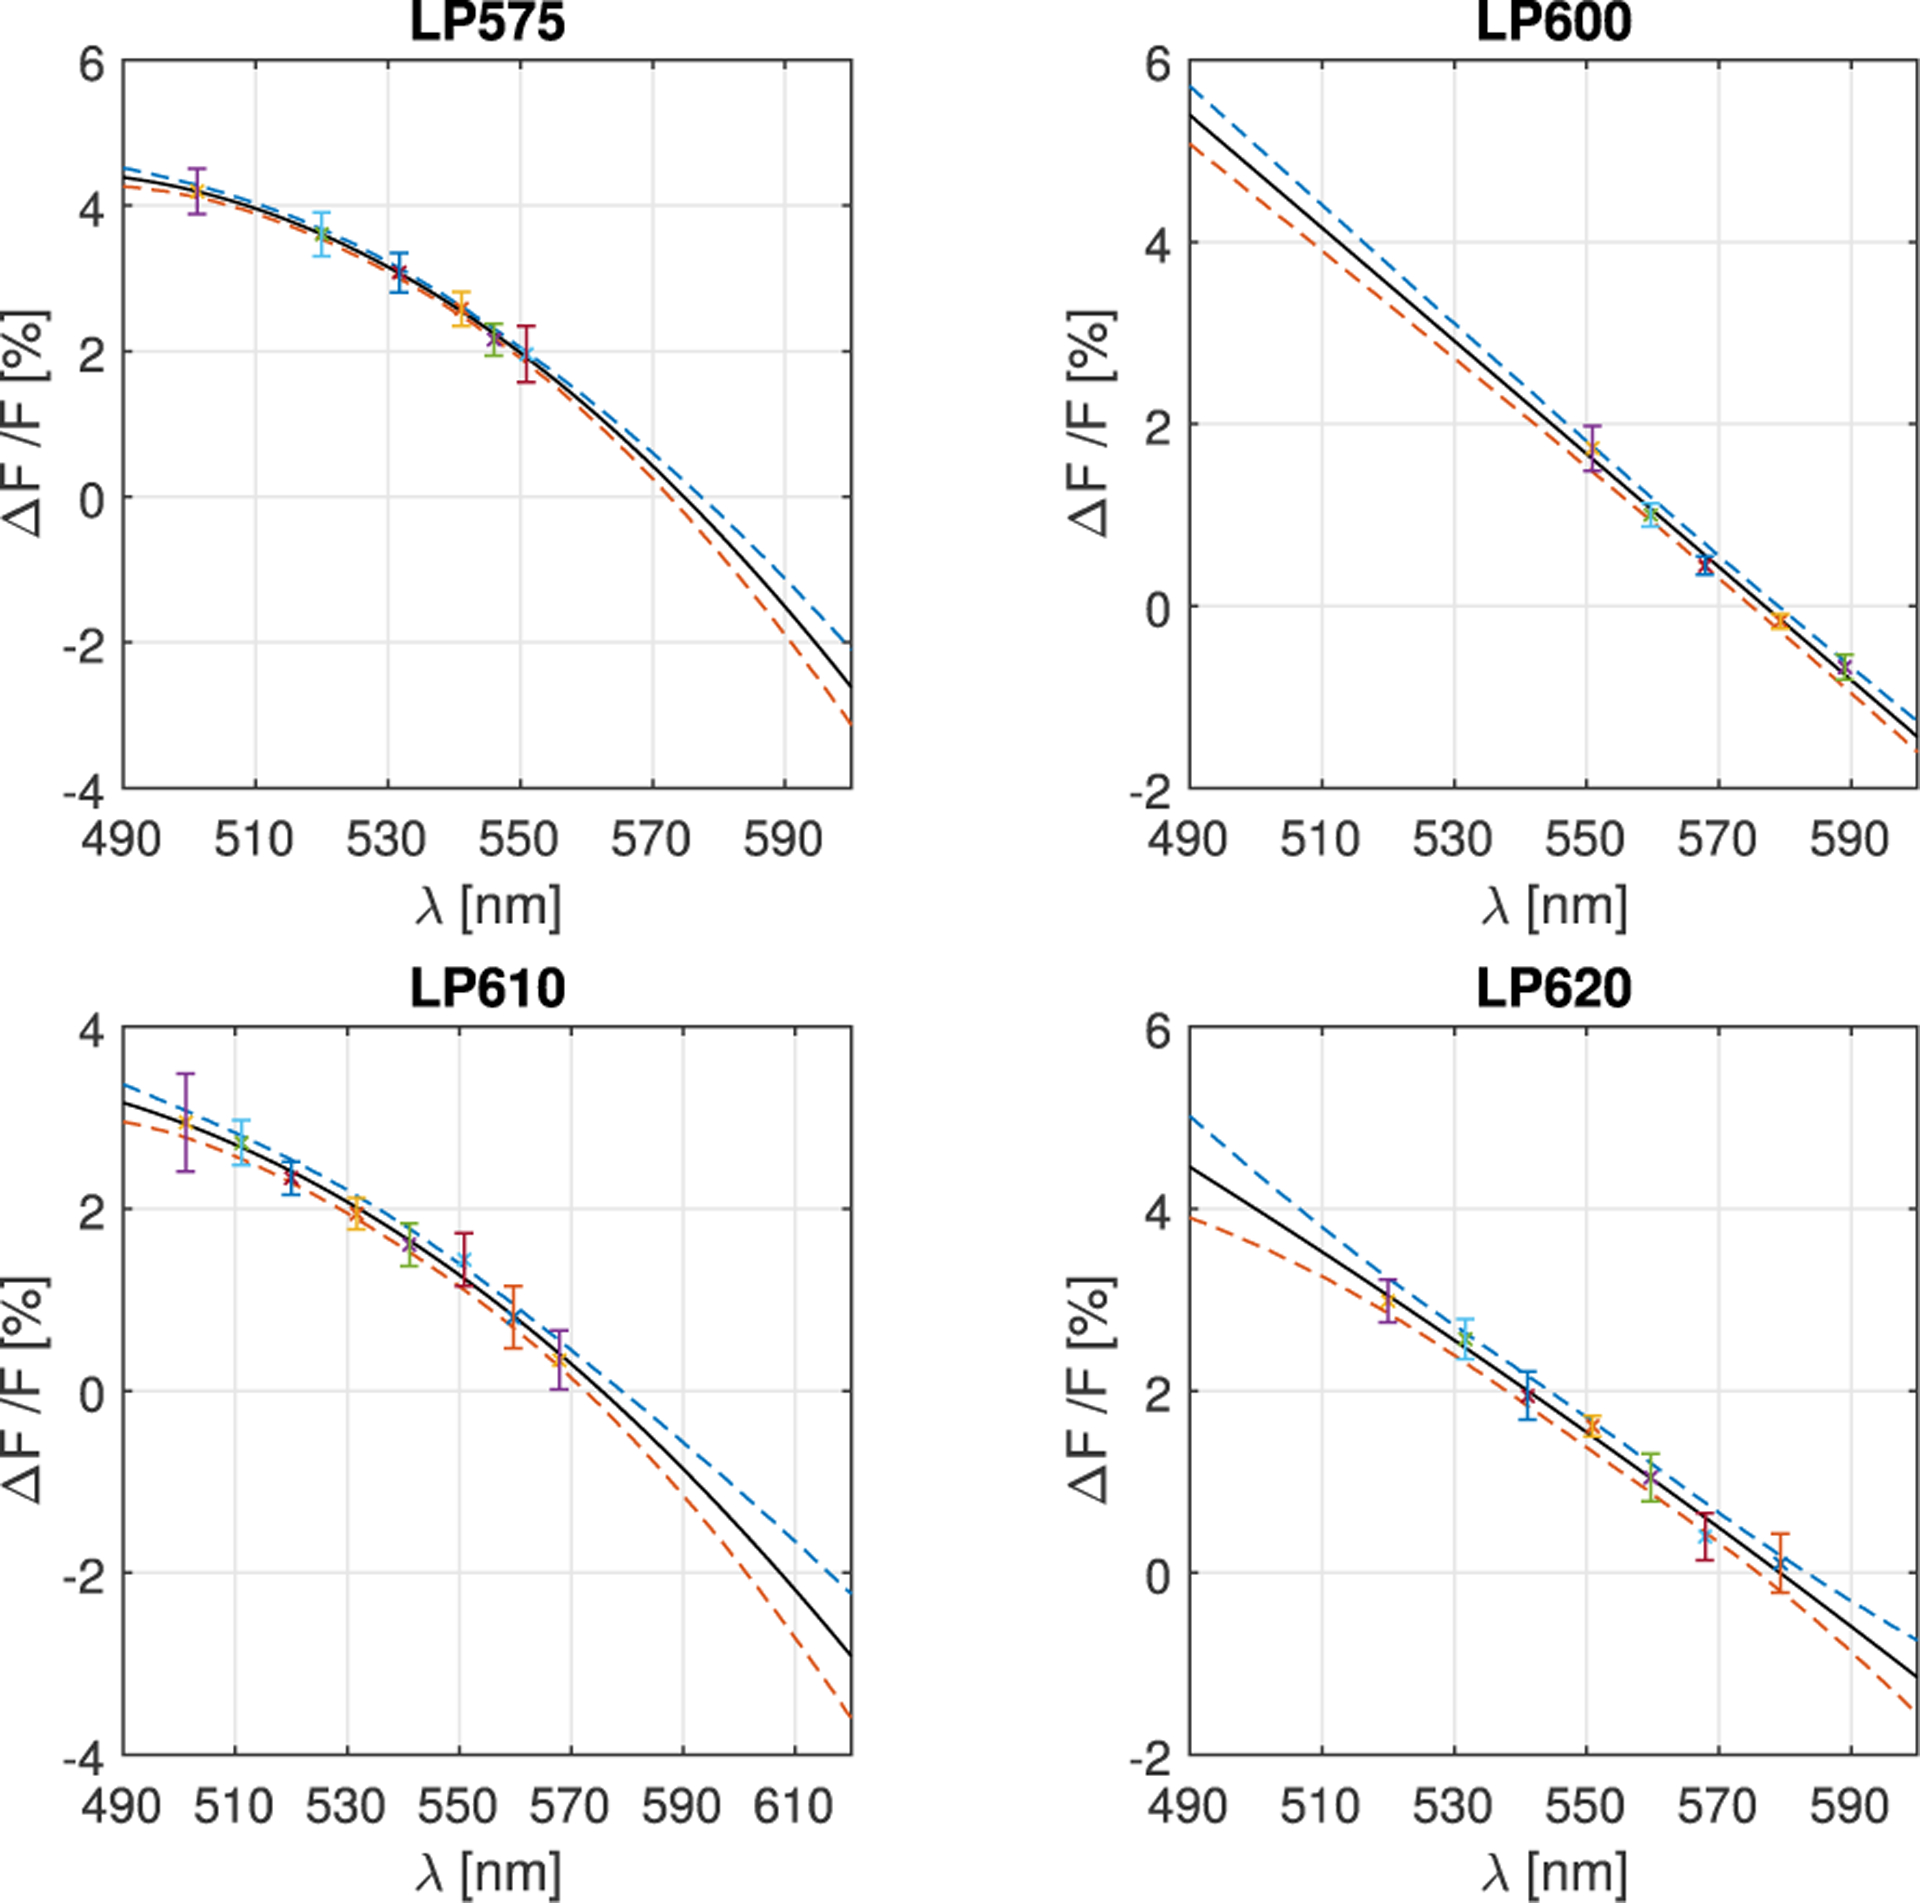
For each BP-LP filter combination, the fractional change of emitted fluorescence (DF/F) was calculated for each pixel as described in the Section 2. The combined results from 3 rabbit hearts are shown in Figure 2, and the excitation wavelength for zero signal change (ΔF/F = 0) was obtained, Table 1. When fluorescence across the entire emission spectra is recorded, the excitation point at which the emission spectra is only shifted (with no rescale in magnitude) corresponds to the isosbestic point [11]. The point is determined experimentally as excitation wavelength that does not change, resulting in ΔF/F = 0, for LP filters of different cut-on wavelengths, implying that the entire emission spectra range is passed through. Therefore, if all the emission spectra range is recorded (LP < 600nm, Figure 1b) it means that excitation at isosbestic point implies ΔF/F=0. The fact that zeros in Table 1 converge to a value for LP < 600nm implies that all the light from the emission spectra was recorded.
Figure 2.

Relative changes of emitted fluorescence for four different LP filters of 575 nm, 600 nm, 610 nm and 620 nm for different excitation filters calculated as averages across all pixels. Quadratic polynomial fit curves are presented with 95% confidence interval range. Zero crossings correspond to the isosbestic point.
Table 1.
Isosbestic point values.
| LP575 | LP600 | LP610 | LP620 |
|---|---|---|---|
| 578 ± 6 nm | 577 ± 5 nm | 578 ± 4 nm | 579 ± 3 nm |
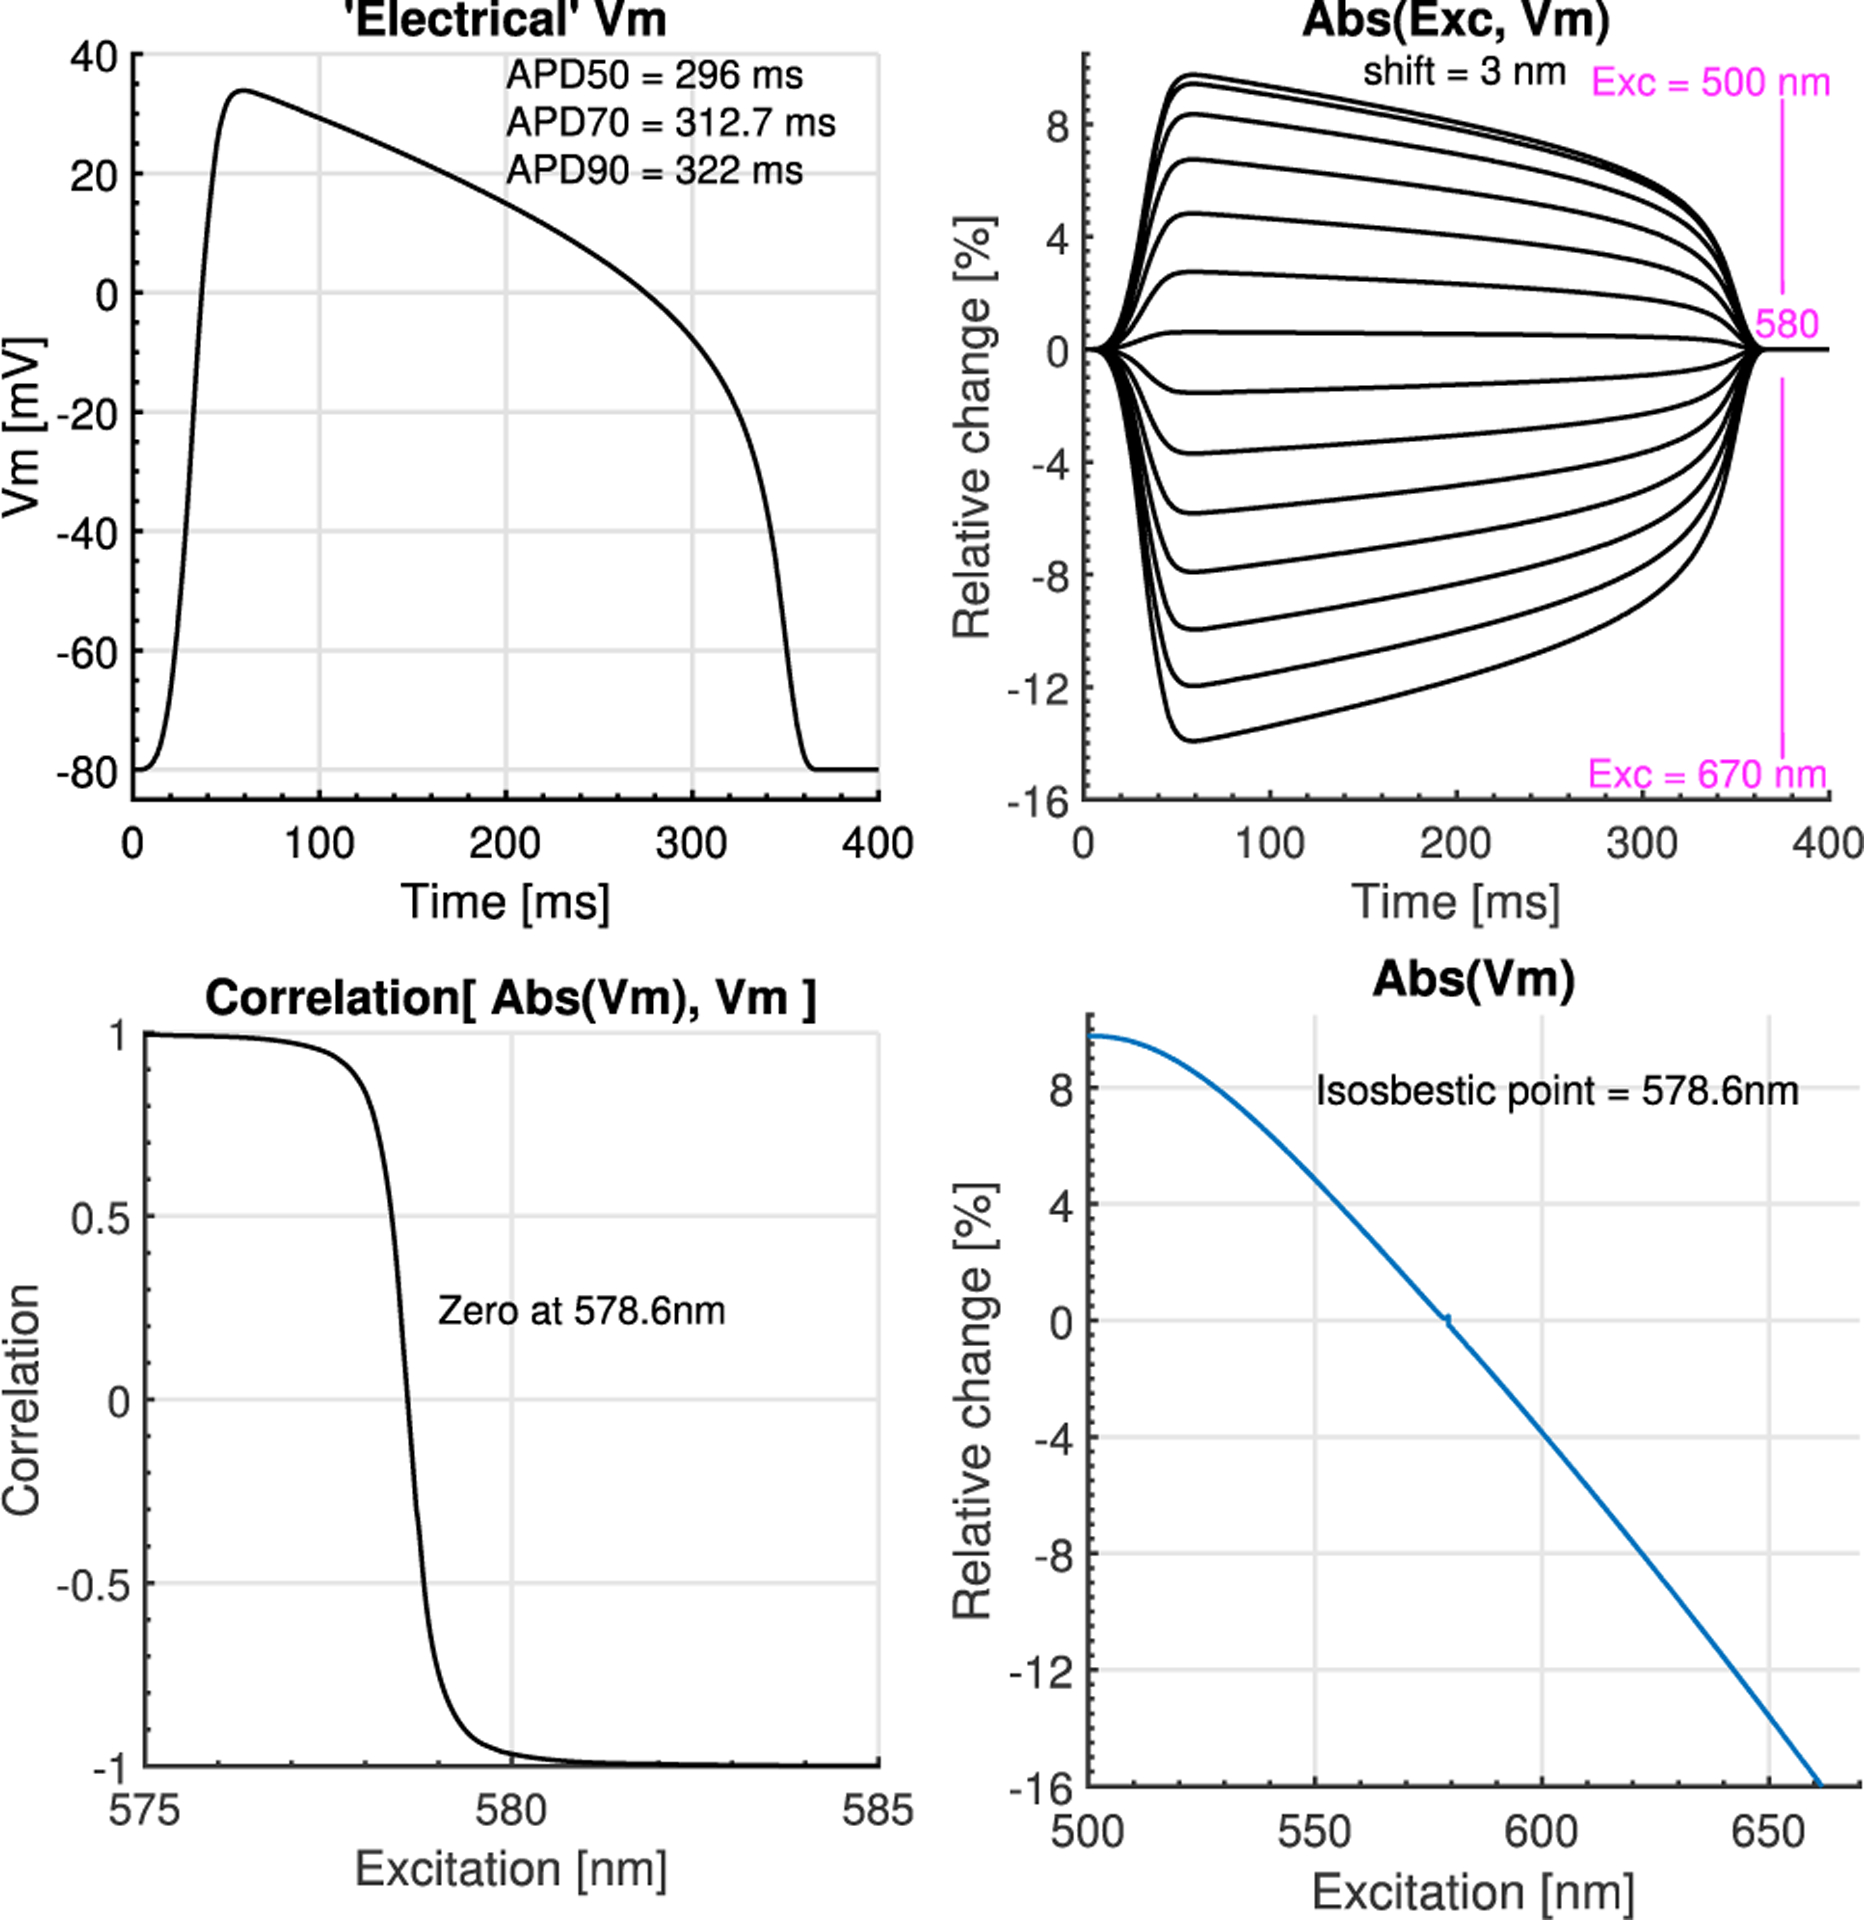
Using double Gaussian fits to the absorption and emission curves in Figure 1, we then calculated the absorption change due to an AP change (Figure 3), Abs(Exc, Vm), causing the spectral shift of 3 nm, for different excitation wavelengths. The correlation between the shape of Abs(Exc, Vm) and the Electrical’ Vm is very linear except for values very close to the isosbestic point, where the fractional change diminished to zero, Figure 3D, and the figure shows the theoretical values that the absorption spectra will increase/decrease as a function of excitation wavelength.
Figure 3.

Primary effect on absorption spectra. A) Micro-electrode ‘electrical’ Vm from rabbit ventricles used for the theoretical calculations. B) Absorption coefficient change calculated as Abs(Excitation wavelength + k*Vm), where k*Vm is the the shift caused by Vm change, max(k*Vm) = 3 nm. C) Correlation between Abs(Vm) vs ‘Electrical’ Vm for each excitation wavelength. Correlation coefficients other than 1 and −1 indicate, non-linear Abs(Vm) response with zero correlation at the isosbestic point. D) Theoretical calculation of the increase/decrease in scaling of the absorption coefficient at each excitation wavelength. The isosbestic point is the excitation wavelength at which the absorption coefficient does not change as Vm changes.
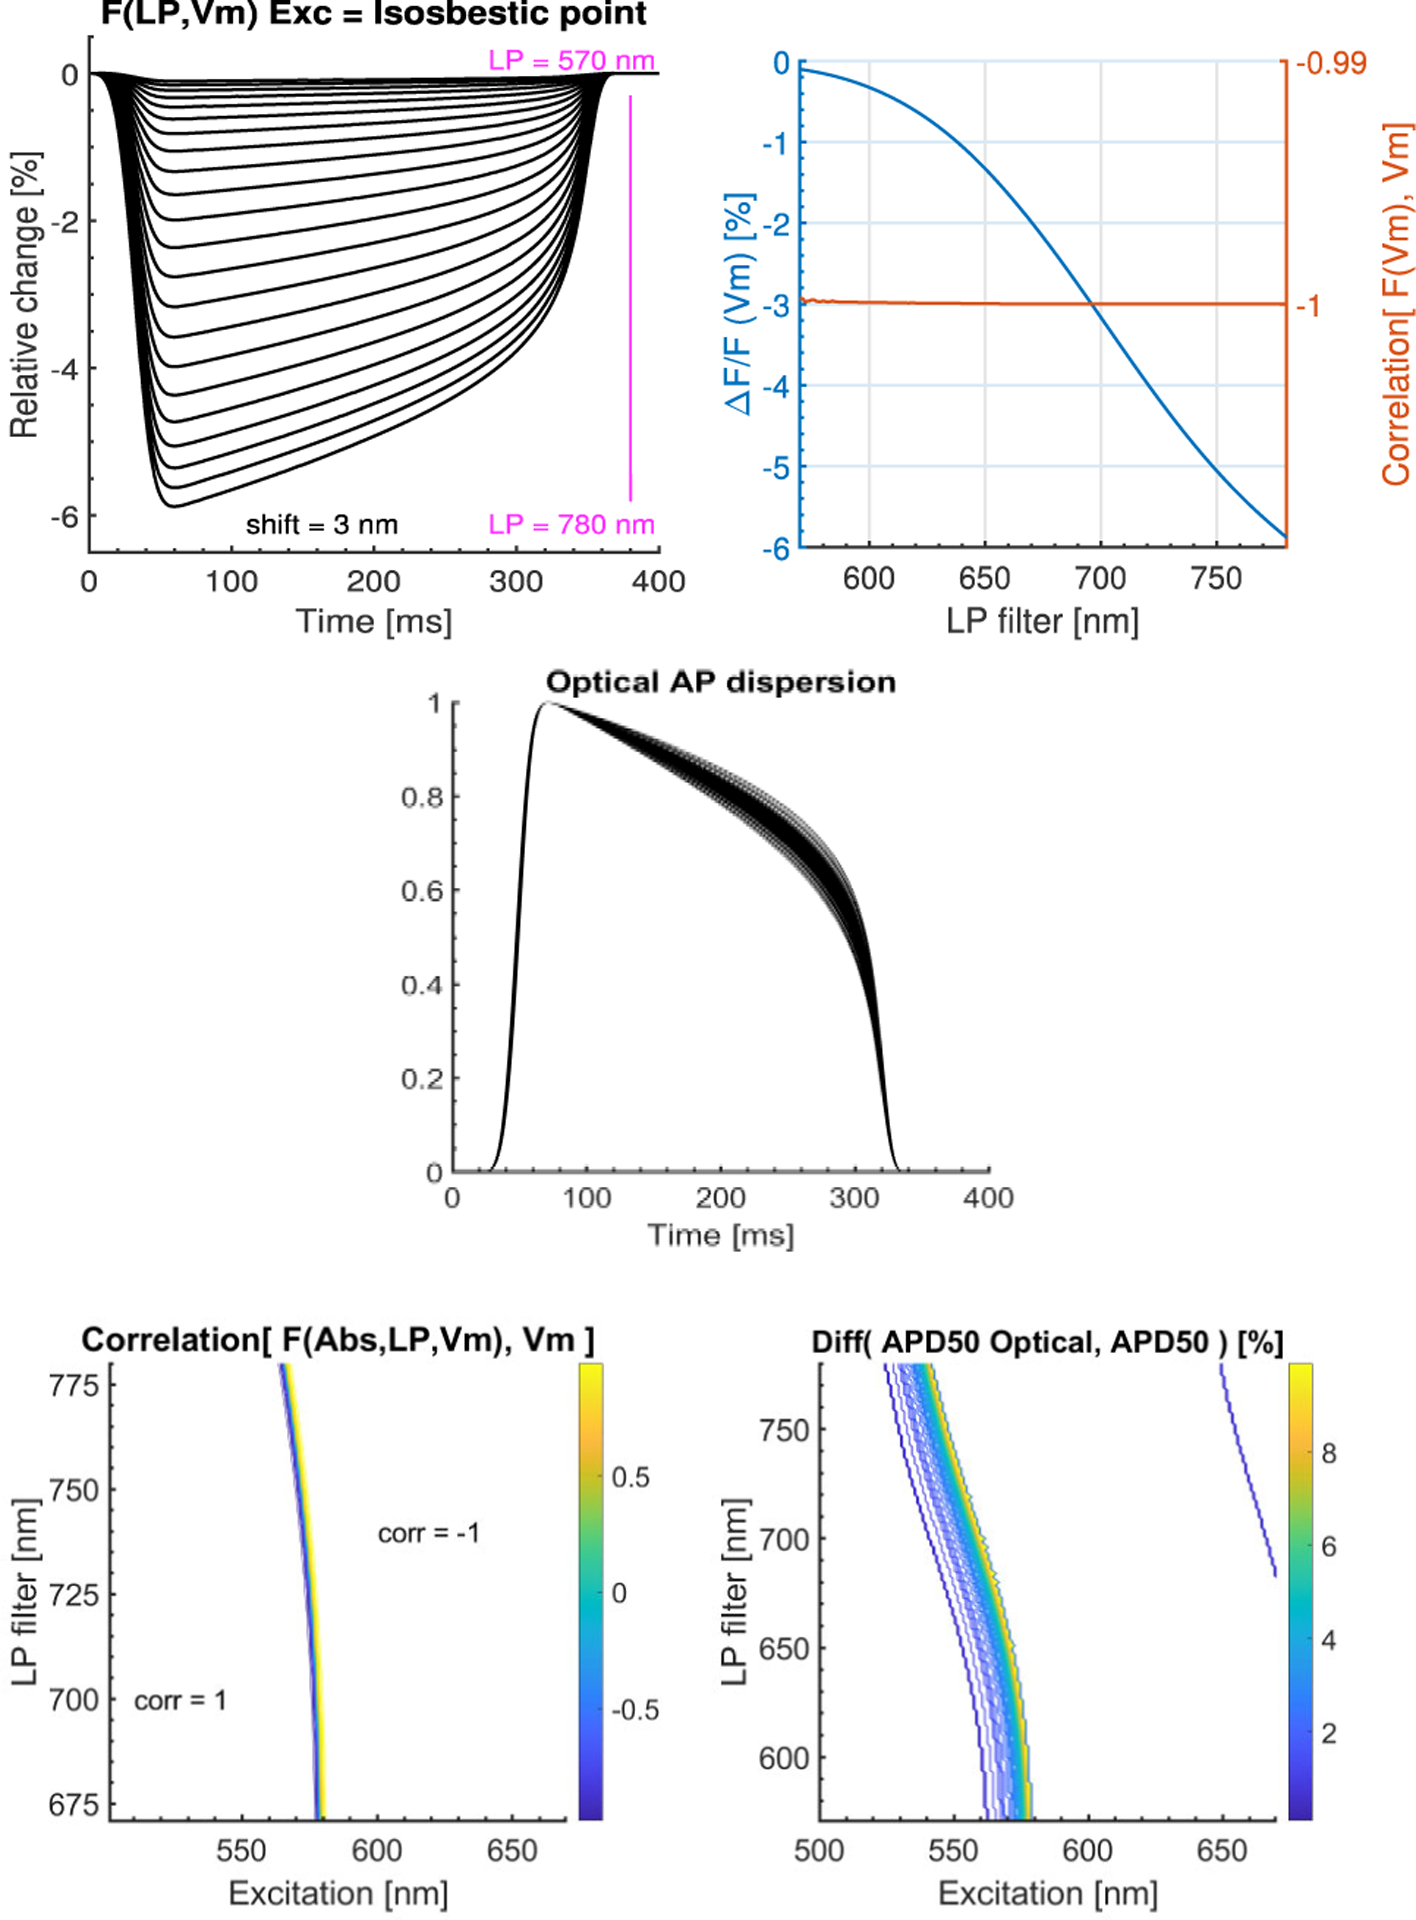
Figure 4 (Upper) shows the theoretically calculated emission changes generated by Vm changes using the isosbestic point as excitation wavelength for different LP filters. For all LP values up to the upper maximally “practical” LP value, calculated “optical” Vm is fully correlated with “electrical” Vm.(Lower) Colored regions on the maps indicate non-linear distortion with secondary effect accounted (emission amplitude modulation).
Figure 4.

(Upper) Excitation at the isosbestic point for different LP filters (primary effect), Ems = Ems(LP + k* Vm), integrated from each LP filter value to 900 nm. The fractional change is negative. ‘Optical’ Vm is fully correlated with ‘Electrical’ Vm for any LP. (Middle, lower) Primary and secondary effects, Ems(Exc, LP, VTO). Optical AP dispersion: normalized ‘optical’ APs for range of excitation wavelengths and LP filters. The correlation map shows a region for correlation < 0.99. Relative differences > 1 % between ‘optical’ APD50% and the ‘Electrical’ APD50%.
4. Discussion
For an excitation wavelength other than the isosbestic point, the absorption coefficient changes due to the absorption spectrum shift, which in turns modulates the emission spectra amplitude curve which also shifts due to primary effect. For excitation wavelengths lower than the isosbestic point, absorption coefficient increases during cell membrane depolarization, which results in increase in the total emitted fluorescence. For excitation wavelengths, higher than of the isosbestic point absorption coefficient will decrease which results in decrease in the total emitted fluorescence. To date, there is no published absorption curve of the Di-4-ANBDQPQ transmembrane voltage sensitive dye on cardiac tissue, and spectra obtained in ethanol and MLVs vastly differ [12]. We therefore experimentally measured the isosbestic point (577 ± 4 nm) and approximated the maximum absorption spectra at 580 nm, no more than 3 nm right of the isosbestic point. We used the published absorption and emission curves of Di-4ANNEPS dye, centering absorption curve at 580 nm and emission at 710 nm. The updated curves were used to theoretically investigate the nonlinear effects of Di-4-ANBDQPQ dye in response to Vm change.
5. Conclusions
In this study we have outlined importance of the isosbestic point as the ideal excitation point for which the fractional change of emitted fluorescence will not be modulated with changing absorption effects. The isosbestic point was determined experimentally of a novel near-infrared Di-4-ANBDQPQ Vm dye which surpasses in its performance as a gold standard Di-4-ANNEPS dye. The dye is widely accepted by many research groups and we aim that this study will be helpful for method requiring linear fractional change in response to cell membrane potential change. Our results suggest that if the isosbestic point is used for this dye, LP filters greater than 700 nm should be used. This study does not take into account the averaging in optical mapping from neighboring cells[14,15], and any non-uniform attenuation of emitted wavelengths passing through optical medium before the sensor, but the main principles and results should hold.
Acknowledgments
We acknowledge suport from NSF# 1762553 and NIH #1R01HL143450-01.
References
- [1].Salama G, Morad M. Merocyanine 540 as an optical probe of transmembrane electrical activity in the heart. Science 1976;191(4226):485–487. [DOI] [PubMed] [Google Scholar]
- [2].Efimov IR, Nikolski VP, Salama G. Optical imaging of the heart. Circulation research 2004;95(1):21–33. [DOI] [PubMed] [Google Scholar]
- [3].Pertsov AM, Davidenko JM, Salomonsz R, Baxter WT, Jalife J. Spiral waves of excitation underlie reentrant activity in isolated cardiac muscle. Circulation research 1993; 72(3):631–650. [DOI] [PubMed] [Google Scholar]
- [4].Cherry EM, Fenton FH. Visualization of spiral and scroll waves in simulated and experimental cardiac tissue. New Journal of Physics 2008; 10(12): 125016. [Google Scholar]
- [5].Pastore JM, Girouard SD, Laurita KR, Akar FG, Rosenbaum DS. Mechanism linking t-wave alternans to the genesis of cardiac fibrillation. Circulation 1999;99(10):1385–1394. [DOI] [PubMed] [Google Scholar]
- [6].Chen DD, Gray RA, Uzelac I, Herndon C, Fenton FH. Mechanism for amplitude alternans in electrocardiograms and the initiation of spatiotemporal chaos. Physical review letters 2017;118(16): 168101. [DOI] [PubMed] [Google Scholar]
- [7].Fenton FH, Cherry EM, Glass L. Cardiac arrhythmia. Scholarpedia 2008;3(7):1665. [Google Scholar]
- [8].Emilia Entcheva (Washington DUKAAVU. Automated system for high-throughput all-optical dynamic electrophysiology May 2019;(Patent 20190137398).
- [9].Fenton FH, Luther S, Cherry EM, Otani NF, Krinsky V, Pumir A, Bodenschatz E, Gilmour RF. Termination of atrial fibrillation using pulsed low-energy far-field stimulation. Circulation 2009;120(6):467–476. [DOI] [PMC free article] [PubMed] [Google Scholar]
- [10].Li W, Janardhan AH, Fedorov W, Sha Q, Schuessler RB, Efimov IR. Low-energy multistage atrial defibrillation therapy terminates atrial fibrillation with less energy than a single shock. Circulation Arrhythmia and Electrophysiology 2011;4(6):917–925. [DOI] [PMC free article] [PubMed] [Google Scholar]
- [11].Bachtel AD, Gray RA, Stohlman JM, Bourgeois EB, Pollard AE, Rogers JM. A novel approach to dual excitation ratiometric optical mapping of cardiac action potentials with di-4-anepps using pulsed led excitation. IEEE Transactions on Biomedical Engineering 2011;58(7):2120–2126. [DOI] [PMC free article] [PubMed] [Google Scholar]
- [12].Pertsov AM, Matiukas A, Loew LM, Wuskell JP. Composition, method, system and kit for optical electrophysiology, May 2 2017. US Patent 9,636,424. [Google Scholar]
- [13].Uzelac I, Ji YC, Hornung D, Schröder-Scheteling J, Luther S, Gray RA, Cherry EM, Fenton FH. Simultaneous quantification of spatially discordant alternans in voltage and intracellular calcium in langendorff-perfused rabbit hearts and inconsistencies with models of cardiac action potentials and ca transients. Frontiers in physiology 2017;8:819. [DOI] [PMC free article] [PubMed] [Google Scholar]
- [14].Janks DL, Roth BJ. Averaging over depth during optical mapping of unipolar stimulation. IEEE transactions on biomedical engineering 2002;49(9): 1051–1054. [DOI] [PubMed] [Google Scholar]
- [15].Hyatt CJ, Mironov SF, Wellner M, Berenfeld O, Popp AK, Weitz DA, Jalife J, Pertsov AM. Synthesis of voltage-sensitive fluorescence signals from three-dimensional myocardial activation patterns. Biophysical journal 2003; 85(4):2673–2683. [DOI] [PMC free article] [PubMed] [Google Scholar]


