Abstract
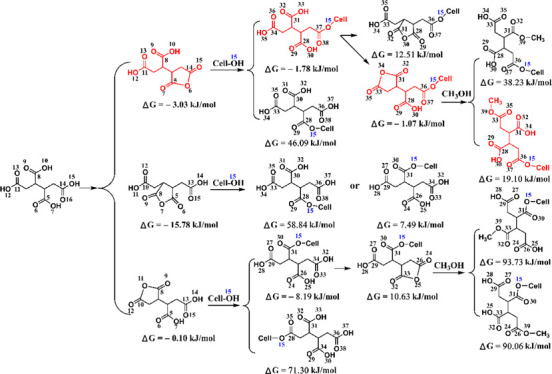
The modification of cellulose with polycarboxylic acid is an important technology to functionalize the substrate. 1,2,3,4-Butanetetracarboxylic acid (BTCA) can significantly improve the anti-wrinkle performance of treated cotton fabrics by cross-linking with cellulose. However, the reaction site of BTCA carboxyl and the cellulose hydroxyl has not yet been clarified, which hinders the in-depth understanding about the reaction mechanism and the development of new cross-linking reagents. This study combines Fourier transform infrared and two-dimensional correlation spectroscopy to try to make it clear. Results confirmed that BTCA anhydride is an active intermediate (corresponding to the generally accepted theory) to esterify with cellulose hydroxyl, especially the O(6)–H(6) and O(2)–H(2). Cellobiose was taken as a model of cellulose to react with BTCA at variable temperatures, proving the above conclusion. In addition, the C14- or C11-containing carboxyl of BTCA showed a higher reactivity. Based on calculating reaction kinetics and thermodynamics with Gaussian 09W software, the most likely reaction route between BTCA and cellulose was as follows: BTCA → BTCA C5C14 anhydride → C14O15 ester → C14O15 ester C31C34 anhydride → C14O15C33O ester.
1. Introduction
Cotton, one kind of cellulose-based material, is the most abundant natural substance on the earth.1 Regardless of the advantages of good moisture absorption, comfort, warmth retention, and biocompatibility of cotton fabrics, they are easy to wrinkle, shrink, and burn, which restricts their applications. Formaldehyde-based chemicals, especially dimethyldihydroxycycloethylene urea, are still the popular anti-wrinkle finishing (AWF) reagents for cotton fabrics.2,3 However, due to the formaldehyde release problem of the treated fabrics, researchers have been making efforts to develop non-formaldehyde compounds as the AWF reagents for cotton fabrics, such as dialdehyde or polyaldehyde,4,5 polyacrylate,6 ionic cross-linking agents,7,8 alpha-lipoic acid,9 chitosan,10,11 waterborne polyurethane acrylate,12 and polycarboxylic acid (PCA).13−16 Among them, PCA shows an outstanding performance. In addition, PCA is also employed for modifying other functions of cotton fabrics, such as flame-retardant finishing,17,18 carboxyl modification of adsorbents for wastewater treatment,19,20 and so on. Therefore, PCA is an important kind of compound to be studied in the textile field. Specially, among PCAs, 1,2,3,4-butanetetracarboxylic acid (BTCA) shows a remarkable effect in the AWF and improving the resilience of cotton fabrics,21,22 and the wrinkle recovery angle reaches about 250°. However, BTCA also causes significant damage to the fabrics treated in a low pH solution and cured at a high temperature,21,22 which is a big obstacle to its large-scale application.
According to the generally accepted theory, BTCA should form an active intermediate of anhydride before esterifying with cellulose,13,23 namely a two-step reaction. However, elucidating the reaction site of BTCA carboxyl remains an open question. Not all the four carboxyl groups of BTCA can cross-link with cellulose due to the reactivity difference, steric hindrance, and two-step reaction mechanism. A competitive relationship exists between the cross-linking and the acid degradation of cellulose with BTCA.21,24 As a result, many residual carboxyl groups are kept on the treated fabrics after curing and washing.24,25 Clarifying the reaction site of BTCA carboxyl will benefit the understanding of the reaction mechanism of cellulose and BTCA and develop novel cross-linking reagents for the AWF of cotton fabrics.
Fourier transform infrared (FTIR) spectroscopy is a good technique to investigate the reaction mechanism concerning functional groups. However, the carboxyl carbonyl of BTCA and the ester bond formed between BTCA and cellulose also show overlapping peaks in the normal FTIR spectrum.23,25 Two-dimensional infrared spectroscopy, which was first proposed by Noda in 1989,26 is a powerful tool for analyzing the molecular-level reactions due to its high resolution and accuracy in determining the changing of functional groups. It can characterize the transition point of phase-change materials,27 the molecule diffusion in polymers,28,29 and the change order of groups under the external disturbance.30 In previous research studies,31,32 the two-step reaction mechanism of PCA with cellulose (PCA anhydride forms first and then the anhydride esterifies with cellulose) was also confirmed by two-dimensional correlation spectroscopy (2Dcos) combined with FTIR. Unfortunately, the reaction site of BTCA carboxyl groups has not yet been elucidated.
In this study, we focused on determining the reaction sites of BTCA carboxyl and cellulose hydroxyl during their esterification reaction. The temperature-dependent FTIR spectra were collected first, and then, 2Dcos analysis was conducted. To simplify the process and make the analysis more accurate, cellobiose was employed as a model of cellulose. Besides, theoretical calculations and analysis were carried out with Gaussian 09W software package and GaussianView software.
2. Results and Discussion
2.1. Effect of Temperature on the Absorbance
FTIR spectra of the BTCA-treated fabric heated from 80 to 210 °C are shown in Figure 1. At 140 °C, the absorbance at 3220 cm–1 decreased dramatically due to the hydroxyl in the amorphous region of cellulose (Figure 1a). In contrast, the absorbance at 1700 cm–1 (Figure 1b) or 1127 cm–1 (Figure 1c) always increased with temperature rising and showed a significant increase at 140 °C, which can be attributed to the esterification of BTCA with cellulose.
Figure 1.
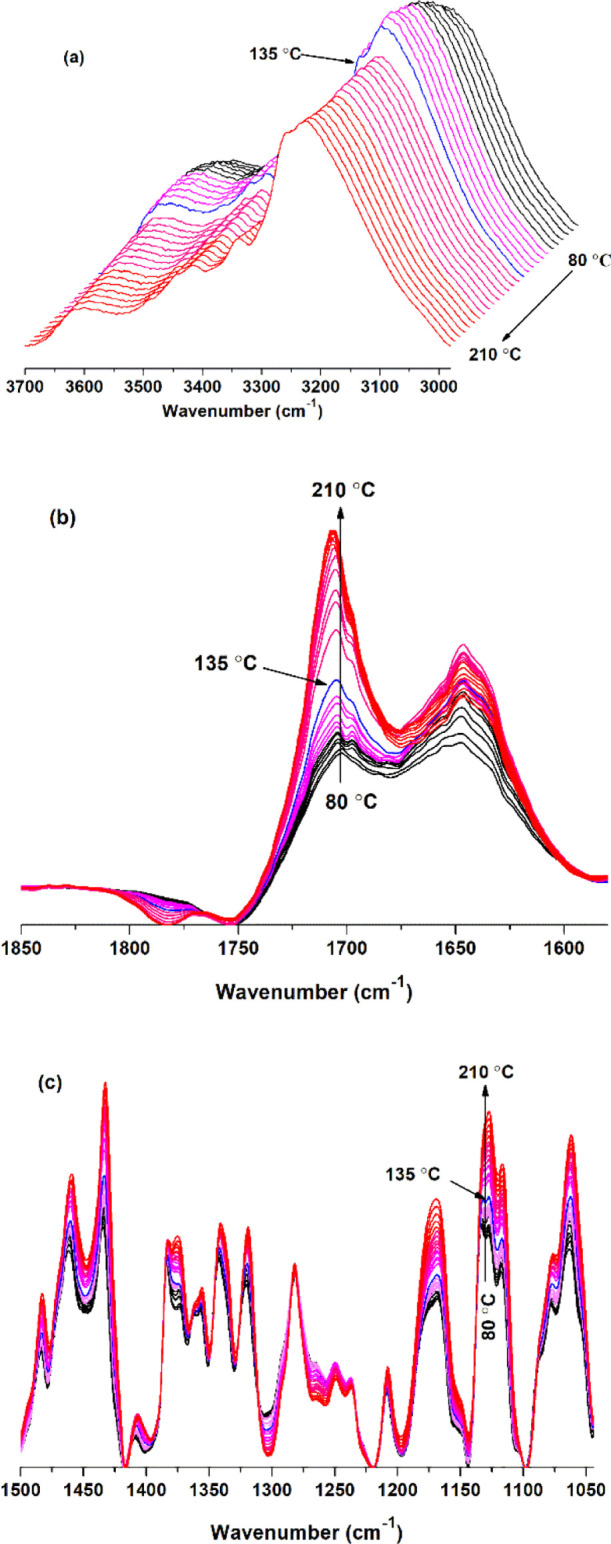
FTIR spectra of the BTCA-treated fabric at different temperatures: (a) 3700–2980; (b) 1850–1580; and (c) 1500–1044 cm–1.
To quantify the change of hydroxyl absorbance with increasing temperature, the peak intensities were summarized (Figure 2). The tentative assignment of peaks is shown in Table S1 (see Supporting Information). For different kinds of hydroxyls (Figure 2a–e), they all increase first and then decrease as temperature rises. This can be attributed to that at the early stage, the water molecules absorbed into cellulose evaporated, which was responsible for the absorbance increase of cellulose hydroxyl. Then, the esterification between BTCA and cellulose resulted in the decrease in absorbance. The peak intensity at 3220 cm–1 (Figure 2e) and the peak area between 3700 and 2980 cm–1 (Figure 2f) presented a similar changing trend, which showed a sudden drop when the temperature increased from 135–140 °C.
Figure 2.
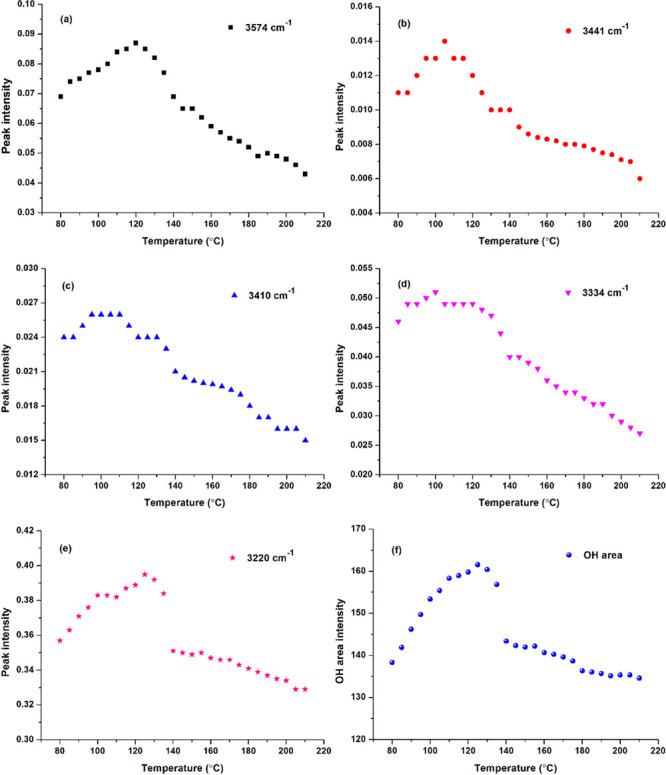
Temperature-dependent peak intensity of (a) 3574; (b) 3441; (c) 3410; (d) 3334; (e) 3220 cm–1; and (f) OH area of hydroxyl absorbance between 3700 and 2980 cm–1 of the BTCA-treated fabric.
It is important to analyze the effect of temperature on the esterification between BTCA carboxyl and cellulose hydroxyl. Figure 3a shows that the absorbance of carbonyl at 1777 cm–1 starts to appear at 100 °C, indicating the formation of BTCA anhydride,32 and it reaches the maximum at 170 °C. At temperatures below 100 °C, an absorbance at 1704 cm–1 (Figure 3b) can also be found, owing to the carbonyl stretching vibration of BTCA carboxyl. It further increases with temperature rising due to the ester bonds forming between BTCA and cellulose. Especially, the intensity shows a big increase from 135 to 140 °C, close to the 132 °C reported by Hou.32 Different from the abovementioned bands, the absorbance at 1697 cm–1 attributed to the carboxyl carbonyl of BTCA changes irregularly as the temperature increases (Figure 3c). The reason may be that during the esterification between BTCA and cellulose, the hydrogen bonds, between carboxyl and carboxyl, carboxyl and cellulose hydroxyl, and carboxyl and water molecules, will undergo a series of changes of formation, cleavage, or both.
Figure 3.
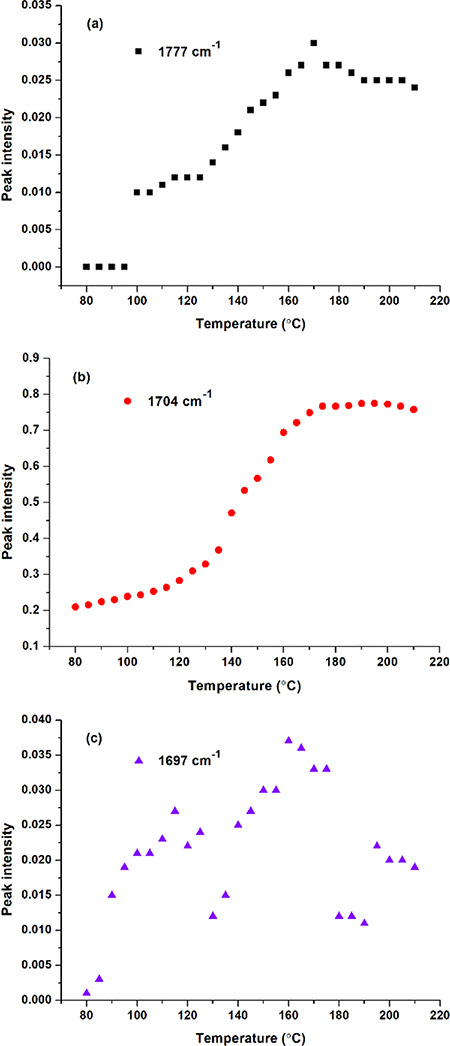
Carbonyl intensity of the BTCA-treated fabric at different temperatures: (a) 1777; (b) 1704; and (c) 1697 cm–1.
2.2. Reaction Site of Cellulose Hydroxyl
Figure 2 shows the absorbance change of cellulose hydroxyl with increasing temperature. However, analyzing the reaction site of cellulose hydroxyl is still difficult, which is a key point to understand the reaction mechanism of PCA with cellulose. Therefore, we try to clarify it in the following. According to the generally accepted reaction mechanism, BTCA should first form an anhydride, and then, the anhydride esterifies with a cellulose hydroxyl.13,16 The results in Figure 3a indicate that the reaction process can be totally divided into two stages: the first stage at temperatures lower than 100 °C mainly deals with the moisture volatilization of the fabric; the second stage at temperatures higher than 100 °C is mainly related to the anhydride formation of BTCA and esterification between BTCA and cellulose. Therefore, the second stage is the focus to be discussed next.
Figure 4 presents the absorbance change of C–H and C–O bonds of cellulose. The peak intensity at 1435 cm–1 (Figure 4a), due to the bending of C–H connected with O(6)–H(6), increases with temperature rising and shows a rapid increase from 135 to 140 °C, which is consistent with that of O(6)–H(6) (Figure 2c) or ester carbonyl (Figure 3b). This indirectly proves the esterification of O(6)–H(6) with BTCA. The peak intensity change at 1384 cm–1 (Figure 4b) and 1374 cm–1 (Figure 4c) provides evidence for the esterification between O(2)–H(2) and BTCA. However, O(3)–H(3) may not or rarely participate in the esterification reaction, deduced from the relatively constant peak intensity of C(3)–H(3) at 1356 cm–1 (Figure 4d). The increasing changes of C(2)–O(2) (Figure 4e) and C(6)–O(6) (Figure 4f) are similar to those of the corresponding C–H in Figure 4c,a, which benefit from the esterification between BTCA carboxyl and cellulose hydroxyl.
Figure 4.
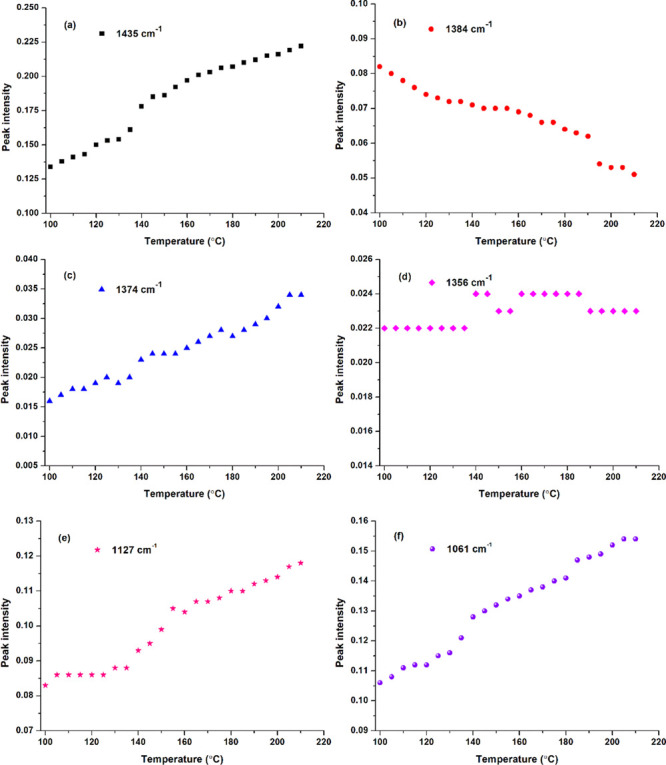
C–H or C–O intensity of the BTCA-treated fabric in the range of 1500–1050 cm–1 with temperature rising: (a) 1435; (b) 1384; (c) 1374; (d) 1356; (e) 1127; and (f) 1061 cm–1.
2Dcos was used to analyze the temperature-dependent FTIR spectra of the sample, hoping to deeply understand the reaction mechanism of BTCA with cellulose from the viewpoint of the reaction site of functional groups. Similarly, the spectra between 100 and 210 °C were selected for analysis. 2Dcos synchronous and asynchronous contour maps are shown in Figures 5 and 6, respectively. In Noda’s rule, if the cross peaks (ν1, ν2) (ν1 > ν2) show the same sign in the synchronous and asynchronous maps (both positive and negative), ν1 changes earlier than ν2; if different, ν2 changes earlier than ν1. For example, the cross peaks (3574, 3441 cm–1) in Figures 5a and 6a are both positive; then, the group at 3574 cm–1 changes earlier than that at 3441 cm–1. By carefully analyzing the correlation signs of different peaks (see Supporting Information, Table S2) in Figures 5 and 6, the peak change order is as follows (“→” means earlier than or prior to): 3334 cm–1 → 3220 cm–1 → 3574 cm–1 → 3410 cm–1 → 3441 cm–1, or ν(O(3)–H(3)···O(5)) (intrachain) → ν(O–H) (weak hydrogen bond) → ν(O–H) (free) → ν(O(6)–H(6)···O(3)) (interchain) → ν(O(2)–H(2)···O(6)) (intrachain). This indicates that as temperature increases, the cellulose O(3)–H(3) (hydrogen bonded) responds first and then the weakly hydrogen-bonded O–H, both of which release free O–H. Free hydroxyl is the one to participate in the esterification with BTCA carboxyl. Besides, based on the earlier change of O(6)–H(6), it was deduced that O(6)–H(6) reacts with BTCA anhydride earlier than O(2)–H(2).
Figure 5.
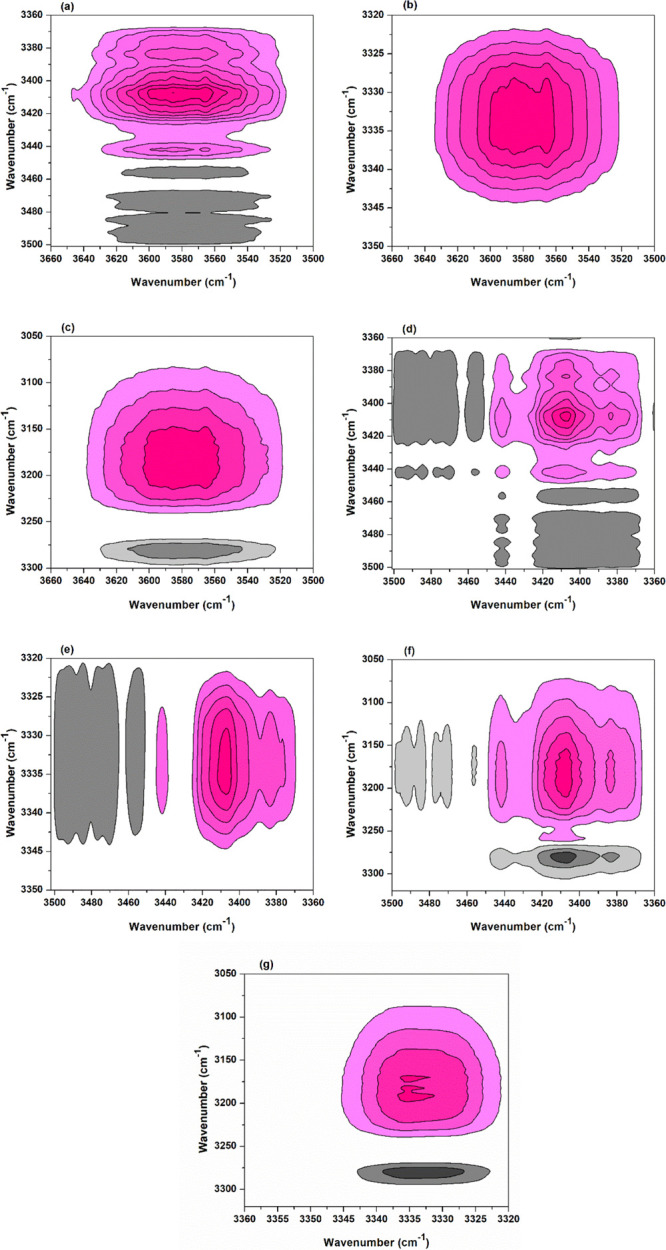
2Dcos synchronous maps of the BTCA-treated fabric between 100 and 210 °C: (a) (3660–3500, 3506–3360 cm–1); (b) (3660–3500, 3350–3320 cm–1); (c) (3660–3500, 3300–3050 cm–1); (d) (3506–3360, 3506–3360 cm–1); (e) (3506–3360, 3350–3320 cm–1); (f) (3500–3360, 3320–3050 cm–1); and (g) (3360–3320, 3320–3050 cm–1). The pink and gray colors mean positive and negative correlation, respectively. This also applies to the following maps.
Figure 6.
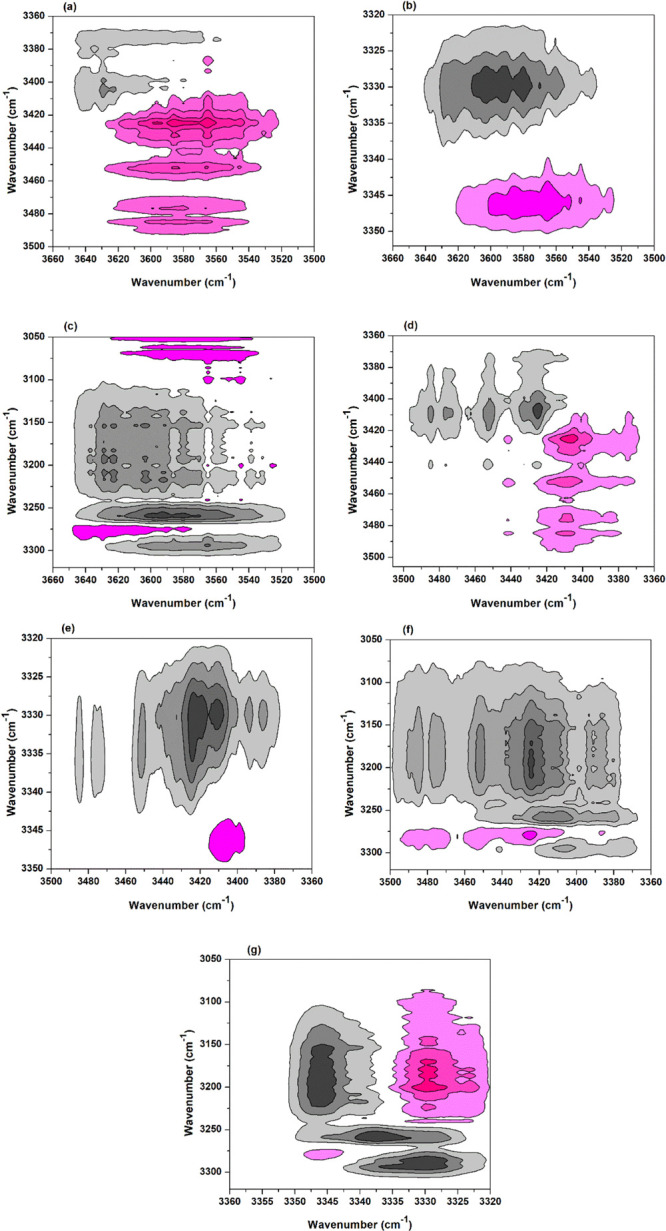
2Dcos asynchronous maps of the BTCA-treated fabric between 100 and 210 °C: (a) (3660–3500, 3500–3360 cm–1); (b) (3660–3500, 3360–3320 cm–1); (c) (3660–3500, 3320–3050 cm–1); (d) (3506–3360, 3506–3360 cm–1); (e) (3500–3360, 3350–3320 cm–1); (f) (3500–3360, 3320–3050 cm–1); and (g) (3360–3320, 3320–3050 cm–1).
The esterification between the cellulose hydroxyl and BTCA can affect the spectrum change of C–H and C–O bonds connecting with the corresponding hydroxyl, and their 2Dcos maps were also obtained (Figure 7). According to the signs of cross peaks in Figure 7a,b and Noda’s rule, the changes are as follows: 1435 cm–1 → 1374 cm–1 → 1356 cm–1 or δ(C(6)–H(6)) → δ(C(2)–H(2)) → δ(C(3)–H(3)). This is consistent with the results in Figure 6, which further proves that O(6)–H(6) participated in the esterification with BTCA earlier than O(2)–H(2). In addition, a few of O(3)–H(3) may also esterify with BTCA but show a very small change (Figures 4d and 7a).
Figure 7.
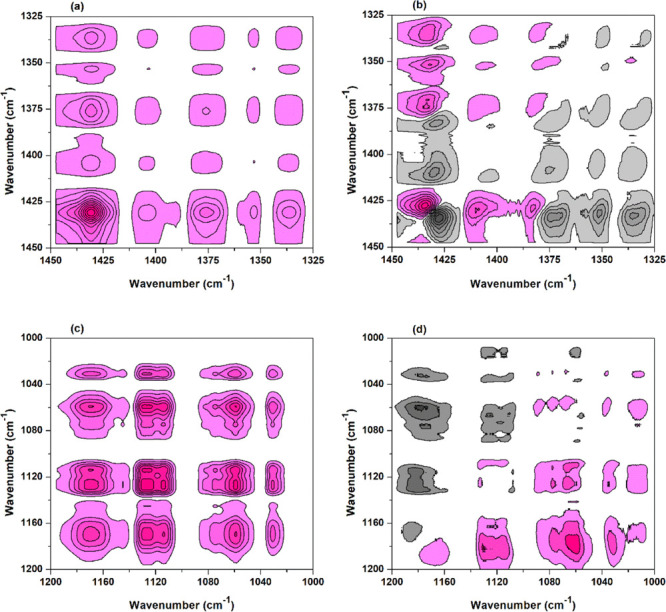
2Dcos maps of 1450–1000 cm–1 of the BTCA-treated fabric between 100 and 210 °C: (a,c) synchronous and (b,d) asynchronous.
Due to the coexistence of crystalline and amorphous regions in cellulose and the complex interactions occuring between different hydroxyl groups, cellobiose (its structure can be seen in Scheme 1) was taken as a model of cellulose, and the reaction between BTCA and cellobiose was also investigated. FTIR and 2Dcos maps are shown in Figure 8. It can be concluded according to Noda’s rule26,32 as follows: 3514 cm–1 → 3375 cm–1 → 3294 cm–1 → 3203 cm–1 → 3412 cm–1 → 3170 cm–1 → 3420 cm–1 → 3224 cm–1, or ν(O–H, free) → ν(O(3)–H(3)) (hydrogen bond) → ν(O–H) (weak hydrogen bond) → ν(O–H) (BTCA hydroxyl, C14- or C11-containing carboxyl) → ν(O(6)–H(6)) (hydrogen bond) → ν(O–H) (BTCA hydroxyl, C5-containing carboxyl) → ν(O(2)–H(2)) (hydrogen bond) → ν(O–H) (BTCA hydroxyl, C8-containing carboxyl). This confirms the results of Figures 5 and 6, indirectly proving the earlier esterification of O(6)–H(6) than O(2)–H(2). Besides, for BTCA carboxyl groups, the C14- or C11-containing carboxyl (the atom number can be seen in Scheme 3) may be more reactive than the other two carboxyls due to their earlier changes.
Scheme 1. Chemical Structure of Compounds: (a) BTCA and (b) Cellobiose.
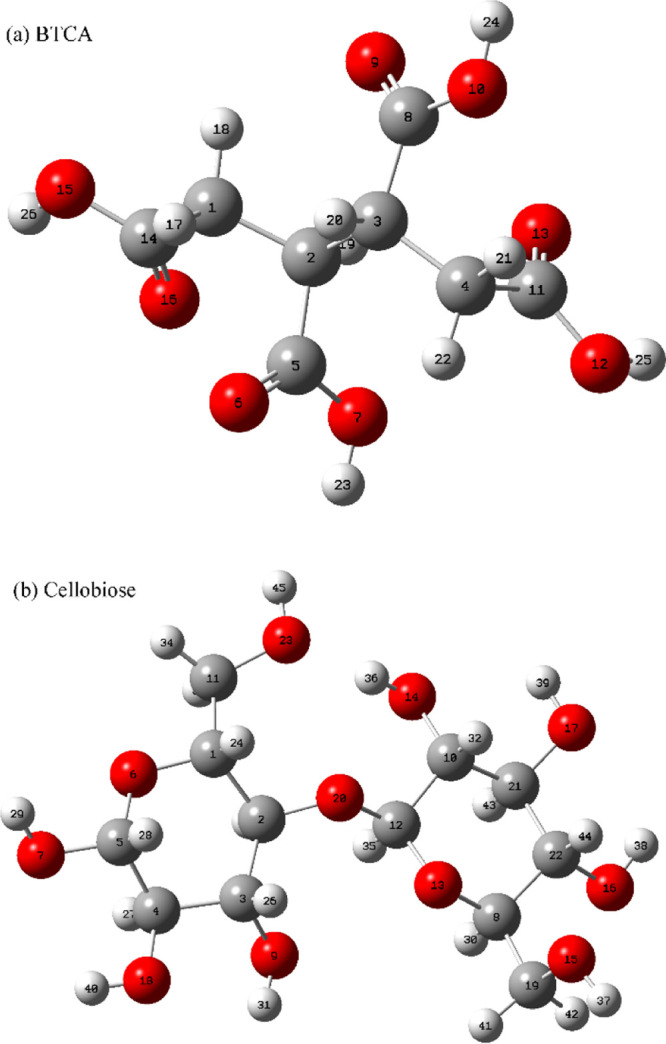
Atoms in red color are oxygen atoms; atoms in gray color are carbon atoms; and atoms in light gray color are hydrogen atoms.
Figure 8.
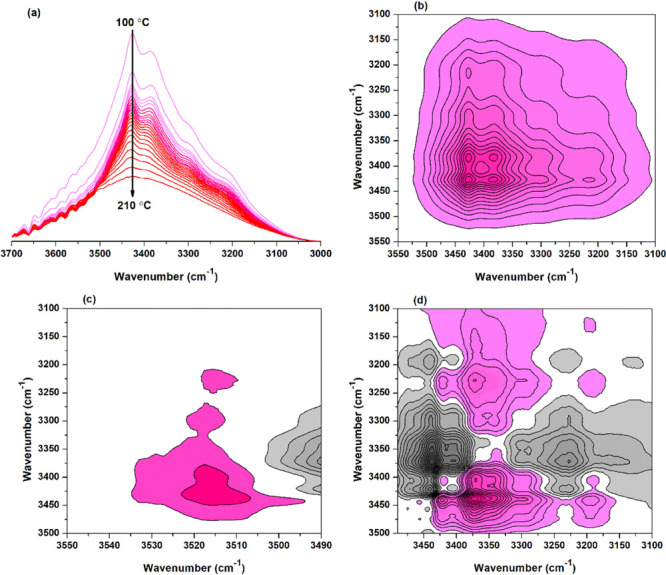
FTIR spectra and 2Dcos maps of cellobiose and BTCA mixture between 100 and 210 °C: (a) FTIR spectra; (b) 2Dcos synchronous map; and (c,d) 2Dcos asynchronous map.
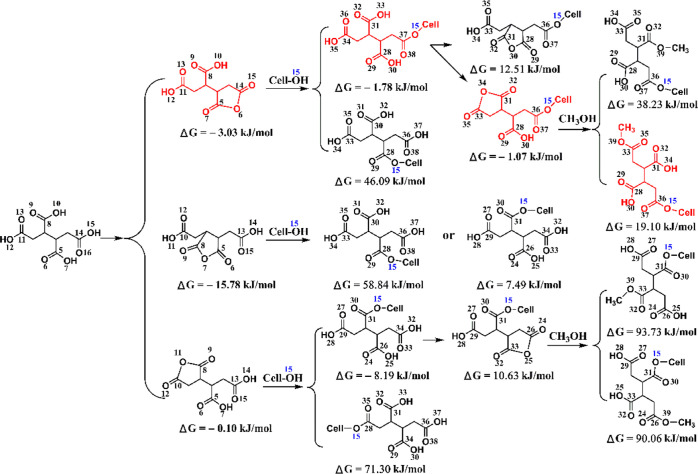
Scheme 3. Schematic Presentation of the Two-step Reaction Mechanism between BTCA and Cellobiose (or Methanol) (T = 433.15 K).
Note: Cell-OH refers to cellobiose.
2.3. Reaction Site of BTCA Carboxyl
Figure 9 shows the 2Dcos maps of temperature-dependent FTIR spectra (1850–1580 cm–1) of the BTCA-treated fabric. By carefully analyzing the signs of cross peaks, the changing order can be summarized as follows: 1647 cm–1 → 1697 cm–1 → 1701 cm–1 →1793 cm–1 → 1755 (1708) cm–1, or δ(O–H) (H2O) → ν(C=O) (BTCA, strong hydrogen bond) → ν(C=O) (BTCA, weak hydrogen bond) → ν(C=O) (BTCA anhydride) → ν(C=O) (ester). It is reasonable that water in the cellulose evaporated at heating before BTCA forms anhydride. This corresponds to the accepted mechanism that anhydride is the active intermediate for the reaction of PCA with cellulose.
Figure 9.
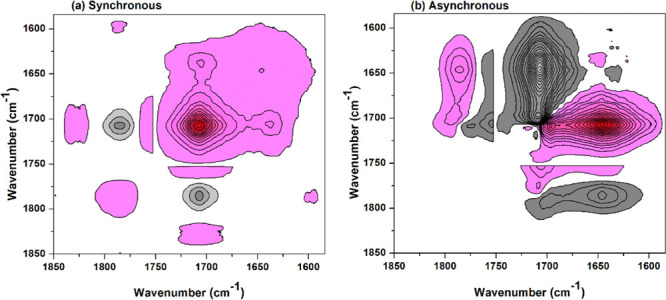
2Dcos synchronous (a) and asynchronous (b) maps of 1850–1580 cm–1 of the BTCA-treated fabric between 100 and 210 °C.
However, it was noted that BTCA carboxyl carbonyl (1701 cm–1) may overlap with ester carbonyl (1708 cm–1) (Figure 1b). Moreover, determining which carboxyl of BTCA involves in the esterification reaction with cellulose is confusing. Similarly, temperature-dependent FTIR and 2Dcos were used to analyze the reaction between cellobiose and BTCA, as shown in Figure 10 and Table S3 (see Supporting Information). The functional group changes can be summarized as follows: 1647 cm–1 → 1743 cm–1 → 1678 cm–1 → 1701 (1697) cm–1 → 1774 cm–1 → 1793 cm–1 → 1727 cm–1 → 1708 cm–1, or δ(O–H) (H2O) → ν(C=O) (BTCA carboxyl carbonyl, hydrogen-bonded) → ν(C=O) (BTCA carboxyl carbonyl, hydrogen-bonded) → ν(C=O) (BTCA carboxyl carbonyl, hydrogen-bonded) → ν(C=O) (BTCA carboxyl carbonyl, free) → ν(C=O) (BTCA anhydride) → ν(C=O) (ester carbonyl) → ν(C=O) (ester carbonyl). This further confirms the reaction between cellulose and BTCA (Figure 9) with a higher resolution of cellobiose and BTCA spectra in FTIR (see Supporting Information, Figure S1) and 2Dcos maps (Figure 10). This is due to the higher content of BTCA in the hybrid sample of cellobiose and BTCA (10:1 molar ratio) than that in the treated cotton fabrics (100% wet pickup).
Figure 10.
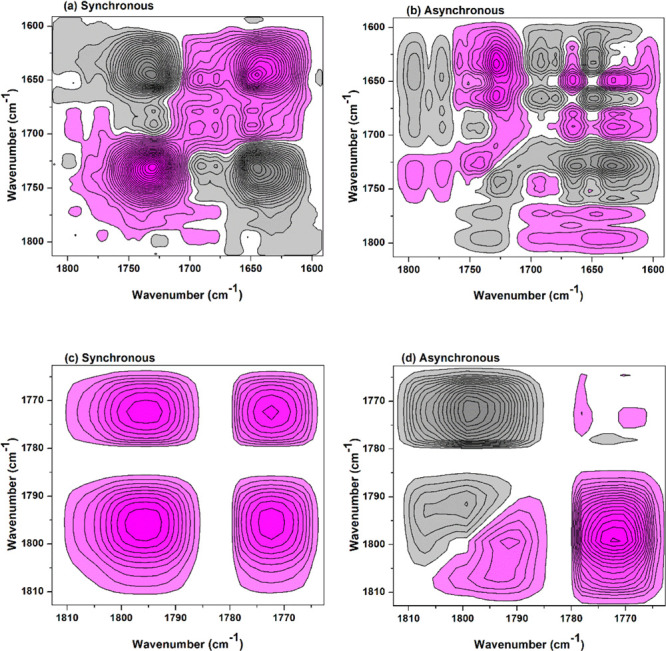
2Dcos maps of the cellobiose and BTCA mixture between 100 and 210 °C: (a,c) synchronous and (b,d) asynchronous.
To clarify the reaction site of BTCA carboxyl groups, the frontier molecular orbital (FMO) and Gibbs free energy change (ΔG) of different compounds were calculated with Gaussian, as shown in Tables 1 and 2, respectively. The temperature of 433.15 K was selected for the thermodynamic calculations because this was an optimal condition for fabric treatment concluded in our previous studies.16,33 On the basis of the discussion in Figures 4–8, the O(6)–H(6) group of cellulose is easier to esterify with BTCA, which was also reported when reacting with citric acid anhydride.31 Therefore, the corresponding hydroxyl of cellobiose (O15–H37) will be used in the following theoretical calculations. The formation of BTCA anhydride should be catalyzed by the proton (H+) (Scheme 2), and the highest occupied molecular orbital (HOMO) of BTCA was obtained. The O14 atom contributes the most (53.78%) to the HOMO of the BTCA molecule (Table 1), indicating its easiness to attack the proton. The C5C14 anhydride is most likely to be formed from the viewpoint of reaction kinetics. Table 2 shows a negative ΔG value for the formation of BTCA anhydride, and therefore, C5C14, C5C8, and C8C11 can be formed based on the reaction thermodynamics. The carbonyl carbon atoms of the anhydride ring show different contributions to the lowest unoccupied molecular orbital (LUMO) of the corresponding anhydride (Table 1). ΔG values in Table 2 show that the formation of C14O15 ester or C8O15 ester is more supported, and their residual carboxyl groups can continue to form an anhydride. Compared with C8O15 ester, C14O15 ester seems to form anhydride more easily because of a much higher atom contribution of O36, which can be also supported by a negative ΔG value of −1.07 kJ/mol (Table 2). Benefiting from the negative ΔG value (Table 2), the C14O15 ester C31C34 anhydride is easier to form with similar atom contributions (Table 1). To make the calculation cheaper (consuming less time), methanol is employed for the calculation of esterification with the second anhydride. Finally, the C14O15 ester C31C34 anhydride esterifies with methanol to form the C14O15C34O ester, and this reaction route is more possible. On the basis of the above analyses, BTCA should esterify with the cellulose O(6)–H(6) group as follows (see Scheme 3): BTCA → BTCA anhydride (C5C14, or C5C8, or C8C11) → ester (C14O15, or C8O15) → C14O15 ester C31C34 anhydride → C14O15C33O ester. Therefore, BTCA carboxyl groups containing C14 and C11 atoms are more prone to cross-link with cellulose as indicated in red in Scheme 3. Of course, temperature affects the reaction thermodynamics of cross-linking between BTCA and cellobiose, which will be investigated in our future study.
Table 1. Frontier Molecular Orbitals from Gaussian Calculation.
| molecule | group | contribution to FMOa |
|---|---|---|
| BTCA | C14=O16 | 53.78 |
| C5=O6 | 6.64 | |
| C8=O9 | 9.25 | |
| C11=O13 | 0.47 | |
| C5C14 anhydride | O7=C5–O6–C14=O15 | 20.72 |
| O7=C–O6–C14=O15 | 33.89 | |
| C5C8 anhydride | O6=C5–O7–C8=O9 | 29.95 |
| O6=C5–O7–C8=O9 | 23.72 | |
| C8C11 anhydride | O9=C8–O11–C10=O12 | 34.25 |
| O9=C8–O11–C10=O12 | 18.50 | |
| C14O15 ester | C28=O29 | 0.01 |
| C31=O32 | 0.002 | |
| C34=O36 | 1.42 | |
| C8O15 ester | C26=O24 | 0.02 |
| C29=O27 | 0 | |
| C34=O33 | 0.001 | |
| C14O15 ester C28C31 anhydride | O29=C28–O30–C31=O32 | 20.46 |
| O29=C28–O30–C31=O32 | 32.32 | |
| C14O15 ester C31C34 anhydride | O32=C31–O34–C33=O35 | 34.39 |
| O32=C31–O34–C33=O35 | 21.98 | |
| C8O15 ester C26C34 anhydride | O24=C26–O25–C33=O32 | 28.68 |
| O24=C26–O25–C33=O32 | 26.86 |
Table 2. Gibbs Free Energy Change (ΔG) of Reactions Based on the Gaussian Calculation (T = 433.15 K).
| reactant | producta | ΔG (kJ/mol) |
|---|---|---|
| BTCA | C5C14 anhydride | –3.03 |
| C5C8 anhydride | –15.78 | |
| C8C11 anhydride | –0.10 | |
| C5C14 anhydride + cellobiose | C5O15 ester | 46.09 |
| C14O15 ester | –1.78 | |
| C5C8 anhydride + cellobiose | C5O15 ester | 58.84 |
| C8O15 ester | 7.49 | |
| C8C11 anhydride + cellobiose | C8O15 ester | –8.19 |
| C11O15 ester | 71.30 | |
| C14O15 ester | C14O15 ester C28C31 anhydride | 12.51 |
| C14O15 ester C31C34 anhydride | –1.07 | |
| C8C15 ester | C8O15 ester C26C34 anhydride | 10.63 |
| C14O15 ester C31C34 anhydride + CH3OH | C14O15C31O ester | 38.23 |
| C14O15C34O ester | 19.10 | |
| C8O15 ester C26C34 anhydride + CH3OH | C8O15C26O ester | 93.73 |
| C8O15C34O ester | 90.06 |
To facilitate the analysis of the reaction site, the atom number in products is written according to the atom number in the reactant. For example, C5C14 anhydride refers to that the anhydride is produced from the reaction site of C5 and C14 groups in BTCA; C5O15 ester means the esterification reaction occurs between C5 in BTCA and O15 in cellobiose; and C14O15 ester C28C31 anhydride refers to that the anhydride is formed by C28 and C31 sites in C14O15 ester. For C14O15C31O ester, because methanol was used as a model of cellulose and it only contains one oxygen atom, the atom number is omitted.
Scheme 2. Anhydride Formation of BTCA Catalyzed with Proton.
3. Conclusions
FTIR coupled with 2Dcos and DFT calculations was employed to clarify the reaction sites of BTCA carboxyl groups and cellulose hydroxyl groups. Results confirmed the classical theory that BTCA forms an anhydride intermediate before esterifying with cellulose. Moreover, it is prone to react with the O(6)–H(6) and O(2)–H(2) groups of cellulose. The reaction between BTCA and cellobiose, a model of cellulose, also proved this. Interestingly, both the experimental and theoretical results indicated that the carboxyl groups of BTCA containing C14 and C11 atoms were most likely to participate in the cross-linking with cellulose. A possible reaction route was proposed as follows: BTCA → BTCA C5C14 anhydride → C14O15 ester → C14O15 ester C31C34 anhydride → C14O15C33O ester.
4. Materials and Methods
4.1. Materials
The plain-woven fabric of 100% cotton (Hualun Printing & Dyeing Co., Ltd., Shanghai, China) is pretreated and mercerized. The fabric shows a specific of 14.6 tex × 14.6 tex and a density of 117 g/m2. BTCA, cellobiose, and monohydrate sodium hypophosphite (SHP) are all analytical reagents (Sinopharm Chemical Reagent Co., Ltd., Shanghai, China). Potassium bromide (KBr), a spectral-grade agent, was provided by Tianjin Botianshengda Technology Development Co., Ltd. (Tianjin, China). All chemicals were used without further purification.
4.2. Sample Treatment
The finishing bath for fabrics was composed of BTCA (70 g/L) and SHP (32 g/L). The fabric was immersed in the finishing bath for about 10 s before padding with a roller, and then this process was repeated. The padded fabric with a wet pickup of 100% was dried at 80 °C for 5 min. Finally, the BTCA-treated fabric was cut into powders and stored in a desiccator for use.
A homogeneous aqueous solution containing cellobiose, BTCA, and SHP was prepared at a mole ratio of cellobiose/BTCA/SHP = 10:1:1. Then, the solution was frozen in a refrigerator for 24 h, and finally, it was lyophilized for 48 h with a freeze drier (FreeZone4.5, Labconco Corporation, Kansas, MO, USA). The freeze-dried sample (cellobiose-BTCA-SHP, CBS) was stored in a desiccator for use.
4.3. FTIR and 2Dcos
A total of 2.0 mg of the fine powders of the BTCA-treated fabrics (or the freeze-dried CBS) was mixed with 200.0 mg of dried potassium bromide (KBr). After thorough grinding, the sample was pressed into a transparent pellet. The absorbance spectra (4000–500 cm–1) were collected from 80–210 °C every other 5 °C with a Nicolet iS10 spectrometer (Thermo Fisher Scientific, Waltham, MA, USA) equipped with a heating accessory (heating rate 2 °C/min). 64 scans and a resolution of 4 cm–1 were set up for every spectrum. Before 2Dcos analysis, the spectrum should be processed with a baseline and smoothing (15 cm–1) program.
2D Shige v.1.3 software (Shigeaki Morita, Kwansei-Gakuin University, Nishinomiya, Japan, 2004–2005) was used to analyze the FTIR spectra, and the final 2Dcos contour maps were processed with Origin Program v.8.0.
4.4. Theoretical Calculation
The geometry optimization and frequency calculation of a compound was conducted with Gaussian 09W software (Gaussian, Inc., Wallingford, CT, USA) in density functional theory34,35 and unrestricted B3LYP/6-31G(d,p) level of theory. GaussView 5.0 software was used to analyze the results. Cellobiose or methanol was taken as a model of cellulose for calculations.
The contribution of an atom to the FMO was analyzed with Multiwfn 3.7 software.36
Acknowledgments
The authors gratefully acknowledge the financial support by the National Natural Science Foundation of China (51803025); the Fundamental Research Funds for the Central Universities (2232020D-21); the State Key Laboratory of Bio-Fibers and Eco-Textiles (KF2020213); and the State Key Laboratory of New Textile Materials and Advanced Processing Technologies (FZ2020010). The authors are also very grateful for the help of Zijing Cai in the collection of FTIR spectra.
Supporting Information Available
The Supporting Information is available free of charge at https://pubs.acs.org/doi/10.1021/acsomega.1c04718.
FTIR spectra of BTCA and cellobiose mixture at different temperatures, tentative assignments of sample peaks, and sign of cross peaks in 2Dcos maps (PDF)
The authors declare no competing financial interest.
Supplementary Material
References
- Cheng H.; Lijie L.; Wang B.; Feng X.; Mao Z.; Vancso G. J.; Sui X. Multifaceted applications of cellulosic porous materials in environment, energy, and health. Prog. Polym. Sci. 2020, 106, 101253–101275. 10.1016/j.progpolymsci.2020.101253. [DOI] [Google Scholar]
- Harifi T.; Montazer M. Past, present and future prospects of cotton cross-linking: New insight into nano particles. Carbohydr. Polym. 2012, 88, 1125–1140. 10.1016/j.carbpol.2012.02.017. [DOI] [Google Scholar]
- Dehabadi V. A.; Buschmann H.-J.; Gutmann J. S. Durable press finishing of cotton fabrics: An overview. Text. Res. J. 2013, 83, 1974–1995. 10.1177/0040517513483857. [DOI] [Google Scholar]
- Yang C. Q.; Weishu Wei W. S.; McIlwaine D. B. Evaluating glutaraldehyde as a nonformaldehyde durable press finishing agent for cotton fabrics. Text. Res. J. 2000, 70, 230–236. 10.1177/004051750007000309. [DOI] [Google Scholar]
- Lou J.; Fan X.; Wang Q.; Wang P.; Yuan J.; Yu Y. Oxysucrose polyaldehyde: A new hydrophilic crosslinking reagent for anti-crease finishing of cotton fabrics. Carbohydr. Res. 2019, 486, 107783–107788. 10.1016/j.carres.2019.107783. [DOI] [PubMed] [Google Scholar]
- Nasr H. E.; Sayyah S. M.; Essa D. M.; Samaha S. H.; Rabie A. M. Utilization of acrylates emulsion terpolymer with chitosan as a finishing agent for cotton fabrics. Carbohydr. Polym. 2009, 76, 36–45. 10.1016/j.carbpol.2008.09.025. [DOI] [Google Scholar]
- Hashem M.; Refaie R.; Hebeish A. Crosslinking of partially carboxymethylated cotton fabric via cationization. J. Cleaner Prod. 2005, 13, 947–954. 10.1016/j.jclepro.2004.05.002. [DOI] [Google Scholar]
- Hashem M.; Elshakankery M. H.; El-Aziz S. M. A.; Fouda M. M. G.; Fahmy H. M. Improving easy care properties of cotton fabric via dual effect of ester and ionic crosslinking. Carbohydr. Polym. 2011, 86, 1692–1698. 10.1016/j.carbpol.2011.06.085. [DOI] [Google Scholar]
- Huang C.; Zhang N.; Wang Q.; Wang P.; Yu Y.; Zhou M. Development of hydrophilic anti-crease finishing method for cotton fabric using alpha-Lipoic acid without causing strength loss and formaldehyde release problem. Prog. Org. Coat. 2021, 151, 106042–106051. 10.1016/j.porgcoat.2020.106042. [DOI] [Google Scholar]
- Aly A. S.; Mostafa A. B. E.; Ramadan M. A.; Hebeish A. Innovative dual antimicrobial & anticrease finishing of cotton fabric. Polym.-Plast. Technol. Eng. 2007, 46, 703–707. 10.1080/15583720701271559. [DOI] [Google Scholar]
- Huang K.-S.; Wu W.-J.; Chen J.-B.; Lian H.-S. Application of low-molecular-weight chitosan in durable press finishing. Carbohydr. Polym. 2008, 73, 254–260. 10.1016/j.carbpol.2007.11.023. [DOI] [Google Scholar]
- Zhang X.; Wang W.; Zhu M.; Yu D. Wrinkle-free finishing of cotton fabrics based on click chemistry via ultraviolet radiation. J. Text. Inst. 2018, 109, 1536–1542. 10.1080/00405000.2018.1429243. [DOI] [Google Scholar]
- Yang C. Q.; Xilie Wang X. L. Formation of cyclic anhydride intermediates and esterification of cotton cellulose by multifunctional carboxylic acids: An infrared spectroscopy study. Text. Res. J. 1996, 66, 595–603. 10.1177/004051759606600908. [DOI] [Google Scholar]
- Hong K. H. Preparation and properties of phenolic compound/BTCA treated cotton fabrics for functional textile applications. Cellulose 2015, 22, 2129–2136. 10.1007/s10570-015-0604-4. [DOI] [Google Scholar]
- Patil N. V.; Netravali A. N. Multifunctional sucrose acid as a ‘green’ crosslinker for wrinkle-free cotton fabrics. Cellulose 2020, 27, 5407–5420. 10.1007/s10570-020-03130-9. [DOI] [Google Scholar]
- Ji B.; Qi H.; Yan K.; Sun G. Catalytic actions of alkaline salts in reactions between 1,2,3,4-butanetetracarboxylic acid and cellulose: I. Anhydride formation. Cellulose 2016, 23, 259–267. 10.1007/s10570-015-0810-0. [DOI] [PubMed] [Google Scholar]
- Wu X.; Yang C. Q.; He Q. Flame retardant finishing of cotton fleece: part VII. Polycarboxylic acids with different numbers of functional group. Cellulose 2010, 17, 859–870. 10.1007/s10570-010-9416-8. [DOI] [Google Scholar]
- Cheng X.-W.; Tang R.-C.; Guan J.-P.; Zhou S.-Q. An eco-friendly and effective flame retardant coating for cotton fabric based on phytic acid doped silica sol approach. Prog. Org. Coat. 2020, 141, 105539–105546. 10.1016/j.porgcoat.2020.105539. [DOI] [Google Scholar]
- Tang Y.; Lin T.; Ai S.; Li Y.; Zhou R.; Peng Y. Super and selective adsorption of cationic dyes using carboxylate-modified lignosulfonate by environmentally friendly solvent-free esterification. Int. J. Biol. Macromol. 2020, 159, 98–107. 10.1016/j.ijbiomac.2020.05.037. [DOI] [PubMed] [Google Scholar]
- Toledo P. V. O.; Limeira D. P. C.; Siqueira N. C.; Petri D. F. S. Carboxymethyl cellulose/poly(acrylic acid) interpenetrating polymer network hydrogels as multifunctional adsorbents. Cellulose 2019, 26, 597–615. 10.1007/s10570-018-02232-9. [DOI] [Google Scholar]
- Ji B.; Zhao C.; Yan K.; Sun G. Effects of acid diffusibility and affinity to cellulose on strength loss of polycarboxylic acid crosslinked fabrics. Carbohydr. Polym. 2016, 144, 282–288. 10.1016/j.carbpol.2016.02.036. [DOI] [PubMed] [Google Scholar]
- Kang I.-S.; Yang C. Q.; Weishu Wei W.; Lickfield G. C. Mechanical strength of durable press finished cotton fabrics Part I: Effects of acid degradation and crosslinking of cellulose by polycarboxylic acids. Text. Res. J. 1998, 68, 865–870. 10.1177/004051759806801112. [DOI] [Google Scholar]
- Ji B.; Zhao C.; Yan K.; Sun G. Effects of divalent anionic catalysts on cross-linking of cellulose with 1,2,3,4-butanetetracarboxylic acid. Carbohydr. Polym. 2018, 181, 292–299. 10.1016/j.carbpol.2017.10.081. [DOI] [PubMed] [Google Scholar]
- Yang C. Q.; Bakshi G. D. Quantitative analysis of the nonformaldehyde durable press finish on cotton fabric: Acid-base titration and infrared spectroscopy. Text. Res. J. 1996, 66, 377–384. 10.1177/004051759606600604. [DOI] [Google Scholar]
- Schramm C.; Rinderer B.; Bobleter O. Quantitative determination of BTCA bound to cellulosic material by means of isocratic HPLC. Text. Res. J. 1998, 68, 821–827. 10.1177/004051759806801106. [DOI] [Google Scholar]
- Noda I. Two-dimensional infrared spectroscopy. J. Am. Chem. Soc. 1989, 111, 8116–8118. 10.1021/ja00203a008. [DOI] [Google Scholar]
- Hou L.; Wu P. Comparison of LCST-transitions of homopolymer mixture, diblock and statistical copolymers of NIPAM and VCL in water. Soft Matter 2015, 11, 2771–2781. 10.1039/c5sm00026b. [DOI] [PubMed] [Google Scholar]
- Wang M.; Wu P.; Sengupta S. S.; Chadhary B. I.; Cogen J. M.; Li B. Investigation of water diffusion in low-density polyethylene by attenuated total reflectance Fourier transform infrared spectroscopy and two-dimensional correlation analysis. Ind. Eng. Chem. Res. 2011, 50, 6447–6454. 10.1021/ie102221a. [DOI] [Google Scholar]
- Hou L.; Feng K.; Wu P.; Gao H. Investigation of water diffusion process in ethyl cellulose-based films by attenuated total reflectance Fourier transform infrared spectroscopy and two-dimensional correlation analysis. Cellulose 2014, 21, 4009–4017. 10.1007/s10570-014-0458-1. [DOI] [Google Scholar]
- Morita S.; Shinzawa H.; Noda I.; Ozaki Y. Perturbation-correlation moving-window two-dimensional correlation spectroscopy. Appl. Spectrosc. 2006, 60, 398–406. 10.1366/000370206776593690. [DOI] [PubMed] [Google Scholar]
- Cai Z.; Ji B.; Yan K.; Zhu Q. Investigation on reaction sequence and group site of citric acid with cellulose characterized by FTIR in combination with two-dimensional correlation spectroscopy. Polymers 2019, 11, 2071–2083. 10.3390/polym11122071. [DOI] [PMC free article] [PubMed] [Google Scholar]
- Hou L.; Wu P. Two-dimensional correlation infrared spectroscopy of heat-induced esterification of cellulose with 1,2,3,4-butanetetracarboxylic acid in the presence of sodium hypophosphite. Cellulose 2019, 26, 2759–2769. 10.1007/s10570-019-02255-w. [DOI] [Google Scholar]
- Ji B.; Tang P.; Yan K.; Sun G. Catalytic actions of alkaline salts in reactions between 1,2,3,4-butanetetracarboxylic acid and cellulose: II. Esterification. Carbohydr. Polym. 2015, 132, 228–236. 10.1016/j.carbpol.2015.06.070. [DOI] [PubMed] [Google Scholar]
- Luo Q.; Shi Z.; Li D.; Zhu C.; Wang M. DFT study on the ionic cyclization mechanism of copolymers of acrylonitrile-itaconic acid: Direct or autocatalytic?. Chem. Phys. Lett. 2017, 687, 158–162. 10.1016/j.cplett.2017.09.011. [DOI] [Google Scholar]
- Hosseinian A.; Vessally E.; Babazadeh M.; Edjlali L.; Es’haghi M. Adsorption properties of chloropicrin on pristine and borazine-doped nanographenes: A theoretical study. J. Phys. Chem. Solids 2018, 115, 277–282. 10.1016/j.jpcs.2017.12.036. [DOI] [Google Scholar]
- Lu T.; Chen F. Multiwfn: A multifunctional wavefunction analyzer. J. Comput. Chem. 2012, 33, 580–592. 10.1002/jcc.22885. [DOI] [PubMed] [Google Scholar]
Associated Data
This section collects any data citations, data availability statements, or supplementary materials included in this article.


