

ABSTRACT
Karst caves have recently been demonstrated to act as a sink for atmospheric methane, due in part to consumption by microbes residing in caves that can oxidize methane at atmospheric levels. However, our knowledge about the responsible atmospheric methane-oxidizing bacteria (atmMOB) in this vast habitat remains limited to date. To address this issue, weathered rock samples from three karst caves were collected in Guilin City and subjected to high-throughput sequencing of pmoA and 16S rRNA genes. The results showed that members of the high-affinity upland soil cluster (USC), especially upland soil cluster gamma (USCγ), with absolute abundances of 104 to 109 copies · g−1 dry sample, dominated the atmMOB communities, while Proteobacteria and Actinobacteria dominated the overall bacterial communities. Moreover, USCγ was a keystone taxon in cooccurrence networks of both the atmMOB and the total bacterial community, whereas keystone taxa in the bacterial network also included Gaiella and Aciditerrimonas. Positive links overwhelmingly dominated the cooccurrence networks of both atmMOB and the total bacterial community, indicating a consistent response to environmental disturbances. Our study shed new insights on the diversity and abundances underlining atmMOB and total bacterial communities and on microbial interactions in subterranean karst caves, which increased our understanding about USC and supported karst caves as a methane sink.
IMPORTANCE Karst caves have recently been demonstrated to be a potential atmospheric methane sink, presumably due to consumption by methane-oxidizing bacteria. However, the sparse knowledge about the diversity, distribution, and community interactions of methanotrophs requires us to seek further understanding of the ecological significance of methane oxidation in these ecosystems. Our pmoA high-throughput results from weathered rock samples from three karst caves in Guilin City confirm the wide occurrence of atmospheric methane-oxidizing bacteria in this habitat, especially those affiliated with the upland soil cluster, with a gene copy number of 104 to 109 copies per gram dry sample. Methanotrophs and the total bacterial communities had more positive than negative interactions with each other as indicated by the cooccurrence network, suggesting their consistent response to environmental disturbance. Our results solidly support caves as an atmospheric methane sink, and they contribute to a comprehensive understanding of the diversity, distribution, and interactions of microbial communities in subsurface karst caves.
KEYWORDS: Karst cave, atmospheric methane-oxidizing bacteria, cooccurrence network, subsurface biosphere, methane sink
INTRODUCTION
Karst caves are characterized by permanent darkness, stable temperature, high humidity, oligotrophic conditions, and geographical isolation (1, 2) and are considered extreme environments. Recently, they have been demonstrated to be potential sinks for atmospheric methane (CH4), similar to upland soils (3, 4), mainly due to the widespread phenomenon that CH4 concentrations in caves are consistently below the contemporary atmospheric level (1.8 to 2.0 ppm) (3, 5, 6). Moreover, these subatmospheric CH4 concentrations in caves are attributed to the consumption of methane-oxidizing bacteria (MOB), as indicated by stable isotope analysis of methane (4, 7, 8). Known atmospheric methane-oxidizing bacteria (atmMOB) have the capacity of oxidizing subatmospheric levels of CH4 due to their high affinities for CH4 and are phylogenetically affiliated with upland soil cluster gamma (USCγ) and alpha (USCα) (9), which are widely distributed in various upland soil environments (9 to 11). Members of the upland soil cluster (USC) have been confirmed to be actively involved in CH4 oxidation under atmospheric and low CH4 concentrations (2 ppm and 20 ppm) (12) and have been demonstrated to be responsible for the oxidation of atmospheric CH4 (13–15).
Members of the atmMOB are resistant to cultivation, which gives rise to great difficulty in studying their physiology. To date, USCγ has no cultured representatives, and a single draft genome from it has been reported, which showed a close relationship with Methylocaldum (16). Methylocapsa gorgona MG08, affiliated with USCα Jasper Ridge 1 in a phylogenetic analysis of PmoA (amino acid sequence of the pmoA gene) and closely clustered with “Candidatus Methyloaffinis” via the analysis of the 16S rRNA gene, was isolated from the cover soil of a retired subarctic landfill (17). Fortunately, the functional gene encoding the beta subunit of particulate methane monooxygenase (pMMO), pmoA, is conserved in most MOB, except that Methylocella, Methyloferula, and Methyloceanibacter solely use the soluble methane monooxygenase (sMMO) (18–20). Therefore, pmoA can serve as an excellent phylogenetic marker to study the diversity of MOB (10, 21), and specific primers targeting pmoA of atmMOB have also been designed to detect their occurrence in natural ecosystems (21). Sequences of this gene have also been retrieved from the Heshang Cave in central China, showing that USCγ dominated the MOB communities in the weathered rocks (22). Therefore, sequencing and quantification of the pmoA gene exclusive to atmMOB are reliable approaches to characterize the overall diversity and abundance of atmMOB in subsurface karst caves.
The community structure of atmMOB in soil was demonstrated to be significantly controlled by pH: USCα generally dominates under acidic conditions, while USCγ prefers to live in neutral and alkaline habitats (9, 10, 23). Despite the role of pH in the distribution of atmMOB, pH does not affect the methane oxidation rate directly but, rather, acts on the abundance of MOB (24). Due to the alkaline conditions in karst caves (25), we assume that USCγ would dominate atmMOB communities. The CH4 concentration can also affect the capacity for atmospheric CH4 oxidation by atmMOB. Exposure to an increased CH4 concentration (∼10 ppm) increased the atmospheric CH4 oxidation rates in forest soils, where the MOB communities are mainly dominated by USCγ and USCα (26). Concentration gradients of CH4, as the direct substrate of microbial CH4 oxidation, are known to exist in numerous caves (3, 4). However, how the CH4 concentration impacts atmMOB communities in subsurface caves has remained mysterious.
To address these issues, we collected weathered rock samples and weathered crust samples from three different caves across Guilin City, Guangxi Province, southwestern China (Fig. 1). The samples were subsequently sequenced for pmoA and 16S rRNA genes via high-throughput sequencing. The aims of this study were to (i) investigate the abundance and distribution of atmMOB and other bacteria, (ii) explore the correlations between environmental factors and the total bacterial and atmMOB communities, and (iii) understand the cooccurrence patterns among bacterial taxa and MOB clades in weathered rock samples from subterranean caves. Our results will expand our understanding of the diversity and distribution of atmMOB in subsurface karst caves and the interactions between MOB/bacteria and environmental variables.
FIG 1.

Geographic locations and atmospheric gas concentrations of the three karst caves investigated in Guilin City, southwest China. (A) The geographic locations of Panlong Cave, Luohandu Cave, and Xincuntun Cave on the map of China and Guilin City. The Chinese map was modified after http://bzdt.ch.mnr.gov.cn/. (B) Schematic diagram of weathered rocks. Spatial variability of the concentrations (ppm) of CH4 (C) and CO2 (D) in the cave atmosphere. Sampling sites within the caves are shown by blue dots, and air sampling sites are marked with triangles. P, Panlong Cave; X, Xincuntun Cave; L, Luohandu Cave; 1, sampling site at the middle of the cave; 2, sampling site far from the entrance of the cave; W, weathered rock; C, weathered crust.
RESULTS
Physicochemical properties of weathered rock and crust samples.
Samples collected from the three karst caves in Guilin City (Panlong Cave [PLD], Luohandu Cave [LHD], and Xincuntun Cave [XCT]) (Fig. 1) were slightly alkaline or alkaline, with pH varying in the range of 7.78 to 9.56 (Table 1). The physicochemical properties varied with sample type (i.e., weathered rock versus crust), as well as the distance to the cave entrance. Specifically, the SO42− concentration varied with the distance to the cave entrance (Table 1). The pH and the concentrations of Cl−, K+, and Na+ varied with sample types in PLD and XCT, whereas these physicochemical parameters varied with sampling locations in LHD (Table 1). The weathering indices, such as the Ca/Si and Mg/Si ratios, of PLD were significantly different with the distance to the cave entrance. In contrast, the weathering indices in LHD and XCT were linked to niches (Table 1).
TABLE 1.
Physicochemical properties and high-affinity USC gene copy numbers of weathered rock samples in three karst caves, Guilin City, southwestern China
| Samplea | Mean abundance ± SD (copies · g−1 dry wt) (n = 108, contains 9 replicates) of USCb: |
Mean value ± SD (n = 36, contains 3 replicates)c |
|||||||
|---|---|---|---|---|---|---|---|---|---|
| USCα | USCγ | pH | Cl− (mg·kg−1) | SO42− (mg·kg−1) | K+ (mg·kg−1) | Na+ (mg·kg−1) | Ca/Si ratio | Mg/Si ratio | |
| P1W | 3.01 × 10⁶ ± 1.26 | 3.35 × 10⁸ ± 1.24 | 9.19 ± 0.03a | 2.36 ± 0.43a | 21.72 ± 0.26a | 5.04 ± 5.06a | 6.95 ± 1.25a | 3.09 ± 0.23a | 0.88 ± 0.07a |
| P1C | 1.49 × 10⁶ ± 1.18 | 5.68 × 10⁸ ± 1.46 | 7.78 ± 0.01b | 39.04 ± 0.40b | 31.82 ± 4.67b | 20.90 ± 0.47a | 12.63 ± 0.45a | 3.04 ± 0.74b | 0.12 ± 0.03b |
| P2W | 4.58 × 10⁴ ± 1.63 | 6.78 × 10⁵ ± 1.56 | 9.26 ± 0.04a | 4.37 ± 0.03c | 57.37 ± 0.16c | 0.71 ± 0.25a | 7.77 ± 1.40a | 37.25 ± 1.26a | 5.76 ± 0.21a |
| P2C | 1.44 × 10⁸ ± 1.24 | 4.37 × 10⁸ ± 1.13 | 8.07 ± 0.01c | 26.70 ± 0.11d | 41.33 ± 2.45d | 463.40 ± 310.99b | 128.86 ± 80.17b | 19.73 ± 6.85c | 9.32 ± 3.42b |
| L1W | 9.95 × 10⁷ ± 1.35 | 3.46 × 10⁸ ± 1.09 | 8.72 ± 0.01a | 0.93 ± 0.02a | 1.41 ± 0.03a | 2.14 ± 0.24a | 10.17 ± 0.56 | 14.33 ± 9.51a | 0.51 ± 0.21a |
| L1C | 2.69 × 10⁷ ± 1.10 | 8.66 × 10⁷ ± 1.54 | 8.97 ± 0.03b | 2.38 ± 0.07a | 1.84 ± 0.07a | 3.44 ± 2.00a | 16.46 ± 5.46 | 2.80 ± 0.97a | 11.84 ± 2.79a |
| L2W | 4.90 × 10⁶ ± 1.42 | 2.30 × 10⁸ ± 1.30 | 8.79 ± 0.01a | 34.99 ± 0.13b | 226.02 ± 1.61b | 39.88 ± 7.27b | 37.49 ± 13.98 | 3.76 ± 3.86a | 0.97 ± 0.78b |
| L2C | 4.56 × 10⁵ ± 1.25 | 5.01 × 10⁷ ± 1.11 | 9.56 ± 0.03c | 14.81 ± 7.29c | 85.28 ± 1.13c | 89.04 ± 20.76c | 42.03 ± 42.17 | 1.09 ± 0.65b | 3.09 ± 1.78a |
| X1W | 2.14 × 10⁷ ± 1.35 | 3.18 × 10⁹ ± 1.19 | 7.96 ± 0.03a | 4.94 ± 0.06a | 18.38 ± 0.19a | 10.90 ± 0.20a | 9.08 ± 0.54a | 8.65 ± 0.75a | 0.03 ± 0.01a |
| X1C | 4.01 × 10⁷ ± 1.26 | 5.16 × 10⁹ ± 1.16 | 8.15 ± 0.02b | 2.32 ± 0.17b | 19.43 ± 1.25a | 4.84 ± 0.32b | 5.79 ± 0.59b | 6.84 ± 0.28a | 0.36 ± 0.01a |
| X2W | 5.41 × 10⁷ ± 1.17 | 2.52 × 10⁹ ± 1.11 | 8.59 ± 0.02c | 5.34 ± 0.04c | 22.79 ± 0.18b | 8.28 ± 0.09c | 8.71 ± 0.67a | 9.24 ± 0.54b | 0.03 ± 0.01b |
| X2C | 5.83 × 10⁷ ± 1.15 | 2.50 × 10⁹ ± 1.14 | 8.23 ± 0.03d | 2.39 ± 0.05b | 22.54 ± 0.22b | 3.31 ± 0.36d | 6.47 ± 0.77b | 6.34 ± 0.81b | 0.25 ± 0.04c |
P, Panlong Cave; X, Xincuntun Cave; L, Luohandu Cave; 1, at the middle of the cave; 2, at the end of the cave; W, weathered rock; C, weathered crust.
USC, upland soil cluster.
Different capital letters for values from one cave show significant differences (P < 0.05) among groups based on ANOVA.
Climate factors, such as the CH4 concentrations and air temperatures, showed similar spatial variation patterns across the three caves (Fig. 1C, Table S1 in the supplemental material). The CH4 concentrations decreased from the entrance inward to the caves (Fig. 1C), whereas temperatures showed a reverse pattern (Table S1). PLD had the lowest CH4 concentration (1.03 ± 0.02 ppm [mean ± standard deviation]) at the end of the cave (Fig. 1C, Table S1). However, the variations of atmospheric CO2 concentrations did not show a consistent pattern among the three caves (Fig. 1D).
Diversity indices and microbial communities among the three karst caves.
Totals of 936,000 reads and 1,103,688 reads were obtained from pmoA gene and 16S rRNA gene amplicon sequencing, respectively, after quality control. The pmoA gene reads were clustered into 891 operational taxonomic units (OTUs) based on 95% similarity, whereas the 16S rRNA gene reads were grouped into 29,705 amplicon sequence variants (ASVs) with a 100% similarity cutoff.
Significant differences in alpha diversity indices in atmMOB and bacteria were observed in different cave samples (P < 0.05) (Fig. 2A to D). The highest Shannon indices of both atmMOB and bacteria were observed in site L1 (at the middle of Luohandu Cave) samples, whereas the Shannon indices of site L2 (at the end of Luohandu Cave) samples were the lowest (Fig. 2B and D). The community structures of atmMOB and bacteria in XCT were significantly different from those in the other two caves (Fig. 2E and F). In the principal coordinate analysis (PCoA), the PCo1 and the PCo2 axis explained 27.36% and 19.63% of the variance in the atmMOB communities of all samples (Fig. 2E) and 22.17% and 16.34% of the variance in the total bacterial communities (Fig. 2F), respectively.
FIG 2.
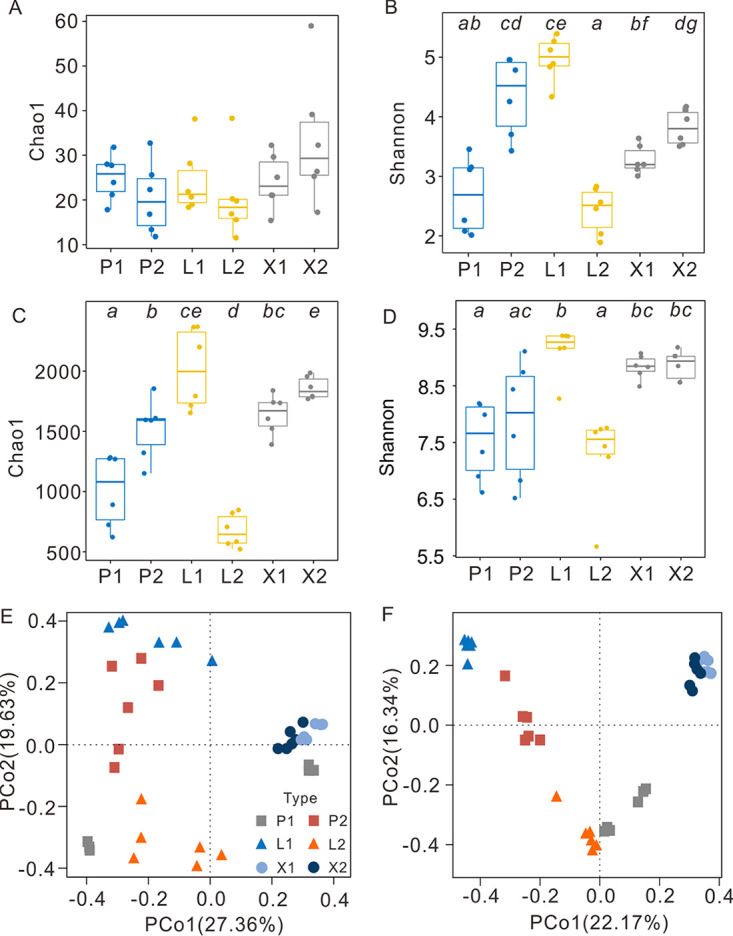
Alpha diversity and beta diversity indices of microbial communities in the three karst caves investigated in Guilin City, southwest China. (A to D) Chao1 and Shannon indices of atmMOB (atmospheric methane-oxidizing bacteria) (A, B) and the total bacterial communities (C, D) in weathered rock samples. Statistical significance, shown by different italic lowercase letters (a to e), was assessed by the Kruskal-Wallis H test (P < 0.05). Principal coordinate analysis (PCoA) plots of the atmMOB (E) and bacterial (F) community structures. P, Panlong Cave; X, Xincuntun Cave; L, Luohandu Cave; 1, sample site at the middle of the cave; P2, sample site at the end of the cave.
USCγ dominated the atmMOB communities (>60%) in all caves, except for samples from P1C (weathered crust sampling point at the middle of Panlong Cave) (Fig. 3A). The USCα and Deep-sea 2 clades were the second and third most abundant groups of atmMOBs in all samples (Fig. 3A). Members of the rice paddy cluster (RPC) were relatively abundant in L2W (weathered rock sampling point at the end of Luohandu Cave), whereas members of the Deep-sea 2 clade and tropical upland soil cluster (TUSC) (27) were relatively abundant in P1C (Fig. 3A).
FIG 3.

Microbial community structures and their correlation with environmental variables in the three karst caves in Guilin City, southwest China. Cluster analysis of the atmMOB (A) and total bacterial (B) community compositions in different niches of the three karst caves based on the Bray-Curtis distance and UPGMA method. The relative abundances of atmMOB clades (A) and bacterial orders (B) are shown using bar charts. USC, upland soil cluster; TUSC, tropical upland soil cluster; RPC, rice paddy cluster; LWs, Lake Washington sediments; JRC, Jasper Ridge cluster; FWs, freshwater sediment of Lake Wintergreen (27). (C) Genera of MOB as annotated based on 16S rRNA gene analysis from 36 samples. (D) Importance ranking (percentage of increase of mean square error [MSE]) of environmental variables as indicated by random forest machine learning. High MSE values mean more important predictors compared with low MSE values. (E) Correlation heatmap between important environmental variables and diversity indices in the three caves. The results of correlation analysis: *, 0.01 < P < 0.05; **, 0.001 < P < 0.01; ***, P < 0.001. MOB_alpha and Bac_alpha represent the Shannon indexes of atmMOB and bacteria, respectively. (F) Structural equation model of atmospheric CH4 and CO2 interactions with atmMOB and total bacterial communities in the three karst caves. Solid arrows indicate significant effect sizes (P < 0.05), the thickness of arrows indicates the strength of the relationship, and red and blue indicate positive and negative relationships, respectively. P, Panlong Cave; X, Xincuntun Cave; L, Luohandu Cave; 1, sample site at the middle of the cave; 2, sample site far from the entrance of the cave; W, weathered rock; C, weathered crust.
Quantification of USCα and USCγ using group-specific primers targeting the pmoA gene showed that USCγ, ranging from 105 copies · g−1 dry weight to 109 copies · g−1 dry weight, was more abundant than USCα (∼104 to 107 copies · g−1 dry weight) in all samples (Table 1). The USCγ abundances in XCT were higher than those in LHD and PLD, whereas the highest abundance of USCα was observed in P2C (weathered crust sampling point at the end of Panlong Cave) (1.44 × 10⁸ ± 1.24 copies g−1 dry weight) (Table 1).
For the total bacterial communities, Actinobacteria and Proteobacteria dominated in all samples at the phylum level (Table S2). Bacterial communities in XCT clustered together well, whereas bacterial communities in the PLD and LHD samples clustered according to sampling site (i.e., the middle or the end of the caves) (Fig. 3B). High proportions of unclassified bacterial taxa were observed in LHD (15.67% ± 5.31%), higher than those in PLD (9.07% ± 4.24%) and XCT (8.33 ± 0.60%) (Table S2). Actinomycetales, Chromatiales, and Acidimicrobiales were the most abundant orders in most weathered rock samples, except for P2W, in which Bdellovibrionales dominated (Fig. 3B). Within the phyla Actinobacteria and Proteobacteria, Actinobacteria and Gammaproteobacteria classes dominated in all weathered samples (Table S2). Among the three caves, USC accounted for 5.72% to 20.27% of the MOB communities, especially in XCT, accounting for 20.27% ± 2.19% (Fig. 3C, Table S2). XCT was also revealed to harbor the highest relative abundances of MOB, especially USCγ, as annotated from the known USCγ draft genome (ranging from 17% to 22%) (Fig. 3C). Moreover, Methyloceanibacter and USCα were also detected in some weathered rock samples (e.g., P1C and P2C) (Fig. 3C).
Correlations between environmental parameters and microbial communities.
CO2 and CH4 concentrations, with high increases of mean square error (MSE) values, were the most important predictors in the total environmental parameters (P < 0.001) as indicated by the random forest algorithm analysis (Fig. 3D). CH4 and CO2 concentrations were tightly linked with the community diversity and composition of atmMOB and bacteria in the karst caves (Fig. 3E). As shown by the result of structural equation model analysis, CO2 concentrations negatively affected the community structures of atmMOB (path coefficient = 0.73) and bacteria (path coefficient = 0.38). CH4 concentrations solely negatively influenced the community structures of bacterial communities (path coefficient = 0.28) (Fig. 3F). The diversity indices and community structures of atmMOB also had positive influences on those of bacteria (Fig. 3F). Moreover, the relative abundances of USCγ in atmMOB and bacterial communities connected positively with CH4 concentrations, whereas the relative abundances of USCα were negatively connected with CH4 concentrations across the three caves (Table S3). The atmMOB and total bacterial community compositions also correlated with other environmental parameters, such as pH and the concentrations of SO42− and Cl− (Table 2). The pmoA-based relative abundances of USCα and Deep-sea 2 correlated positively with Cl− and negatively with pH in all samples, whereas USCγ correlated negatively with the content of Cl− and positively with pH (Table S3). The 16S rRNA-based relative abundances of Methyloceanibacter related negatively to pH, whereas Methylomirabilis related positively to pH (Table S3). The relative abundances of USCγ correlated negatively with Cl− concentrations and positively with concentrations of CO2 and CH4 (Table S3). Methyloceanibacter relative abundances showed a positive correlation with Cl− (Table S3).
TABLE 2.
Mantel test results for the relationships between microbial communities and environmental factors in weathered rocks in karst caves in Guilin City, southwest China
| Microbial communitya | Caveb | Mantel test value (9,999 permutations)c: |
|||||||||
|---|---|---|---|---|---|---|---|---|---|---|---|
| All physicochemical parameters | Cl− | SO42− | K+ | Na+ | pH | Ca/Si | Mg/Si | CH4 | CO2 | ||
| AtmMOB | PLD | 0.43** | 0.43** | 0.80*** | −0.02 | −0.12 | 0.53** | 0.29* | 0.24 | 0.38** | 0.38** |
| LHD | 0.71*** | 0.67*** | 0.69*** | 0.38* | 0.31 | 0.004 | −0.20 | 0.59** | 0.46** | 0.46** | |
| XCT | 0.37** | 0.60*** | −0.07 | 0.62*** | 0.42** | 0.37* | −0.04 | 0.10 | 0.02 | 0.02 | |
| All caves | 0.47*** | 0.51*** | 0.24* | 0.24* | 0.11 | 0.20** | 0.27** | 0.39*** | 0.35*** | −0.06 | |
| Total bacteria | PLD | 0.45** | 0.05 | 0.71*** | 0.18 | 0.04 | 0.16 | 0.001 | 0.23 | 0.71** | 0.71** |
| LHD | 0.79*** | 0.71*** | 0.74*** | 0.50** | 0.29* | 0.06 | 0.003 | 0.57*** | 0.86** | 0.86** | |
| XCT | 0.28* | 0.43* | 0.06 | 0.56** | 0.28* | 0.17 | 0.20 | 0.16 | 0.18 | 0.18 | |
| All caves | 0.15* | 0.17* | 0.36*** | 0.15 | 0.13 | 0.14* | 0.14 | 0.17 | 0.27*** | 0.04 | |
AtmMOB, atmospheric methane-oxidizing bacteria.
PLD, Panlong Cave; LHD, Luohandu Cave; XCT, Xincuntun Cave.
Physicochemical parameters included all parameters in Table 1. Statistically significant results are in bold face: *, 0.01 < P < 0.05; **, 0.001< P < 0.01; ***, P < 0.001.
Microbial cooccurrence networks.
The network of the atmMOB communities in all samples consisted of 200 nodes and 1,861 edges, and the network of bacteria was composed of 924 nodes and 58,418 edges (Table 3). The proportions of positive interactions were much higher (96.51% for atmMOB and 99.46% for bacteria) than those of negative interactions in both atmMOB and bacterial networks (Fig. 4). The modularity values of the two networks were slightly higher than 0.4 (Table 3), and there were 11 modules in the atmMOB network and 11 modules in the bacterial network (Fig. 4). Lower average path length (APL), higher average clustering coefficient (ACC), higher density, higher average degree (AD), and higher average weighted degree values were observed in the bacterial network than in the atmMOB network (Table 3).
TABLE 3.
Topological properties of microbial cooccurrence networks in karst weathered rock, southwest China
| Microbial networka | Value forb: |
||||||||
|---|---|---|---|---|---|---|---|---|---|
| Nodes | Edges | APL | ACC | Diam | Modularity | Density | AD | AWD | |
| AtmMOB | 200 | 1,861 | 3.32 | 0.62 | 10 | 0.47 | 0.094 | 18.61 | 14.61 |
| Total bacteria | 924 | 58,418 | 3.28 | 0.73 | 9 | 0.49 | 0.14 | 126.45 | 101.94 |
AtmMOB, atmospheric methane-oxidizing bacteria.
APL, average path length; ACC, average clustering coefficient; Diam, diameter; AD, average degree; AWD, average weighted degree.
FIG 4.

Cooccurrence networks of the atmMOB (A, B) and total bacterial (C, D) communities across three karst caves are colored to show taxonomy (A, C) and modules (B, D). Each node represents an OTU (atmMOB) or an ASV (total bacteria) in the network, and the node size is proportional to the degree (connected with other nodes). Nodes with positive interactions are linked with pink edges, whereas negative interactions are linked in blue.
USCγ dominated in the atmMOB networks, accounting for 85.50% of the total nodes. The relative abundances of Deep-sea 2, JRC-3, USCα, JRC-1, and Deep-sea 4 in the atmMOB network were 8.00%, 3.00%, 2.50%, 0.50%, and 0.50%, respectively (Fig. 4A). In the bacterial network, Proteobacteria and Actinobacteria were the main phyla (Fig. 4C). Large modules (defined as modules with over 5% of the total nodes) in the network were associated with different caves (Table S4). Latescibacteria and NC10 (Methylomirabilis) were solely found in the LHD subnetwork, and Bacteroidetes was only found in the PLD subnetwork (Table S5).
The results for the within-module connectivity (Zi)–among-module connectivity (Pi) relationships among OTUs and ASVs showed that in the atmMOB network most nodes (78.50%) were peripheral atmMOB, whereas 21.00% and 0.50% of the total OTU nodes were connectors and module hubs, respectively (Fig. 5A). In the bacterial network, 6.24% of the nodes were connectors and 0.52% were module hubs (Fig. 5B). No network hubs were found in the atmMOB or bacterial networks (Fig. 5). Connectors and module hubs were defined as keystone taxa (28, 29). USCγ was the major keystone taxon (accounting for 74.42%) in the atmMOB network (Fig. 5A, Table S6). In the bacterial network, 65 keystone taxa were observed, and the most abundant ones were affiliated with the phyla Proteobacteria (Gammaproteobacteria class and USCγ group) and Actinobacteria (Gaiella and Aciditerrimonas) (Fig. 5B, Table S7). In both atmMOB and bacterial networks, the relative abundances of keystone taxa all correlated positively with the CH4 and CO2 concentrations (Fig. S1). In the bacterial network, the MOB keystone taxon Methyloceanibacter solely accounted for 1.12% of all nodes, connected with a large number of other nodes (Fig. S2). USCγ was tightly connected with other bacterial nodes, including Gaiella, Povalibacter, Bacillus, and many other unclassified genera (Fig. S2).
FIG 5.

Zi-Pi plots showing the distribution of OTUs and ASVs with their topological roles in atmMOB (A) and bacterial (B) networks of three karst caves in Guilin City, southwest China. Each dot represents an OTU in the atmMOB network or an ASV in the bacterial network. Zi, within-module connectivity; Pi, among-module connectivity.
DISCUSSION
The dominance of USC in the atmMOB communities in subterranean karst caves.
AtmMOB affiliated with USC were previously reported in various soils and were proposed to live by consumption of atmospheric CH4 (10, 14, 15). Therefore, soil has been considered the only biological sink of atmospheric CH4 in terrestrial ecosystems. Later, USCα was detected in biofilms of lava caves (12). Here, we revealed the dominance of USC in limestone and dolomite karst caves, which greatly expanded our understanding of the ecological distribution of USC in these ecosystems. Moreover, the high-throughput sequencing technique used in this study allows us to characterize the biodiversity of atmMOB in more detail. USCα, a lineage within the family Beijerinckiaceae (12, 17, 30), was mostly detected in cave ecosystems in biofilms and microbial mats from volcanic, limestone, and marble caves (12) and on weathered rocks in dolomite caves (Fig. 3A). It is worth noting that the relative abundances of USCγ assessed by pmoA gene sequencing were much higher than those of USCα in our samples (Fig. 3A), which was echoed by the results of 16S rRNA sequencing, especially in XCT (Fig. 3C). The results of the USC pmoA gene quantification showed intercave heterogeneity among the three karst caves, ranging from 104 to 109 copies · g−1 dry weight (Table 1). The USCα abundances in these karst caves were between those of forest soil and grassland soil, whereas cave USCγ abundances were higher than those in forest and grassland soils (24). The dominance of USCγ may relate closely to alkaline conditions in our karst caves (Table 1) (16), conforming to our previous assumption. In addition to USC, we also observed additional minor MOB groups in the three karst caves investigated in this study, including Deep-sea 2, as suggested by pmoA gene sequencing (Fig. 3A), and Methyloceanibacter and Methylomirabilis, based on 16S rRNA sequencing (Fig. 3C). Of note, both Deep-sea 2 and Methyloceanibacter have been reported in anoxic sediments (18, 31), which were enriched in P1C samples in this study (Fig. 3A and C). Their occurrence may be highly related to the cave temperature (18.6°C) and pH (7.78 to 9.19), which might be favorable for these groups (18, 31). Methyloceanibacter has been isolated under conditions of 18 to 27°C and pH 6.3 to 9, with ammonium as the inorganic nitrogen source (18). Another anaerobic methanotrophic group detected was Methylomirabilis (i.e., NC10), which performs methane oxidation peculiarly coupled to denitrification. Site L1 harbored abundant Methylomirabilis (Fig. 3C), possibly due to the thick layer of weathered rock at this site, which may result in an anaerobic microenvironment.
Environmental factors shape atmMOB and bacterial communities in karst caves.
pH and water gradients were the primary variables to shape MOB communities across large soil regions, whereas multiple variables, including the total nitrogen, aridity index, and mean annual temperature, affected the MOB community in small regions (11, 32). Correlations between environmental factors and MOB and total bacterial communities have been investigated in soils (11, 33), whereas such knowledge of karst caves is still scarce.
Our results showed that the pH and the CH4 concentration correlated significantly with atmMOB and other MOBs. Specifically, the relative abundances of USCγ and USCα had opposite associations with these environmental factors in the weathered rocks. The relative abundances of USCγ correlated positively but those of USCα correlated negatively with the CH4 concentration and pH (Table S3). The niche differentiation between USCγ and USCα according to pH has been well documented previously, showing that an alkaline pH favors USCγ, whereas neutral to slightly acidic conditions favor USCα (11, 24). The alkaline conditions observed in the cave samples may have resulted in the dominance of USCγ. The correlation between the relative abundance of USC and the pH further confirmed the different pH preferences of USCα and USCγ. Besides pH, we also found significant correlations between the relative abundance of USC and the CH4 concentration, as confirmed by the results of both pmoA sequencing and 16S rRNA sequencing in this study. Many studies have revealed that CH4 concentrations in karst caves are lower than in the outside atmosphere (3, 4). High CH4 concentrations were associated with increases in the USCγ relative abundances (Table S3), which might indicate that relatively high CH4 concentrations of close to 2 ppm are favorable for the growth of USCγ, especially in the X1 sampling site (Fig. 3A, Table S1). High relative abundances of USCα were observed under the low CH4 concentrations and neutral pHs at the P1C and P2C sites (Fig. 3A, Table S1), which provided suitable niches for USCα. These phenomena suggest that in addition to pH, the CH4 concentration may also drive the niche differentiation between USCγ and USCα. Excluding the CH4 concentration and pH, the CO2 concentration might also correlate positively with USCγ and negatively with USCα (Table S3). Type II MOB can fix CH4 and CO2 in the serine cycle (34). Recently, USCγ and USCα were both reported to contain genes for the serine cycle (16, 17), but USCγ might be more competitive with USCα in the cave environment of high CO2 concentrations and low [δ13C]CO2 value, especially in XCT (Table S1).
In addition to atmMOB, pH also affected the relative abundances of other MOBs, such as Methyloceanibacter and Methylomirabilis, based on the analysis of 16S rRNA sequencing (Table S3). The relative abundance of Methyloceanibacter linked negatively with pH, especially in P1C, which had the lowest pH (7.78 ± 0.01), whereas the relative abundance of Methylomirabilis correlated positively with pH and was rich in site L1 samples (pHs of 8.72 and 8.97). Methylomirabilis was mainly detected in the P2 and L1 sites, which had low CO2 concentrations, and the relative abundance of Methylomirabilis was revealed to be negatively correlated with CO2 (Table S3), suggesting that low CO2 concentrations were conducive to the subsistence of Methylomirabilis. Anaerobic MOB affiliated with Methylomirabilis have been reported to produce CO2 in the process of CH4 oxidization and to utilize CO2 in the Calvin-Benson-Bassham (CBB) cycle (35). This result suggested that anaerobic CH4 oxidization might decrease the CO2 concentration in anaerobic microenvironments of karst caves.
Cooccurrence networks are dominated by positive links and USCγ.
Cooccurrence networks can serve as a powerful tool to investigate potential ecological interactions between microbial groups in natural environments, and network analysis may help to understand meaningful structural information of complex microbial taxa (36, 37). The cooccurrence network of atmMOB and bacteria showed mostly positive correlations (96.51% in the atmMOB network and 99.46% in the bacterial network) (Fig. 4), which indicated that members of the networks would respond simultaneously to environmental fluctuations, resulting in positive feedback and cooscillation (29, 38, 39). These phenomena suggested that MOB and bacteria were all susceptible to environmental changes.
The keystone taxa in the atmMOB and bacterial networks all belonged to module hubs and connectors (Fig. 5). USCγ, accounting for 85.50% of the total keystone taxa, predominated in the atmMOB network. It is worth noting that USCγ was also identified as a keystone taxon in the bacterial network (Table S7). USCγ is recalcitrant to culture and has no isolate to date, but a draft genome of the USCγ group has been obtained from alkaline mineral cryosols (16). The draft genome demonstrated that USCγ has all of the essential genes for the complete serine biosynthesis pathway (high-affinity type II MOB) for formaldehyde assimilation and genes involving nitrogen metabolism (16). Besides USCγ, USCα is the second keystone taxon in the atmMOB network. USCα may also be capable of nitrogen fixation, and it expresses the genes for hydrogenase and carbon monoxide dehydrogenase (17). Besides USCγ, the keystone taxa in the bacterial network also included Gaiella and Aciditerrimonas (Table S7). Gaiella, within the order Gaiellales in the phylum Actinobacteria, was first reported in a deep mineral aquifer (40). Functionally, Gaiella may be involved in the reduction of nitrate to nitrite (41, 42). Aciditerrimonas can live as both a heterotroph and an autotroph. Members of this genus are capable of ferric ion reduction to facilitate autotrophic growth under anaerobic conditions (43). Notably, Aciditerrimonas was reported in neutral soil (pH of 7.45 to 7.89), which correlated positively with total nitrogen (44). A subnetwork of keystone MOB nodes also showed that USCγ might connect with other bacteria, such as Gaiella and Aciditerrimonas (Fig. S2), which may be involved in the carbon and nitrogen cycles. In addition to USCγ, Methyloceanibacter connected with many nodes, especially USCγ and many unclassified nodes (Fig. S2). This result suggested that there might be a synergistic effect among MOBs to regulate the cave CH4 cycle. Collectively, these observations indicated that the keystone taxa in the atmMOB and bacterial occurrence network, especially USC, may be not only involved in the carbon cycle but also involved in or linked with the nitrogen cycle and other metabolic pathways. These findings offer us valuable information about the ecological relevance between elemental cycles in the caves.
Conclusion.
In summary, wide distribution and dominance of high-affinity USCγ were observed for the MOB communities in subterranean karst caves, and caves offered more suitable habitats for USCγ than for USCα. Partially anoxic microniches in caves were also suitable for the growth of anaerobic MOB, especially Methylomirabilis. CH4 and CO2 concentrations, as the substrate and product of CH4 oxidation, respectively, and pH are key environmental factors affecting MOB community structure in caves. USCγ served as the keystone taxon both in the atmMOB and the overall bacterial cooccurrence networks, indicating the significance of this group in the total bacterial communities. The overwhelming dominance of positive links in the networks indicated a consistent response to environmental changes by different microbial groups and, thus, would have positive feedback in the cave ecosystem. In addition to participating in CH4 oxidation, USC in the weathered rock may also connect with multiple metabolic pathways, especially the nitrogen cycle. Our results greatly expand our knowledge about the ecological distribution of USC in natural environments and underline their significance in the consumption of atmospheric methane, supporting karst caves as another atmospheric methane sink besides soil in the terrestrial ecosystem.
MATERIALS AND METHODS
Study site description and sampling.
Guilin City in Guangxi Province is characterized by a well-developed and extensive distribution of karst physiognomy. The climate of this area is greatly influenced by subtropical monsoons, with a mean annual temperature of about 20°C and mean annual precipitation of around 1,887 mm (45, 46). Three distinct karst caves in Guilin City were selected for this study, which included Panlong Cave (PLD; 24°57′39.2″N, 110°21′17.4″E, with dripping water inside), Luohandu Cave (LHD; 25°0′55.8″N, 110°54′14.2″E, with subsurface stream and dripping water), and Xincuntun Cave (XCT; 24°58′38.5″N, 109°44′15.7″E, a dry cave without any water present during sampling) (Fig. 1A). The overlying vegetation varied from cave to cave. PLD was covered with shrubs, and the vegetation overlying LHD was dominated by arbors. In contrast, widely spaced orange trees were planted over XCT. The overlying strata of XCT were thinner (0.8 to 23 m) than those of the other two caves (PLD, 60 to 150 m; LHD, 3 to 136 m), and the well-developed cracks in the overlying rocks led to good ventilation at several sites inside the cave. The lengths of the three caves were 251 m for PLD, 356 m for LHD, and 100 m for XCT (Fig. 1C). PLD and XCT are limestone caves that developed in the Rongxian Formation of the Upper Devonian, and LHD is a dolomite cave developed in the Donggangling Formation of the Middle Devonian.
Samples were collected on 13 to 21 January 2019. At the approximate middle and the end of each cave, we sampled the weathered crust and the underlying weathered rocks on the cave wall using sterile spades. Triplicate samples of crust (C) and weathered rocks (W) were collected for each site (n = 36, contains 3 replicates). Air samples were collected with 1-liter gas sampling bags (MBT41; Dalian Hede Technologies Corporation, China). The air temperature was measured by an electronic thermometer (905-T1; Testo, Germany) while sampling. All solid samples were transported on ice to the geomicrobiology laboratory at China University of Geosciences (Wuhan) and stored at −80°C on arrival for further use.
Physiochemical analysis.
All solid samples (n = 36, contains 3 replicates) were freeze-dried (Alpha 1-2 LD freeze-dryer; Martin Christ, Osterode am Harz, Germany) and passed through a sterile 2-mm sieve. The sieved samples were mixed with ultrapure water (1:5, wt/vol) to get a suspension. The supernatant pH of the suspension was determined using a multiparameter water quality detector (Hach, Loveland, CO, USA) (25). Dissolved anions and cations were measured with anionic chromatography (ICS-600; Thermo Scientific, USA) and inductively coupled plasma-optical emission spectrometry (ICP-OES) (iCAP 7600+; Thermo, USA), respectively, after filtration with 0.22-μm filters (47). The concentrations of CH4 and CO2 gases and the carbon isotope of CO2 ([δ13C]CO2) of cave air samples were measured by a high-precision carbon isotope analyzer (G2201-I; Picarro, USA) using cavity decay spectroscopy (cavity ring-down spectroscopy [CRDS]) (5) at the Institute of Karst Geology, Chinese Academy of Geological Sciences.
DNA extraction, gene amplification, and sequencing.
An aliquot of 0.5 g of freeze-dried solid samples was used for DNA extraction with a DNeasy PowerSoil kit (12888-100; Qiagen, Germany) according to the manufacturer’s instructions. The concentration and quality of DNA were measured by a Nanodrop 2000 spectrophotometer (ND2000; Thermo Scientific, USA) and visualized by 2% agarose gel electrophoresis. Due to the dominance of USCγ in MOB via clone library construction with the primer set A189/mb661 in the Heshang Cave (22), the specific primer set A189f/A650r for the pmoA gene of atmMOB (21) and the 338F/806R primer set (48, 49) for bacterial V3-V4 16S rRNA were used, respectively. The resulting amplicons were sequenced on the Illumina MiSeq platform with a paired-end 250-bp (PE250) (for bacteria) and a PE300 (for pmoA gene) strategy at Shanghai Personal Biotechnology, Co., Ltd., Shanghai, China. All raw sequence reads were deposited in the National Omics Data Encyclopedia (NODE; https://www.biosino.org/node) with the project numbers OER094486 (for bacteria) and OER094488 (for MOB).
pmoA gene quantification.
The absolute abundance of atmospheric methane-oxidizing bacteria (atmMOB) was measured by quantitative PCR (qPCR) to estimate the potency of atmMOB. The gene abundances of USCγ and USCα were determined using primer sets A189/gam634r (50) and A189/forest675r (51) and the TB Green system (RR820A; TaKaRa, Japan) with a real-time PCR detection system (CFX96; Bio-Rad, USA). All reactions were performed in triplicate in 20-μl volumes containing 1 μl template DNA, 10 μl 2× TB Green master mixture (RR820A; TaKaRa, Japan), 0.5 μl forward primer (10 μM), 0.5 μl reverse primer (10 μM), 3.2 μl 25 mM MgCl2, and 4.8 μl RNase-free water (H9012; TaKaRa, Japan). Standard curves were constructed with plasmid containing the target gene fragment, diluted to 109 to 103 gene copies · μl−1. The thermal cycling steps to determine USC gene abundance followed the protocols described previously in references 50 and 51, except that the annealing temperatures were 64°C for USCα and 64.5°C for USCγ. Triplicate PCRs were done for each of the triplicate environmental samples to quantify the pmoA gene abundances of the USC clades (n = 108, contains 9 replicates). The results of qPCR were expressed as gene copy numbers per gram dry weight (copies · g−1 dry weight). The average R2 of the standard curve was 0.997, and the amplification efficiency was within the range of 95% to 105%.
Sequencing data processing.
For the pmoA and 16S rRNA genes, raw sequencing data were processed via the bcl2fastq software (version 1.8.4, Illumina) for primer cutting and barcode removal. The processed sequences were subsequently filtered and analyzed by QIIME 2 (Quantitative Insight Into Microbial Ecology; version 2019.7) (52). The sequence processing and removal of chimeric sequences of the pmoA gene were performed by VSEARCH (version 2.8.1) (53). The unique sequences were clustered at 95% sequence similarity to generate representative OTU sequences and an OTU table, and then all these 95%-level sequences were translated to amino acid sequences. The pmoA amino acid annotation was performed in BLAST 2.10.0+ (54) with an in-house-built database based on published data (11, 55, 56). 16S rRNA sequences were quality filtered with Q30, and chimeras were removed with the DADA2 plugin. Subsequently, representative amplicon sequence variant (ASV) sequences and a feature table were generated. Feature taxonomy of the 16S rRNA gene was assigned against a published database containing the sequences of atmMOB (10). All samples were resampled to the same level of sequencing to avoid the impact of sequencing depth on identifying microbial communities. Diversity indices included alpha diversity and beta diversity, and phylogenic trees (unrooted and rooted trees) were constructed in QIIME 2.
Statistical analysis.
Spearman’s rho correlation, Pearson correlation, the Kruskal-Wallis H test, and analysis of variance (ANOVA) in SPSS Statistics (version 26.0) were used to investigate the correlations between environmental variables and communities and distinguish the differences in physicochemical parameters among different caves. Principal coordinate analysis (PCoA) and the Mantel test, both based on Bray-Curtis dissimilarities, were conducted with the vegan (57) package. The box plots of alpha diversity, linear relationship, and differential analysis of 16S rRNA and pmoA genes were analyzed and visualized with the ggpubr (58) and ggplot2 (59) packages of R software (version 3.6.1). Structural equation modeling was conducted with the AMOS (analysis of moment structures) software (version 25.0). Correlation heatmaps were analyzed and visualized with the corrplot package (60). The combination chart of stacked-bar and clustering tree-based unweighted pair group method using arithmetic average (UPGMA) was analyzed and visualized in R software. Random forest machine learning was performed with randomForest (61), A3 (62), and rfPermute (63) packages in R to explore the impacts of environmental variables in different caves.
Cooccurrence networks were constructed with Hmisc (64) and igraph (65) packages in R. To reduce the complexity, OTUs and ASVs that had relative abundances above 0.1% and more than 20% occurrence in all samples were selected for network analysis. Spearman’s correlation was calculated to explore the correlations among bacterial ASVs and atmMOB pmoA OTUs, with a correlation coefficient ρ of ≥0.7 and P value of <0.05 (Benjamini and Hochberg method adjusted). Networks were visualized with the Fruchterman-Reingold layout in Gephi (version 0.9.2) software (66). Within-module connectivity (Zi) and among-module connectivity (Pi) thresholds were used to classify the ecological roles of individual nodes in the network (67). Briefly, all nodes were classified into four groups: peripherals (Zi ≤ 2.5 and Pi ≤ 0.62), connectors (Zi ≤ 2.5 and Pi > 0.62), module hubs (Zi > 2.5 and Pi ≤ 0.62), and network hubs (Zi > 2.5 and Pi > 0.62) (68). Theoretically, connectors, module hubs, and network hubs were considered keystone taxa in the network (28, 69).
ACKNOWLEDGMENTS
This work was jointly supported by the National Natural Science Foundation of China (grant number 91951208), the Natural Science Foundation of Guangxi (grant number 2020GXNSFAA297025), and the Geological Survey Project of China (grant number DD20190343).
We thank Yu-Yang Song, Jing Cao, and Xuan Qiu from China University of Geosciences, and Xia Wu and Qi-Bo Huang from Chinese Academy of Geological Sciences for their assistance in the fieldwork in Guilin City. We thank Xing Xiang from Shangrao Normal University for providing guidance in the construction of the MOB database.
Footnotes
Supplemental material is available online only.
Contributor Information
Hong-Mei Wang, Email: wanghmei04@163.com.
Jeffrey A. Gralnick, University of Minnesota
REFERENCES
- 1.Gabriel CR, Northup DE. 2013. Microbial ecology: caves as an extreme habitat, p 85–108. In Cheeptham N (ed), Cave microbiomes: a novel resource for drug discovery. SpringerBriefs in Microbiology, vol 1. Springer, New York, NY. [Google Scholar]
- 2.Pedersen K. 2000. Exploration of deep intraterrestrial microbial life: current perspectives. FEMS Microbiol Lett 185:9–16. doi: 10.1111/j.1574-6968.2000.tb09033.x. [DOI] [PubMed] [Google Scholar]
- 3.Ojeda L, Vadillo I, Etiope G, Benavente J, Liñán C, del Rosal Y, Tapia ST, Moríñigo MÁ, Carrasco F. 2019. Methane sources and sinks in karst systems: the Nerja cave and its vadose environment (Spain). Geochim Cosmochim Acta 259:302–315. doi: 10.1016/j.gca.2019.06.011. [DOI] [Google Scholar]
- 4.Webster KD, Drobniak A, Etiope G, Mastalerz M, Sauer PE, Schimmelmann A. 2018. Subterranean Karst environments as a global sink for atmospheric methane. Earth Planet Sci Lett 485:9–18. doi: 10.1016/j.epsl.2017.12.025. [DOI] [Google Scholar]
- 5.Fernandez-Cortes A, Cuezva S, Alvarez-Gallego M, Garcia-Anton E, Pla C, Benavente D, Jurado V, Saiz-Jimenez C, Sanchez-Moral S. 2015. Subterranean atmospheres may act as daily methane sinks. Nat Commun 6:7003. doi: 10.1038/ncomms8003. [DOI] [PubMed] [Google Scholar]
- 6.Mattey DP, Fisher R, Atkinson TC, Latin J-P, Durrell R, Ainsworth M, Lowry D, Fairchild IJ. 2013. Methane in underground air in Gibraltar karst. Earth Planet Sci Lett 374:71–80. doi: 10.1016/j.epsl.2013.05.011. [DOI] [Google Scholar]
- 7.Lennon JT, Nguyễn-Thùy D, Phạm TM, Drobniak A, Tạ PH, Phạm NÐ, Streil T, Webster KD, Schimmelmann A. 2017. Microbial contributions to subterranean methane sinks. Geobiology 15:254–258. doi: 10.1111/gbi.12214. [DOI] [PubMed] [Google Scholar]
- 8.Webster KD, Mirza A, Deli JM, Sauer PE, Schimmelmann A. 2016. Consumption of atmospheric methane in a limestone cave in Indiana, USA. Chem Geol 443:1–9. doi: 10.1016/j.chemgeo.2016.09.020. [DOI] [Google Scholar]
- 9.Kolb S. 2009. The quest for atmospheric methane oxidizers in forest soils. Environ Microbiol Rep 1:336–346. doi: 10.1111/j.1758-2229.2009.00047.x. [DOI] [PubMed] [Google Scholar]
- 10.Cai Y, Zhou X, Shi L, Jia Z. 2020. Atmospheric methane oxidizers are dominated by upland soil cluster alpha in 20 forest soils of China. Microb Ecol 80:859–871. doi: 10.1007/s00248-020-01570-1. [DOI] [PubMed] [Google Scholar]
- 11.Deng Y, Che R, Wang F, Conrad R, Dumont M, Yun J, Wu Y, Hu A, Fang J, Xu Z, Cui X, Wang Y. 2019. Upland soil cluster gamma dominates methanotrophic communities in upland grassland soils. Sci Total Environ 670:826–836. doi: 10.1016/j.scitotenv.2019.03.299. [DOI] [PubMed] [Google Scholar]
- 12.Pratscher J, Vollmers J, Wiegand S, Dumont MG, Kaster AK. 2018. Unravelling the identity, metabolic potential and global biogeography of the atmospheric methane-oxidizing upland soil cluster alpha. Environ Microbiol 20:1016–1029. doi: 10.1111/1462-2920.14036. [DOI] [PMC free article] [PubMed] [Google Scholar]
- 13.Cai Y, Jia Z. 2014. Research progress of atmospheric methane oxidizers in soil. Wei Sheng Wu Xue Bao 54:841–853. [PubMed] [Google Scholar]
- 14.Knief C. 2015. Diversity and habitat preferences of cultivated and uncultivated aerobic methanotrophic bacteria evaluated based on pmoA as molecular marker. Front Microbiol 6:1346. doi: 10.3389/fmicb.2015.01346. [DOI] [PMC free article] [PubMed] [Google Scholar]
- 15.Knief C, Lipski A, Dunfield PF. 2003. Diversity and activity of methanotrophic bacteria in different upland soils. Appl Environ Microbiol 69:6703–6714. doi: 10.1128/AEM.69.11.6703-6714.2003. [DOI] [PMC free article] [PubMed] [Google Scholar]
- 16.Edwards CR, Onstott TC, Miller JM, Wiggins JB, Wang W, Lee CK, Cary SC, Pointing SB, Lau MCY. 2017. Draft genome sequence of uncultured upland soil cluster Gammaproteobacteria gives molecular insights into high-affinity methanotrophy. Genome Announc 5:e00047-17. doi: 10.1128/genomeA.00047-17. [DOI] [PMC free article] [PubMed] [Google Scholar]
- 17.Tveit AT, Hestnes AG, Robinson SL, Schintlmeister A, Dedysh SN, Jehmlich N, von Bergen M, Herbold C, Wagner M, Richter A, Svenning MM. 2019. Widespread soil bacterium that oxidizes atmospheric methane. Proc Natl Acad Sci USA 116:8515–8524. doi: 10.1073/pnas.1817812116. [DOI] [PMC free article] [PubMed] [Google Scholar]
- 18.Vekeman B, Kerckhof F-M, Cremers G, de Vos P, Vandamme P, Boon N, Op den Camp HJM, Heylen K. 2016. New Methyloceanibacter diversity from North Sea sediments includes methanotroph containing solely the soluble methane monooxygenase. Environ Microbiol 18:4523–4536. doi: 10.1111/1462-2920.13485. [DOI] [PubMed] [Google Scholar]
- 19.Vorobev AV, Baani M, Doronina NV, Brady AL, Liesack W, Dunfield PF, Dedysh SN. 2011. Methyloferula stellata gen. nov., sp. nov., an acidophilic, obligately methanotrophic bacterium that possesses only a soluble methane monooxygenase. Int J Syst Evol Microbiol 61:2456–2463. doi: 10.1099/ijs.0.028118-0. [DOI] [PubMed] [Google Scholar]
- 20.Theisen AR, Ali MH, Radajewski S, Dumont MG, Dunfield PF, McDonald IR, Dedysh SN, Miguez CB, Murrell JC. 2005. Regulation of methane oxidation in the facultative methanotroph Methylocella silvestris BL2. Mol Microbiol 58:682–692. doi: 10.1111/j.1365-2958.2005.04861.x. [DOI] [PubMed] [Google Scholar]
- 21.Bourne DG, McDonald IR, Murrell JC. 2001. Comparison of pmoA PCR primer sets as tools for investigating Methanotroph diversity in three Danish soils. Appl Environ Microbiol 67:3802–3809. doi: 10.1128/AEM.67.9.3802-3809.2001. [DOI] [PMC free article] [PubMed] [Google Scholar]
- 22.Zhao R, Wang H, Cheng X, Yun Y, Qiu X. 2018. Upland soil cluster γ dominates the methanotroph communities in the karst Heshang Cave. FEMS Microbiol Ecol 94. doi: 10.1093/femsec/fiy192. [DOI] [PubMed] [Google Scholar]
- 23.Kou Y, Wei K, Li C, Wang Y, Tu B, Wang J, Li X, Yao M. 2020. Deterministic processes dominate soil methanotrophic community assembly in grassland soils. Geoderma 359:114004. doi: 10.1016/j.geoderma.2019.114004. [DOI] [Google Scholar]
- 24.Taumer J, Kolb S, Boeddinghaus RS, Wang H, Schoning I, Schrumpf M, Urich T, Marhan S. 2021. Divergent drivers of the microbial methane sink in temperate forest and grassland soils. Glob Change Biol 27:929–940. doi: 10.1111/gcb.15430. [DOI] [PubMed] [Google Scholar]
- 25.Yun Y, Wang H, Man B, Xiang X, Zhou J, Qiu X, Duan Y, Engel AS. 2016. The relationship between pH and bacterial communities in a single karst ecosystem and its implication for soil acidification. Front Microbiol 7:1955. doi: 10.3389/fmicb.2016.01955. [DOI] [PMC free article] [PubMed] [Google Scholar]
- 26.Zeng L, Tian J, Chen H, Wu N, Yan Z, Du L, Shen Y, Wang X. 2019. Changes in methane oxidation ability and methanotrophic community composition across different climatic zones. J Soils Sediments 19:533–543. doi: 10.1007/s11368-018-2069-1. [DOI] [Google Scholar]
- 27.Lüke C, Frenzel P. (2011). Potential of pmoA amplicon pyrosequencing for methanotroph diversity studies. Appl Environ Microbiol 77:6305–6309. [DOI] [PMC free article] [PubMed]
- 28.Fan K, Weisenhorn P, Gilbert JA, Chu H. 2018. Wheat rhizosphere harbors a less complex and more stable microbial co-occurrence pattern than bulk soil. Soil Biol Biochem 125:251–260. doi: 10.1016/j.soilbio.2018.07.022. [DOI] [Google Scholar]
- 29.Fan K, Weisenhorn P, Gilbert JA, Shi Y, Bai Y, Chu H. 2018. Soil pH correlates with the co-occurrence and assemblage process of diazotrophic communities in rhizosphere and bulk soils of wheat fields. Soil Biol Biochem 121:185–192. doi: 10.1016/j.soilbio.2018.03.017. [DOI] [Google Scholar]
- 30.Rusley C, Onstott TC, Vishnivetskaya TA, Layton A, Chauhan A, Pfiffner SM, Whyte LG, Lau MCY. 2019. Metagenome-assembled genome of USCα AHI, a potential high-affinity methanotroph from Axel Heiberg Island, Canadian high Arctic. Microbiol Resour Announc 8:e01178-19. doi: 10.1128/MRA.01178-19. [DOI] [PMC free article] [PubMed] [Google Scholar]
- 31.McDonald IR, Smith K, Lidstrom ME. 2005. Methanotrophic populations in estuarine sediment from Newport Bay, California. FEMS Microbiol Lett 250:287–293. doi: 10.1016/j.femsle.2005.07.016. [DOI] [PubMed] [Google Scholar]
- 32.Zhang L, Adams JM, Dumont MG, Li Y, Shi Y, He D, He J-S, Chu H. 2019. Distinct methanotrophic communities exist in habitats with different soil water contents. Soil Biol Biochem 132:143–152. doi: 10.1016/j.soilbio.2019.02.007. [DOI] [Google Scholar]
- 33.Chu H, Gao GF, Ma Y, Fan K, Delgado-Baquerizo M. 2020. Soil microbial biogeography in a changing world: recent advances and future perspectives. mSystems 5:e00803-19. doi: 10.1128/mSystems.00803-19. [DOI] [PMC free article] [PubMed] [Google Scholar]
- 34.van Winden JF, Kip N, Reichart G-J, Jetten MSM, Camp H, Damsté JSS. 2010. Lipids of symbiotic methane-oxidizing bacteria in peat moss studied using stable carbon isotopic labelling. Org Geochem 41:1040–1044. doi: 10.1016/j.orggeochem.2010.04.015. [DOI] [Google Scholar]
- 35.Wu ML, Ettwig KF, Jetten MS, Strous M, Keltjens JT, van Niftrik L. 2011. A new intra-aerobic metabolism in the nitrite-dependent anaerobic methane-oxidizing bacterium Candidatus “Methylomirabilis oxyfera”. Biochem Soc Trans 39:243–248. doi: 10.1042/BST0390243. [DOI] [PubMed] [Google Scholar]
- 36.Barberán A, Bates ST, Casamayor EO, Fierer N. 2012. Using network analysis to explore co-occurrence patterns in soil microbial communities. ISME J 6:343–351. doi: 10.1038/ismej.2011.119. [DOI] [PMC free article] [PubMed] [Google Scholar]
- 37.Berry D, Widder S. 2014. Deciphering microbial interactions and detecting keystone species with co-occurrence networks. Front Microbiol 5:219. doi: 10.3389/fmicb.2014.00219. [DOI] [PMC free article] [PubMed] [Google Scholar]
- 38.de Vries FT, Griffiths RI, Bailey M, Craig H, Girlanda M, Gweon HS, Hallin S, Kaisermann A, Keith AM, Kretzschmar M, Lemanceau P, Lumini E, Mason KE, Oliver A, Ostle N, Prosser JI, Thion C, Thomson B, Bardgett RD. 2018. Soil bacterial networks are less stable under drought than fungal networks. Nat Commun 9:3033. doi: 10.1038/s41467-018-05516-7. [DOI] [PMC free article] [PubMed] [Google Scholar]
- 39.Hernandez DJ, David AS, Menges ES, Searcy CA, Afkhami ME. 2021. Environmental stress destabilizes microbial networks. ISME J 15:1722–1734. doi: 10.1038/s41396-020-00882-x. [DOI] [PMC free article] [PubMed] [Google Scholar]
- 40.Albuquerque L, França L, Rainey FA, Schumann P, Nobre MF, da Costa MS. 2011. Gaiella occulta gen. nov., sp. nov., a novel representative of a deep branching phylogenetic lineage within the class Actinobacteria and proposal of Gaiellaceae fam. nov. and Gaiellales ord. nov. Syst Appl Microbiol 34:595–599. doi: 10.1016/j.syapm.2011.07.001. [DOI] [PubMed] [Google Scholar]
- 41.Akiyama M, Shimizu S, Sakai T, Ioka S, Ishijima Y, Naganuma T. 2010. Spatiotemporal variations in the abundances of the prokaryotic rRNA genes, pmoA, and mcrA in the deep layers of a peat bog in Sarobetsu-genya wetland, Japan. Limnology 12:1–9. [Google Scholar]
- 42.Liu P, Jia S, He X, Zhang X, Ye L. 2017. Different impacts of manure and chemical fertilizers on bacterial community structure and antibiotic resistance genes in arable soils. Chemosphere 188:455–464. doi: 10.1016/j.chemosphere.2017.08.162. [DOI] [PubMed] [Google Scholar]
- 43.Itoh T, Yamanoi K, Kudo T, Ohkuma M, Takashina T. 2011. Aciditerrimonas ferrireducens gen. nov., sp. nov., an iron-reducing thermoacidophilic actinobacterium isolated from a solfataric field. Int J Syst Evol Micr 61:1281–1285. doi: 10.1099/ijs.0.023044-0. [DOI] [PubMed] [Google Scholar]
- 44.Shi P, Zhang Y, Hu Z, Ma K, Wang H, Chai T. 2017. The response of soil bacterial communities to mining subsidence in the west China aeolian sand area. Appl Soil Ecol 121:1–10. doi: 10.1016/j.apsoil.2017.09.020. [DOI] [Google Scholar]
- 45.Guo X, Jiang G, Gong X, Yin J, Wu X. 2015. Recharge processes on typical karst slopes implied by isotopic and hydrochemical indexes in Xiaoyan Cave, Guilin, China. J Hydrol 530:612–622. doi: 10.1016/j.jhydrol.2015.09.065. [DOI] [Google Scholar]
- 46.Yu G, Li Y, Cai J, Yu D, Tang J, Zhai W, Wei Y, Chen S, Chen Q, Qin J. 2019. Short-term effects of meteorological factors and air pollution on childhood hand-foot-mouth disease in Guilin, China. Sci Total Environ 646:460–470. doi: 10.1016/j.scitotenv.2018.07.329. [DOI] [PubMed] [Google Scholar]
- 47.Cheng X, Yun Y, Wang H, Ma L, Tian W, Man B, Liu C. 2021. Contrasting bacterial communities and their assembly processes in karst soils under different land use. Sci Total Environ 751:142263. doi: 10.1016/j.scitotenv.2020.142263. [DOI] [PubMed] [Google Scholar]
- 48.Huse SM, Dethlefsen L, Huber JA, Mark Welch D, Welch DM, Relman DA, Sogin ML. 2008. Exploring microbial diversity and taxonomy using SSU rRNA hypervariable tag sequencing. PLoS Genet 4:e1000255. doi: 10.1371/journal.pgen.1000255. [DOI] [PMC free article] [PubMed] [Google Scholar]
- 49.Caporaso JG, Lauber CL, Walters WA, Berg-Lyons D, Lozupone CA, Turnbaugh PJ, Fierer N, Knight R. 2011. Global patterns of 16S rRNA diversity at a depth of millions of sequences per sample. Proc Natl Acad Sci USA 108(Suppl 1):4516–4522. doi: 10.1073/pnas.1000080107. [DOI] [PMC free article] [PubMed] [Google Scholar]
- 50.Kolb S, Knief C, Dunfield PF, Conrad R. 2005. Abundance and activity of uncultured methanotrophic bacteria involved in the consumption of atmospheric methane in two forest soils. Environ Microbiol 7:1150–1161. doi: 10.1111/j.1462-2920.2005.00791.x. [DOI] [PubMed] [Google Scholar]
- 51.Kolb S, Knief C, Stubner S, Conrad R. 2003. Quantitative detection of methanotrophs in soil by novel pmoA-targeted real-time PCR assays. Appl Environ Microbiol 69:2423–2429. doi: 10.1128/AEM.69.5.2423-2429.2003. [DOI] [PMC free article] [PubMed] [Google Scholar]
- 52.Bolyen E, Rideout JR, Dillon MR, Bokulich NA, Abnet CC, Al-Ghalith GA, Alexander H, Alm EJ, Arumugam M, Asnicar F, Bai Y, Bisanz JE, Bittinger K, Brejnrod A, Brislawn CJ, Brown CT, Callahan BJ, Caraballo-Rodríguez AM, Chase J, Cope EK, Da Silva R, Diener C, Dorrestein PC, Douglas GM, Durall DM, Duvallet C, Edwardson CF, Ernst M, Estaki M, Fouquier J, Gauglitz JM, Gibbons SM, Gibson DL, Gonzalez A, Gorlick K, Guo J, Hillmann B, Holmes S, Holste H, Huttenhower C, Huttley GA, Janssen S, Jarmusch AK, Jiang L, Kaehler BD, Kang KB, Keefe CR, Keim P, Kelley ST, Knights D, et al. 2019. Reproducible, interactive, scalable and extensible microbiome data science using QIIME 2. Nat Biotechnol 37:852–857. doi: 10.1038/s41587-019-0209-9. [DOI] [PMC free article] [PubMed] [Google Scholar]
- 53.Rognes T, Flouri T, Nichols B, Quince C, Mahe F. 2016. VSEARCH: a versatile open source tool for metagenomics. PeerJ 4:e2584. doi: 10.7717/peerj.2584. [DOI] [PMC free article] [PubMed] [Google Scholar]
- 54.Altschul SF, Madden TL, Schäffer AA, Zhang J, Zhang Z, Miller W, Lipman DJ. 1997. Gapped BLAST and PSI-BLAST: a new generation of protein database search programs. Nucleic Acids Res 25:3389–3402. doi: 10.1093/nar/25.17.3389. [DOI] [PMC free article] [PubMed] [Google Scholar]
- 55.Chiri E, Nauer PA, Rainer EM, Zeyer J, Schroth MH. 2017. High temporal and spatial variability of atmospheric-methane oxidation in alpine glacier forefield soils. Appl Environ Microbiol 83:e01139-17. doi: 10.1128/AEM.01139-17. [DOI] [PMC free article] [PubMed] [Google Scholar]
- 56.Martineau C, Pan Y, Bodrossy L, Yergeau E, Whyte LG, Greer CW. 2014. Atmospheric methane oxidizers are present and active in Canadian high Arctic soils. FEMS Microbiol Ecol 89:257–269. doi: 10.1111/1574-6941.12287. [DOI] [PubMed] [Google Scholar]
- 57.Oksanen J, Kindt R, Legendre P, O’Hara B, Simpson GL, Solymos P, Stevens MHH, Wagner H. 2007. The vegan package: community ecology package. https://www.researchgate.net/profile/Gavin-Simpson-2/publication/228339454_The_vegan_Package/links/0912f50be86bc29a7f000000/The-vegan-Package.pdf.
- 58.Kassambara A. 2020. ggpubr: ‘ggplot2’ based publication ready plots. R package version 040. https://mran.microsoft.com/snapshot/2017-04-22/web/packages/ggpubr/ggpubr.pdf.
- 59.Gómez-Rubio V. 2017. ggplot2—elegant graphics for data analysis (2nd edition.). J Stat Softw 77:1–3. doi: 10.18637/jss.v077.b02. [DOI] [Google Scholar]
- 60.Wei T, Simko V, Levy M, Xie Y, Jin Y, Zemla J. 2017. Package ‘corrplot’. Statistician 56:e24. http://brieger.esalq.usp.br/CRAN/web/packages/corrplot/corrplot.pdf. [Google Scholar]
- 61.Liaw A, Wiener M. 2002. Classification and regression by randomForest. R news 2:18–22. https://cogns.northwestern.edu/cbmg/LiawAndWiener2002.pdf.
- 62.Fortmann-Roe S. 2015. Consistent and clear reporting of results from diverse modeling techniques: the A3 method. J Stat Softw 66:1–23. doi: 10.18637/jss.v066.i07. [DOI] [Google Scholar]
- 63.Archer E. 2020. Estimate permutation p-values for random forest importance metrics. Package ‘rfPermute’. https://cran.ism.ac.jp/web/packages/rfPermute/rfPermute.pdf.
- 64.Harrell FE, Jr, Dupont MC. 2019. Package ‘hmisc’. CRAN2018, 235–236. https://cran.uib.no/web/packages/Hmisc/Hmisc.pdf.
- 65.Csárdi G, Nepusz T. 2006. The igraph software package for complex network research. Int J Complex Syst 2006:1695. [Google Scholar]
- 66.Bastian M, Heymann S, Jacomy M. 2009. Gephi: an open source software for exploring and manipulating networks, p 361–362. In Proceedings of the Third International AAAI Conference on Weblogs and Social Media. Association for the Advancement of Artificial Intelligence, Palo Alto, CA. [Google Scholar]
- 67.Guimerà R, Amaral LAN. 2005. Functional cartography of complex metabolic networks. Nature 433:895–900. doi: 10.1038/nature03288. [DOI] [PMC free article] [PubMed] [Google Scholar]
- 68.Olesen JM, Bascompte J, Dupont YL, Jordano P. 2007. The modularity of pollination networks. Proc Natl Acad Sci USA 104:19891–19896. doi: 10.1073/pnas.0706375104. [DOI] [PMC free article] [PubMed] [Google Scholar]
- 69.Zhou J, Deng Y, Luo F, He Z, Tu Q, Zhi X. 2010. Functional molecular ecological networks. mBio 1:e00169-10. doi: 10.1128/mBio.00169-10. [DOI] [PMC free article] [PubMed] [Google Scholar]
Associated Data
This section collects any data citations, data availability statements, or supplementary materials included in this article.
Supplementary Materials
Supplemental material. Download SPECTRUM00820-21_Supp_1_seq12.pdf, PDF file, 0.7 MB (685.7KB, pdf)