

Abstract
P450 and heme oxygenase-1 (HO-1) receive their necessary electrons by interaction with the NADPH-cytochrome P450 reductase (POR). As the POR concentration is limiting when compared to P450 and HO-1, they must effectively compete for POR to function. In addition to these functionally required protein-protein interactions, HO-1 forms homomeric complexes, and several P450s have been shown to form complexes with themselves and with other P450s, raising the question, “How are the HO-1 and P450 systems organized in the endoplasmic reticulum?” Recently, CYP1A2 was shown to associate with HO-1 affecting the function of both proteins. The goal of this study was to determine if CYP1A1 formed complexes with HO-1 in a similar manner. Complex formation among POR, HO-1, and CYP1A1 was measured using bioluminescence resonance energy transfer, with results showing HO-1 and CYP1A1 form a stable complex that was further stabilized in the presence of POR. The POR•CYP1A1 complex was readily disrupted by the addition of HO-1. CYP1A1 also was able to affect the POR•HO-1 complex, although the effect was smaller. This interaction between CYP1A1 and HO-1 also affected function, where the presence of CYP1A1 inhibited HO-1-mediated bilirubin formation by increasing the KmPOR•HO-1 without affecting the Vmaxapp. In like manner, HO-1 inhibited CYP1A1-mediated 7-ethoxyresorufin dealkylation by increasing the KmPOR•CYP1A1. Based on mathematical simulation, the results could not be explained by a model where CYP1A1 and HO-1 simply compete for POR, and are consistent with formation of a stable CYP1A1•HO-1 complex that affected the functional characteristics of both moieties.
Keywords: Cytochrome P450, heme oxygenase-1 (HO-1), protein-protein interaction, bioluminescence resonance energy transfer (BRET), membrane protein, structure-function, electron transfer, NADPH-cytochrome P450 reductase, CYP1A1
INTRODUCTION
As members of the CYP1A subfamily, CYP1A1 and CYP1A2 have similar amino acid sequences (80% identical) and induction of both enzymes is mediated by the aryl hydrocarbon receptor [1, 2]. Some conserved CYP1 family-specific residues are responsible for forming a small, planar active site [3], leading to both P450s sharing many of the same substrates and inhibitors [4]. Despite their high degree of sequence similarity, differences in these proteins have been observed. CYP1A1 is constitutively expressed extrahepatically at low levels, with induction required for more substantial expression in tissues such as the lung [5], liver [6, 7], skin [8], or intestine [9, 10]. In contrast, CYP1A2 is expressed in the liver [2].
Class 2 P450 enzymes require an interaction with the flavoprotein NADPH-cytochrome P450 reductase (POR) in order to function in an NADPH-dependent reaction. POR and P450s form a 1:1 functional complex that occurs within a region of the protein that is proximal to the heme of the P450 molecule. As the total concentration of the expressed P450s exceed that of POR in most tissues [11–13], each of the P450s must effectively compete for POR or be functionally silent. These interactions become more complex when considering the potential for the levels of several of these proteins to be regulated by exogenous chemicals. These characteristics raise continued questions regarding how the P450 system proteins are organized in the endoplasmic reticulum (ER).
As part of these studies, we examined the potential of P450 enzymes to form complexes with each other. Our initial results showed that CYP1A2 and CYP2B4 form a high affinity complex that is stable in the presence of POR [14–18]. Interestingly, formation of the heteromeric complex leads to the selective binding of POR to the CYP1A2 moiety of the CYP1A2•CYP2B4 complex, leading to stimulation of CYP1A2 and inhibition of CYP2B4 activities [16–18]. Subsequent reports have shown the formation of both homomeric [19–24] and heteromeric [14, 16–18, 23, 25–34] complexes with several different P450 enzymes.
Heme oxygenase-1 (HO-1) is another heme-containing protein that is found in the ER [35], although in this case, the heme serves as a substrate rather than a prosthetic group. It is responsible for the first step of heme catabolism. An interesting feature of the enzyme is related to its inducibility, as enzyme levels in most tissues are negligible at baseline, with exposure to numerous compounds and oxidative stress leading to HO-1 expression [36]. Generally, HO-1 provides a protective function for cells during inflammatory stress, not only by decreasing the proinflammatory free heme [37–39], but also by generating CO and bilirubin, which have antioxidant properties [40–43]. Therefore, HO-1 functions in vivo not only in heme degradation, but also in a cytoprotective role when organisms are exposed to radical-generating agents [37]. However, HO-1 does not function alone; it also requires a physical interaction with POR in order to function.
As both P450s and HO-1 co-reside in the ER membrane, and must compete for limiting POR to function, our interest turned toward the potential for P450s and HO-1 to form complexes that may affect protein function. This is particularly relevant due to the inducibility of both HO-1 and the P450s to such an extent that the relative ratios of these proteins to POR and each other can be dramatically altered [44].
Recently, we examined the potential for HO-1 and CYP1A2 to affect each other’s behavior [45]. The results could not be explained by the mutual inhibition that would be expected by simple competition between HO-1 and CYP1A2 for POR. In fact, HO-1 actually stimulated CYP1A2-mediated EROD activity at subsaturating POR, and HO-1-mediated heme catabolism was significantly inhibited by the presence of CYP1A2 despite the 60x higher affinity of HO-1 for POR. These unexpected changes in function were attributed to the formation of a heteromeric complex between HO-1 and CYP1A2.
The goal of this study was to determine whether similar interactions occur with HO-1 and the closely related CYP1A1. The results showed a completely different pattern of behavior, such that there was mutual inhibition of both HO-1 and CYP1A1 function in the presence of the competing protein. Interestingly, the bioluminescence resonance energy transfer (BRET)-detectable complex between HO-1 and CYP1A1 was actually stabilized by the presence of POR, whereas the POR•HO-1 and POR•CYP1A1 complexes were disrupted in the presence of the competing protein.
EXPERIMENTAL
Materials
L-α-dilauroyl-sn-glycero-3-phosphocholine (DLPC), resorufin, nicotinamide adenine dinucleotide phosphate reduced tetrasodium salt (NADPH), glucose-6-phosphate, and glucose-6-phosphate dehydrogenase were purchased from Sigma-Aldrich (St. Louis, MO). 7-ethoxyresorufin (7-ER) was purchased from Anaspec (Fremont, CA). Lipofectamine 2000, Dulbecco’s Modified Eagle Medium (DMEM), and phosphate-buffered saline (PBS) were purchased from Invitrogen (Carlsbad, CA). Antibiotic-antimycotic solution was purchased from Life Technologies (Carlsbad, CA). Coelenterazine 400a was purchased from Gold Biotechnology (St. Louis, MO), and coelenterazine h was purchased from Promega (Madison, WI). Escherichia coli C41 cells were purchased through Avidis SA (Biopole Clermont-Limagne, France). HEK293T/17 cells (CRL-11268) were purchased from ATCC (Manassas, VA). The BRET vectors were obtained from Perkin Elmer (Waltham, MA).
The vector coding for human CYP1A1 (vector: pCMV-SPORT6; accession number: BC023019), was purchased from GE Healthcare/Dharmacon (Lafayette, CO). Human HO-1 cDNA was derived from the pGEX-4T-2 vector and was described previously [46].
The plasmids used to generate BRET vectors (pGFP2-N1, pGFP2-N2, pRluc-N2, pRluc-N3) and the pGFP2-Rluc vector were obtained from BioSignal Packard (Waltham, WA). GFP2 is a wild-type green fluorescent protein (GFP) that has been modified by a F64L substitution mutation which results in brighter fluorescence but similar excitation and emission spectra. The BRET vectors were obtained from Perkin Elmer (Waltham, MA). BRET measurements were performed on a TriStar LB 941 plate reader (Berthold Technologies, Bad Wildbad, Germany).
The human CYP1A1 expression system was obtained from Dr. Doug-Young Ryu (Seoul National University, South Korea), and expressed in Escherichia coli C41 [47, 48]. CYP1A1 in this construct was purified using a modification of the previous method [48]. Briefly, membranes from the bacterial cells were solubilized with 10 mM Tris-acetate, pH 7.6 containing 20% glycerol, 0.6% Tergitol NP-10, 0.625% sodium cholate, 30 μM α-naphthoflavone (αNF), 1 mM EDTA, 1 mM PMSF, and 10 mM β-mercaptoethanol (βME) (buffer A). After stirring for at least 4 h, the sample was centrifuged at 100,000 × g for 1 hour, and the supernatant applied to DEAE Sepharose (GE Healthcare), equilibrated with buffer A. CYP1A1 was eluted with buffer A and directly applied to a CM Sepharose column (GE Healthcare) that was equilibrated with 10 mM potassium phosphate pH 7.4 with 20% glycerol, 30 μM αNF, 0.2 mM EDTA, and 10 mM βME (buffer B). CYP1A1 was eluted from the CM Sepharose with buffer B, and then slowly applied to a Reactive Red Agarose type 3000 (Sigma) column that was equilibrated with 20 mM potassium phosphate pH 7.4, 20% glycerol, 0.5% Tergitol NP-10, and 0.1 mM EDTA (buffer C). This column was then rinsed with buffer C containing increasing concentrations of NaCl (50 mM and then 150 mM) to remove impurities. CYP1A1 was eluted with buffer C containing 500 mM NaCl. The sample was dialyzed with 10 mM potassium phosphate pH 7.5 with 20% glycerol and 0.1% Tergitol, and then applied to Hydroxyapatite (Biorad Type II ceramic 80 μm) that was equilibrated with 8 mM potassium phosphate pH 7.5, containing 20% glycerol and 0.3% Tergitol (buffer D). The column was rinsed with 100 mM potassium phosphate pH 7.5 containing 20% glycerol until detergent was not detected in the eluate. CYP1A1 was eluted with 500 mM potassium phosphate pH 7.5 containing 20% glycerol and was dialyzed with 100 mM potassium phosphate pH 7.5 containing 20% glycerol. Recombinant NADPH cytochrome P450 reductase (plasmid: pSC-POR, provided by Lucy Waskell (Univ. Michigan); constructed from plasmid pCWori-rabbit POR, utilizing a T7 promoter) was expressed in Escherichia coli C41, solubilized, and purified according to a modification of previously described methods [49, 50].
Measurement of protein-protein interactions using bioluminescence resonance energy transfer
HEK293T/17 cells were transiently transfected with 1–3 μg total DNA and Lipofectamine 2000 at different ratios of the GFP and Rluc constructs [14, 20]. The DNA amounts in these transfections were adjusted to produce cells expressing approximately the same total protein at a range of GFP:Rluc ratios. This was done to ensure that the BRET complexes were specific and not due to changes in protein expression. After at least 24 hours, the fluorescence of the cells was checked to ensure efficient expression of the GFP fusion protein. Transfections were performed with the following controls: a GFP-Rluc fusion protein, the Rluc fusion protein alone, and cells transfected with only pUC19. Cells were collected in 1 ml PBS, centrifuged, and resuspended in 700 μl PBS.
A portion of the suspended cells (100 μl/well) was distributed in quadruplicate into an opaque, white 96-well plate (PerkinElmer; Waltham, MA). A TriStar LB 941 microplate reader (Berthold Technologies; Bad Wildbad, Germany) was used to measure BRET, and was programmed to (1) inject 100 μl of a 10 μM coelenterazine 400A/PBS solution, (2) shake for 1 s to mix, (3) read Rluc emission for 3 s at 410 nm, and (4) read GFP emission for 3 s at 515 nm. The ratio of GFP fluorescence (at 510 nm) to Rluc luminescence (at 410 nm), immediately following the addition of coelenterazine 400a to a final concentration of 5 μM, was used as the BRET measurement.
The relative expression levels of GFP and Rluc tagged proteins were determined by comparison of the fluorescence/luminescence to cells expressing a GFP-Rluc fusion protein. GFP expression was estimated by measuring fluorescence (410 nm excitation, 515 nm emission), whereas Rluc expression was measured by adding coelenterazine h to a final concentration of 5 μM and measuring the unfiltered emission. The GFP and Rluc signals from the samples were then normalized to that of the GFP-Rluc fusion protein (which was assumed to have a 1:1 GFP:Rluc expression ratio), so that dividing the normalized GFP value by the normalized Rluc value yielded the GFP:Rluc expression ratio.
Preparation of reconstituted systems for enzyme activity measurements
Reconstituted systems were prepared as described previously [51]. A 5 mM suspension of DLPC in 50 mM potassium phosphate (pH 7.25) with 20% (v/v) glycerol, 0.1 M NaCl, and 5 mM EDTA was sonicated in a bath sonicator until clarification (about 20 min). Purified recombinant CYP1A1, HO-1, or both were mixed with varying quantities of purified recombinant POR in the DLPC stock solution at a molar ratio of 160:1 DLPC:P450 when measuring P450 activity (or DLPC:HO-1 when measuring HO-1 activity) and preincubated for 2 h at room temperature.
Measurement of heme metabolism
HO-1 activity was measured using a coupled assay including biliverdin reductase (BVR), which converts the biliverdin generated by HO-1 into bilirubin. Reconstituted systems (RS) were prepared and pre-incubated for 2 h at room temperature before the addition of other reaction components in 0.1 M potassium phosphate (pH 7.4). The assay components included the reconstituted system (0.05 μM HO-1, POR ranging from 0–0.3 μM, and 8 μM DLPC), 15 μM heme, 0.25 U/μl catalase (to mitigate the effect of H2O2 accumulation on reaction linearity [52]), and liver cytosol to provide BVR (0.8 mg protein/ml). Reactions were preincubated at 37°C for 3 min prior to initiation of the reaction by the addition of NADPH to a final concentration of 0.5 mM. Each reaction was performed in triplicate in black, clear-bottom 96-well plates with a final volume of 0.1 ml. Bilirubin production was measured as the absorbance difference at 464–530 nm using an extinction coefficient of 40 mM−1 cm−1 [53, 54].
Measurement of 7-ethoxyresorufin deethylation
CYP1A1-mediated 7-ethoxyresorufin deethylation was measured by monitoring the formation of the fluorescent product resorufin. The final assay conditions were the reconstituted system (containing 0.05 μM CYP1A1, 8 μM DLPC and POR, ranging from 0–0.3 μM), and 4 μM 7-ethoxyresorufin in 50 mM HEPES (pH 7.5), 15 mM MgCl2, 0.1 mM EDTA. The reactions were initiated by the addition of NADPH (final concentration 0.5 mM) in 96-well plates, at 37°C using a SpectraMax M5 plate reader to monitor fluorescence (excitation: 559 nm, emission 585 nm). Initial rates were calculated using a resorufin standard curve.
DynaFit Simulations based on simple competition
DynaFit (BioKin Ltd.; Watertown, MA) [55] was used to provide preliminary simulations of the expected results if HO-1 and CYP1A1 simply competed for POR. This simulation utilizes the Km and Vmax values obtained with simple binary systems containing only POR/CYP1A1 or POR/HO-1. The equations that would govern the effect of CYP1A1 on HO-1 activity are:
where S represents heme, the equilibrium and rate constants are alongside the equations, and other abbreviations already described. In order to simply the analysis and specifically focus on the protein-protein interactions, a saturating substrate concentration (15 μM) was used. KHS (for heme binding) was 15 μM, as determined using a simple binary system at saturating [POR] [52]. The KPH (i.e. KmPOR•HO-1) and ks (0.0022 μM and 220 pmol/min, respectively) were calculated from the binary system described in Fig. 5. The KI was taken from the KmPOR•CYP1A1 (0.10 μM) that was determined from the binary POR/CYP1A1 system in Fig. 4.
Figure 5.
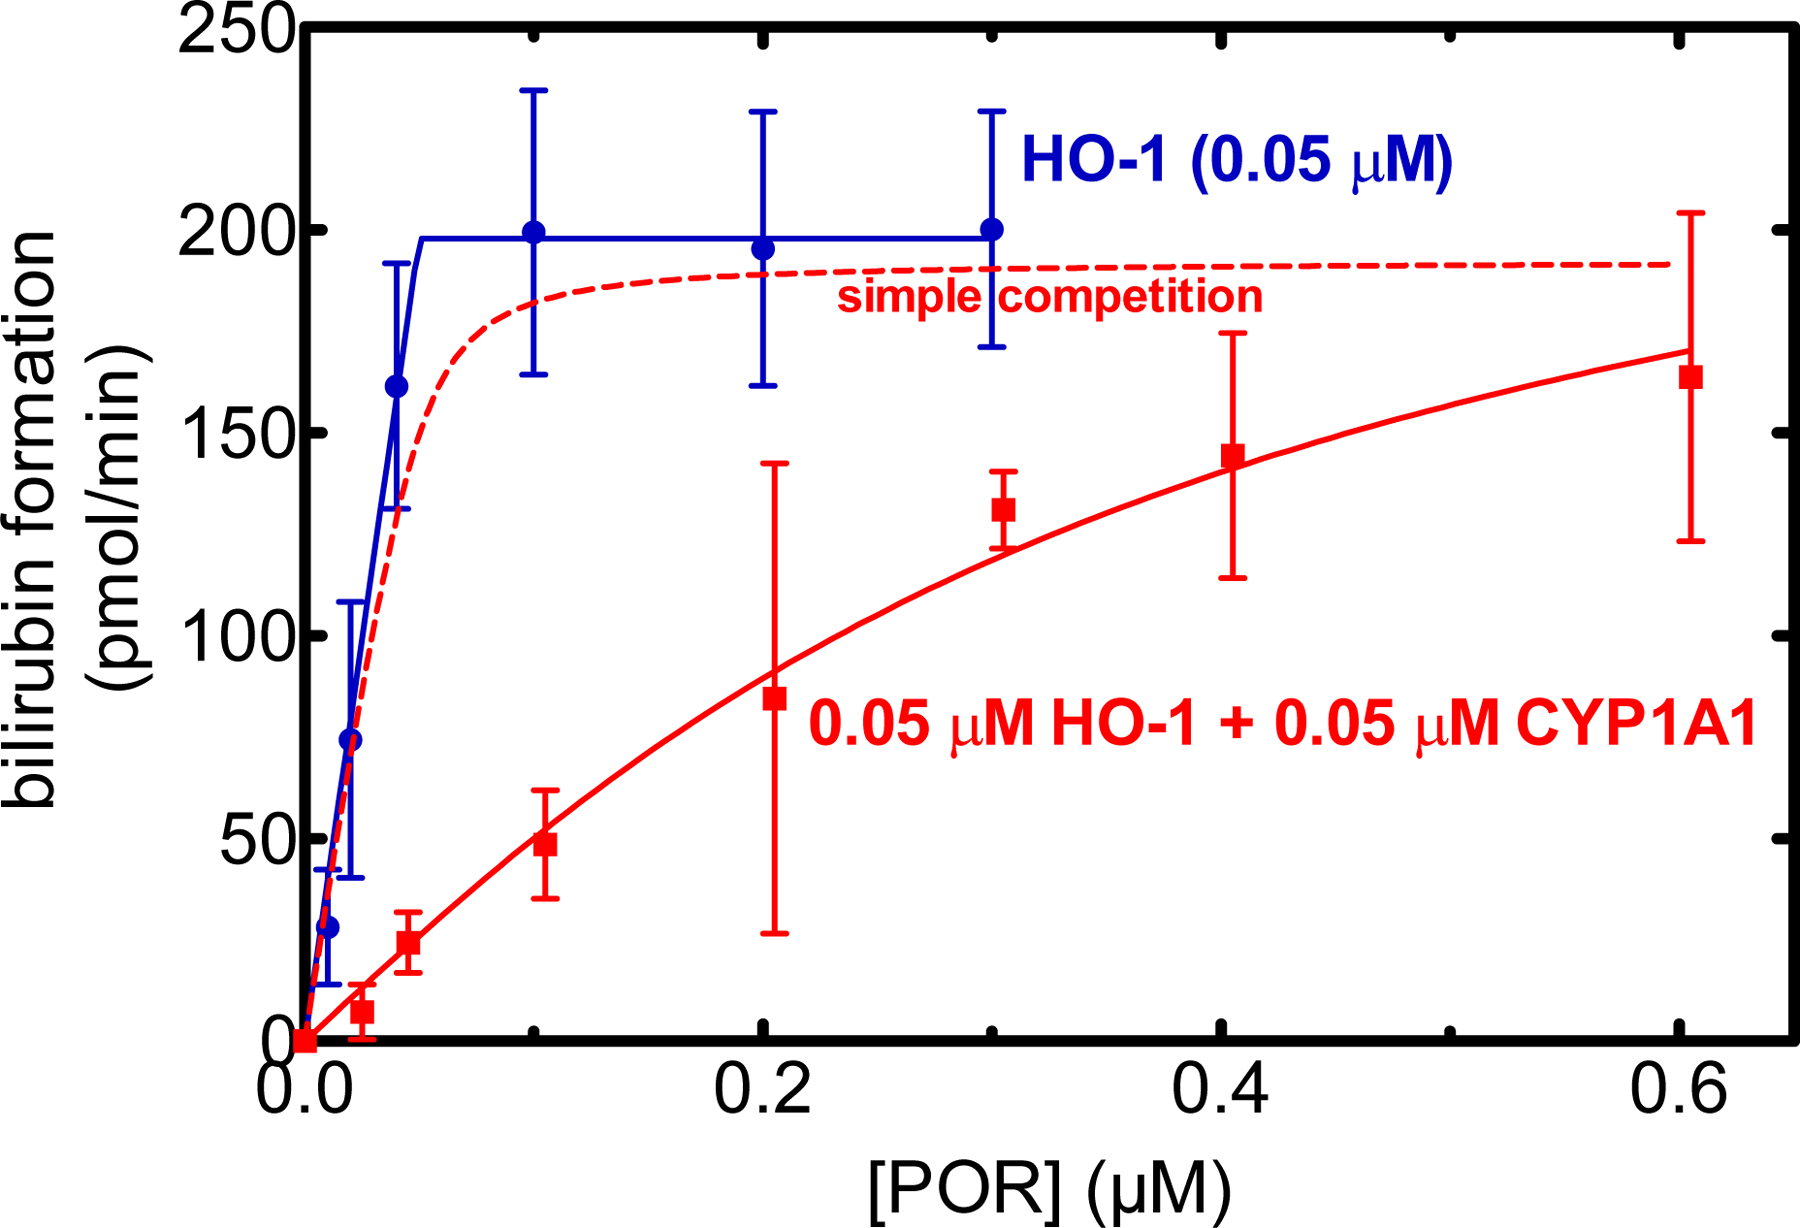
Effect of CYP1A1 on heme degradation by HO-1. HO-1 (0.05 μM) was reconstituted in DLPC as a function of POR concentration in the absence (red) and presence (blue) of CYP1A1. A saturating concentration of heme (15 μM) was used in these assays. Heme oxygenase activity was determined using a coupled assay containing biliverdin reductase and monitoring the accumulation of bilirubin. DynaFit was used not only to fit the experimental data, but also to simulate the expected rate of product formation under conditions where CYP1A1 and HO-1 behaved as monomers and simply competed for the available POR (red dashed line). Plotted data represent the mean and standard deviation of four separate experiments conducted on different days.
Figure 4.
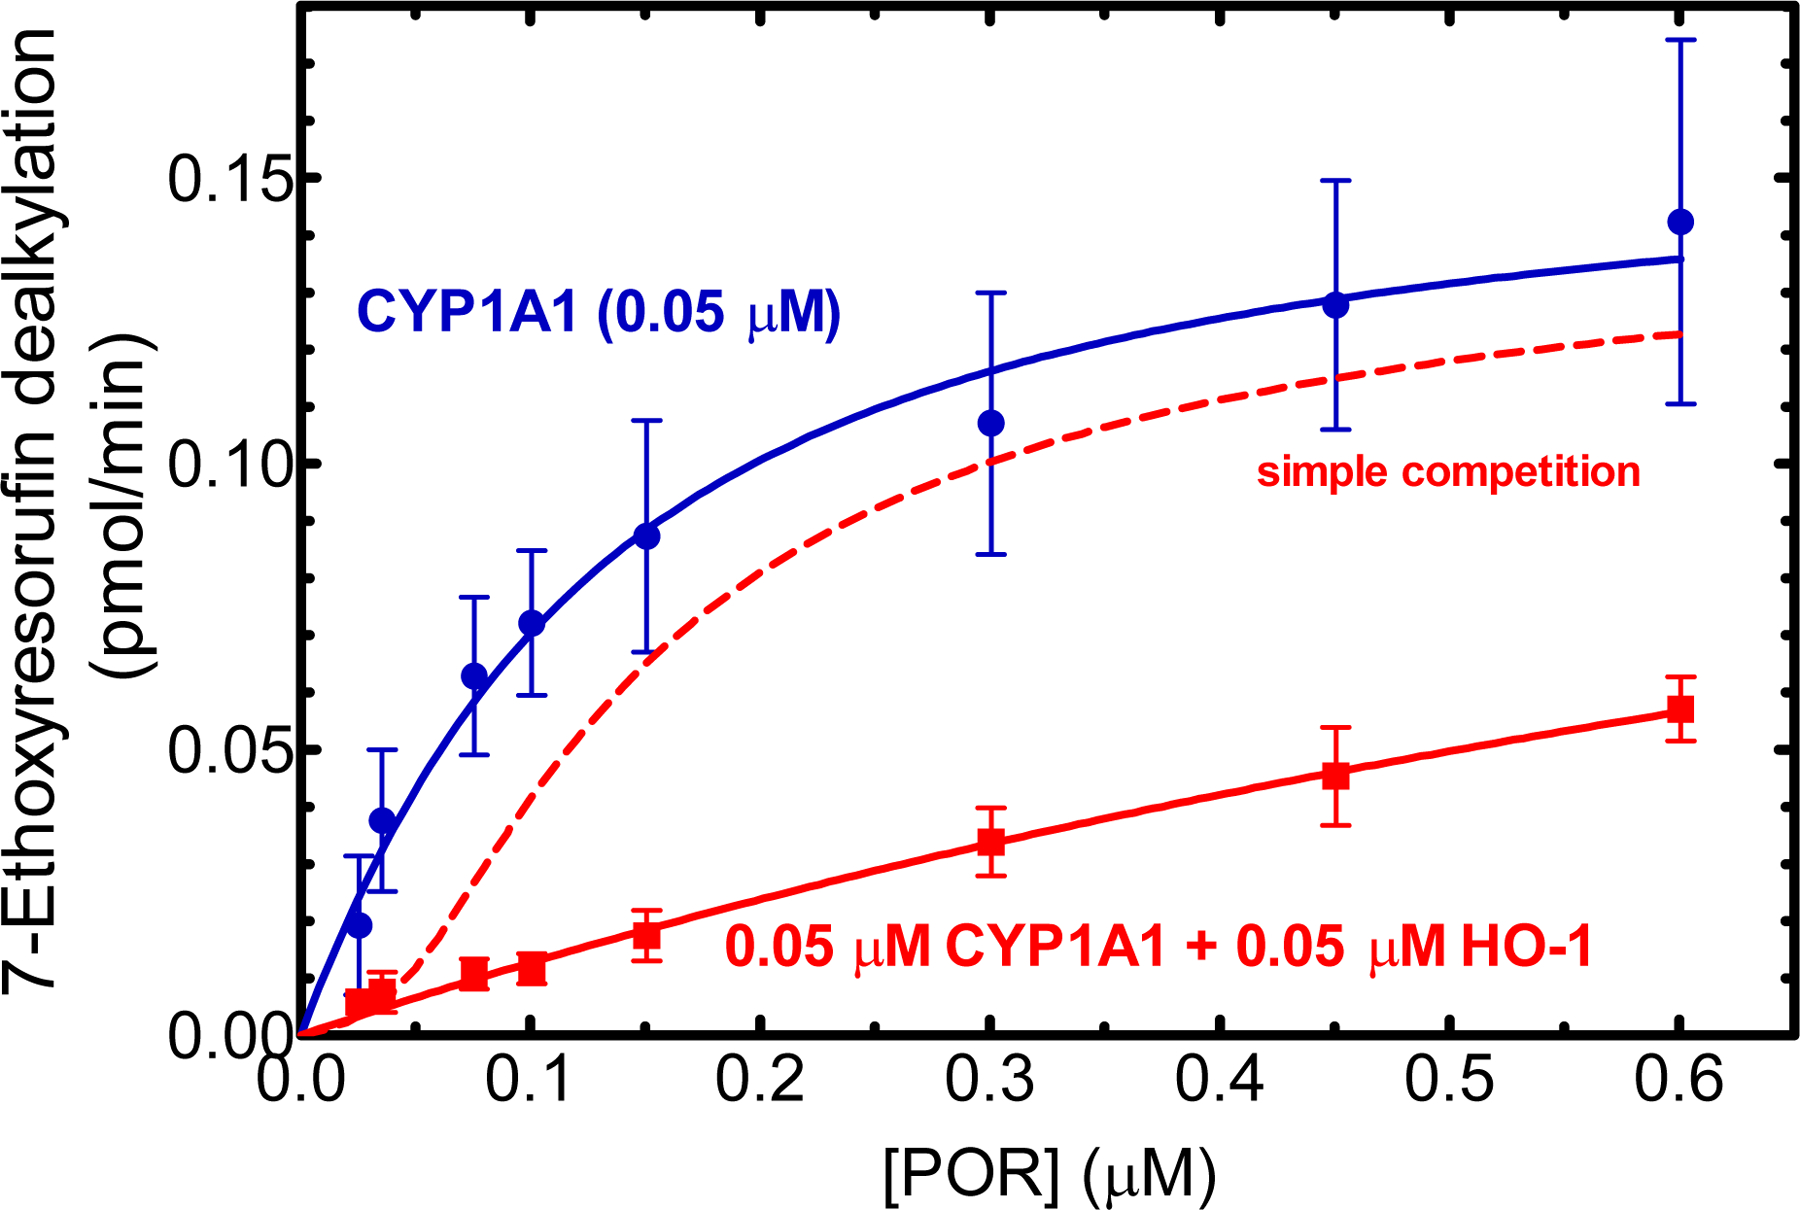
Effect of HO-1 on CYP1A1-mediated EROD. Effect of HO-1 on CYP1A1-mediated 7-ethoxyresorufin O-dealkylation. CYP1A1 (0.05 μM) was reconstituted in DLPC over a range of POR concentrations in the absence (red) and presence (blue) of 0.05 μM HO-1. The final concentration of the substrate 7-ethoxyresorufin was saturating at 4 μM. The rates of product formation were determined by measuring formation of the fluorescent product. DynaFit was used not only to fit the experimental data, but also to simulate the expected rate of product formation under conditions where CYP1A1 and HO-1 behaved as monomers and simply competed for the available POR (red dashed line). Values represent the mean and standard deviation from five separate experiments conducted on different days.
The equations that would govern the effect of HO-1 on CYP1A1 activity are:
where D represents 7ER, the equilibrium and rate constants are alongside the equations, and other abbreviations already described. In order to simplify the analysis and specifically focus on the protein-protein interactions, a saturating substrate concentration (4 μM) was used. The KAD (for 7ER binding) was 0.5 μM, and was determined using a simple binary system at saturating [POR] (not shown). The KPA (i.e. KmPOR•CYP1A1) and kd (0.10 μM and 0.16 pmol/min, respectively) were calculated from the binary system described in Fig. 4. The KI was taken from the KmPOR•HO-1 (0.002 μM) that was determined from the binary POR/HO-1 system in Fig. 5. The script files are included as supplemental information.
Data analysis
POR titration data were fit using DynaFit, assuming tight binding for the protein-protein interactions. The 7-ethoxyresorufin activity data are represented as the mean ± SD for five reconstituted systems prepared and measured on separate days, whereas heme oxygenase activities are the mean ± SD for four separate determinations. The BRET data shown in Figures 1–3 are from a single experiment with each point being measured in triplicate. Because there is day-to-day variability in transfection levels, we generally observed variation in both the x- and y-axis values. However, each experiment was repeated on separate days with newly transfected proteins to ensure reproducibility. Similar results were obtained with each of the repeated experiments in Figures 1–3.
Figure 1.
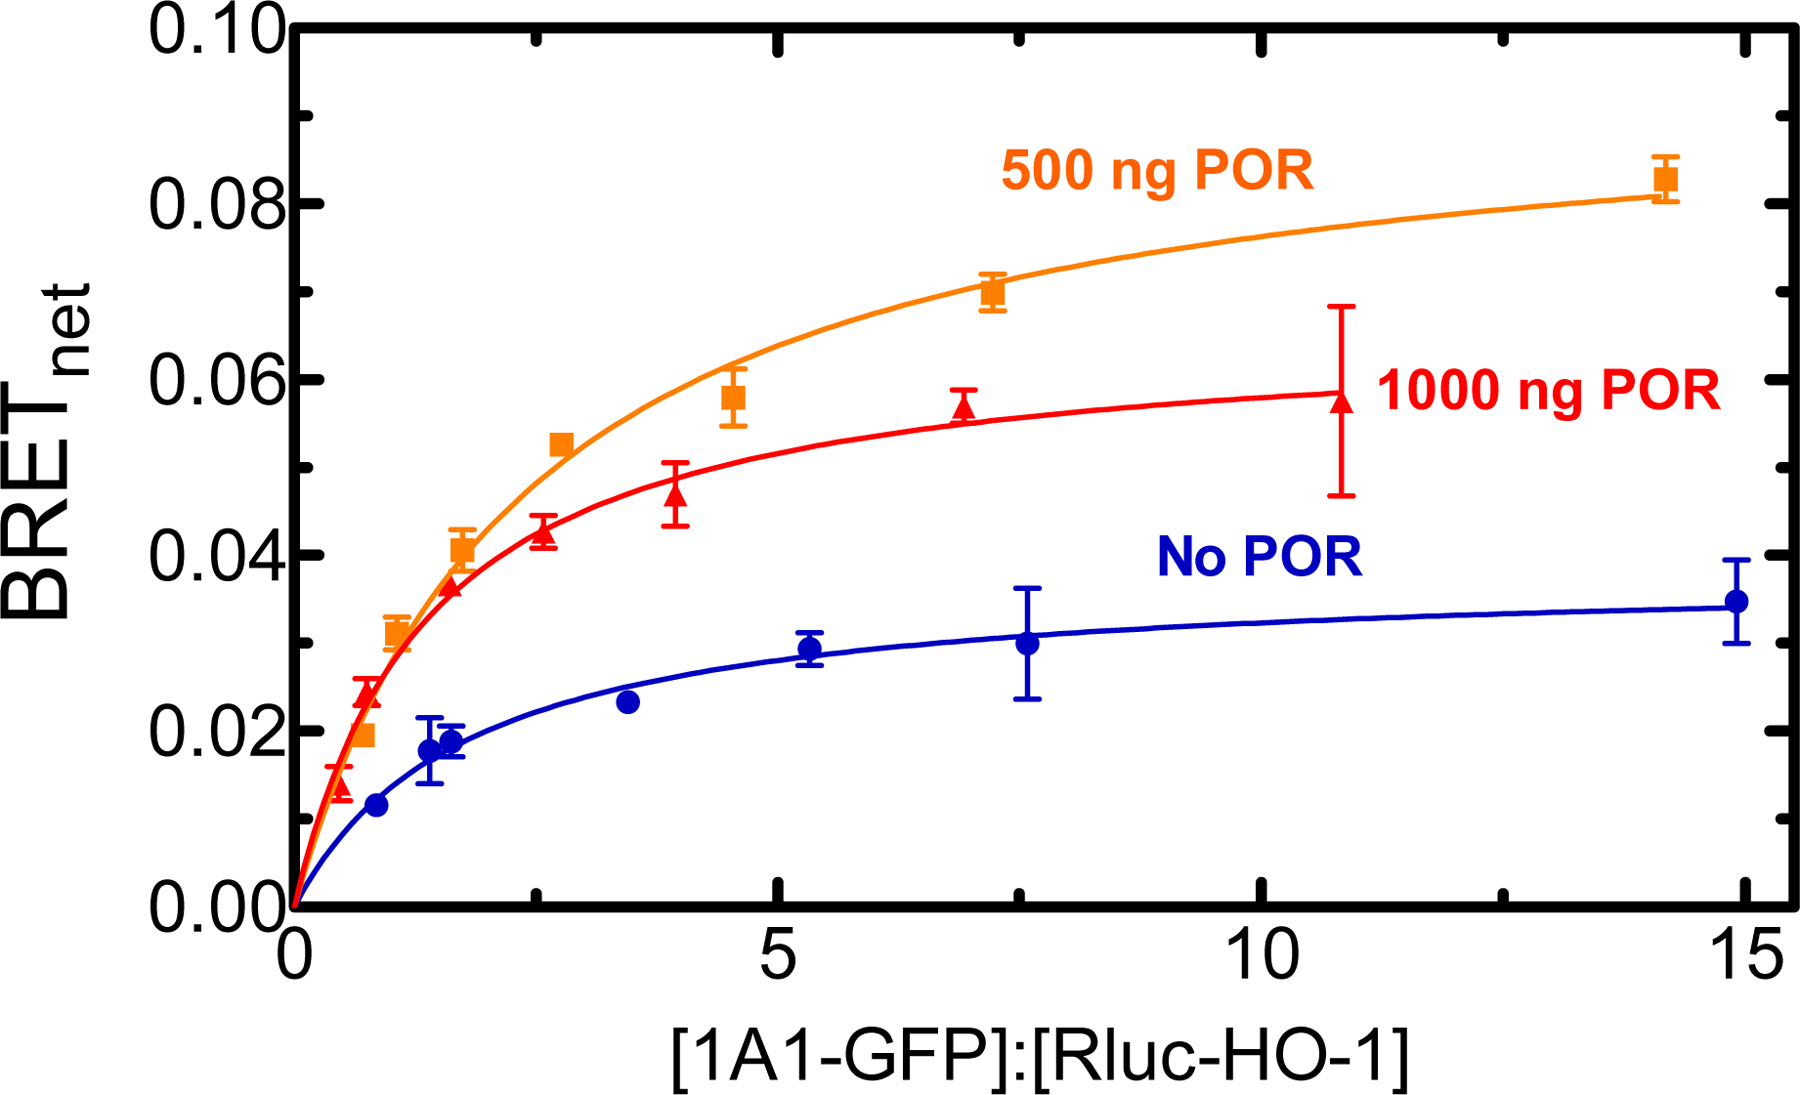
Determination of complex formation between CYP1A1 and HO-1 – Effect of POR. HEK 293T/17 cells were transfected with plasmids coding for human CYP1A1-GFP and Rluc-HO-1 at a range of GFP:Rluc ratios, in the absence and presence of untagged-POR. The CYP1A1-GFP/Rluc-HO-1 BRET pair was measured 24 hours after transfection in the absence (blue), and presence of 500 ng (orange), or 1000 ng (red) of co-transfected POR DNA. Error bars represent the standard deviation of triplicate measurements of cells from a single transfection. The experiment was performed three times with small adjustments to transfection conditions for optimization of protein expression, generating similar results.
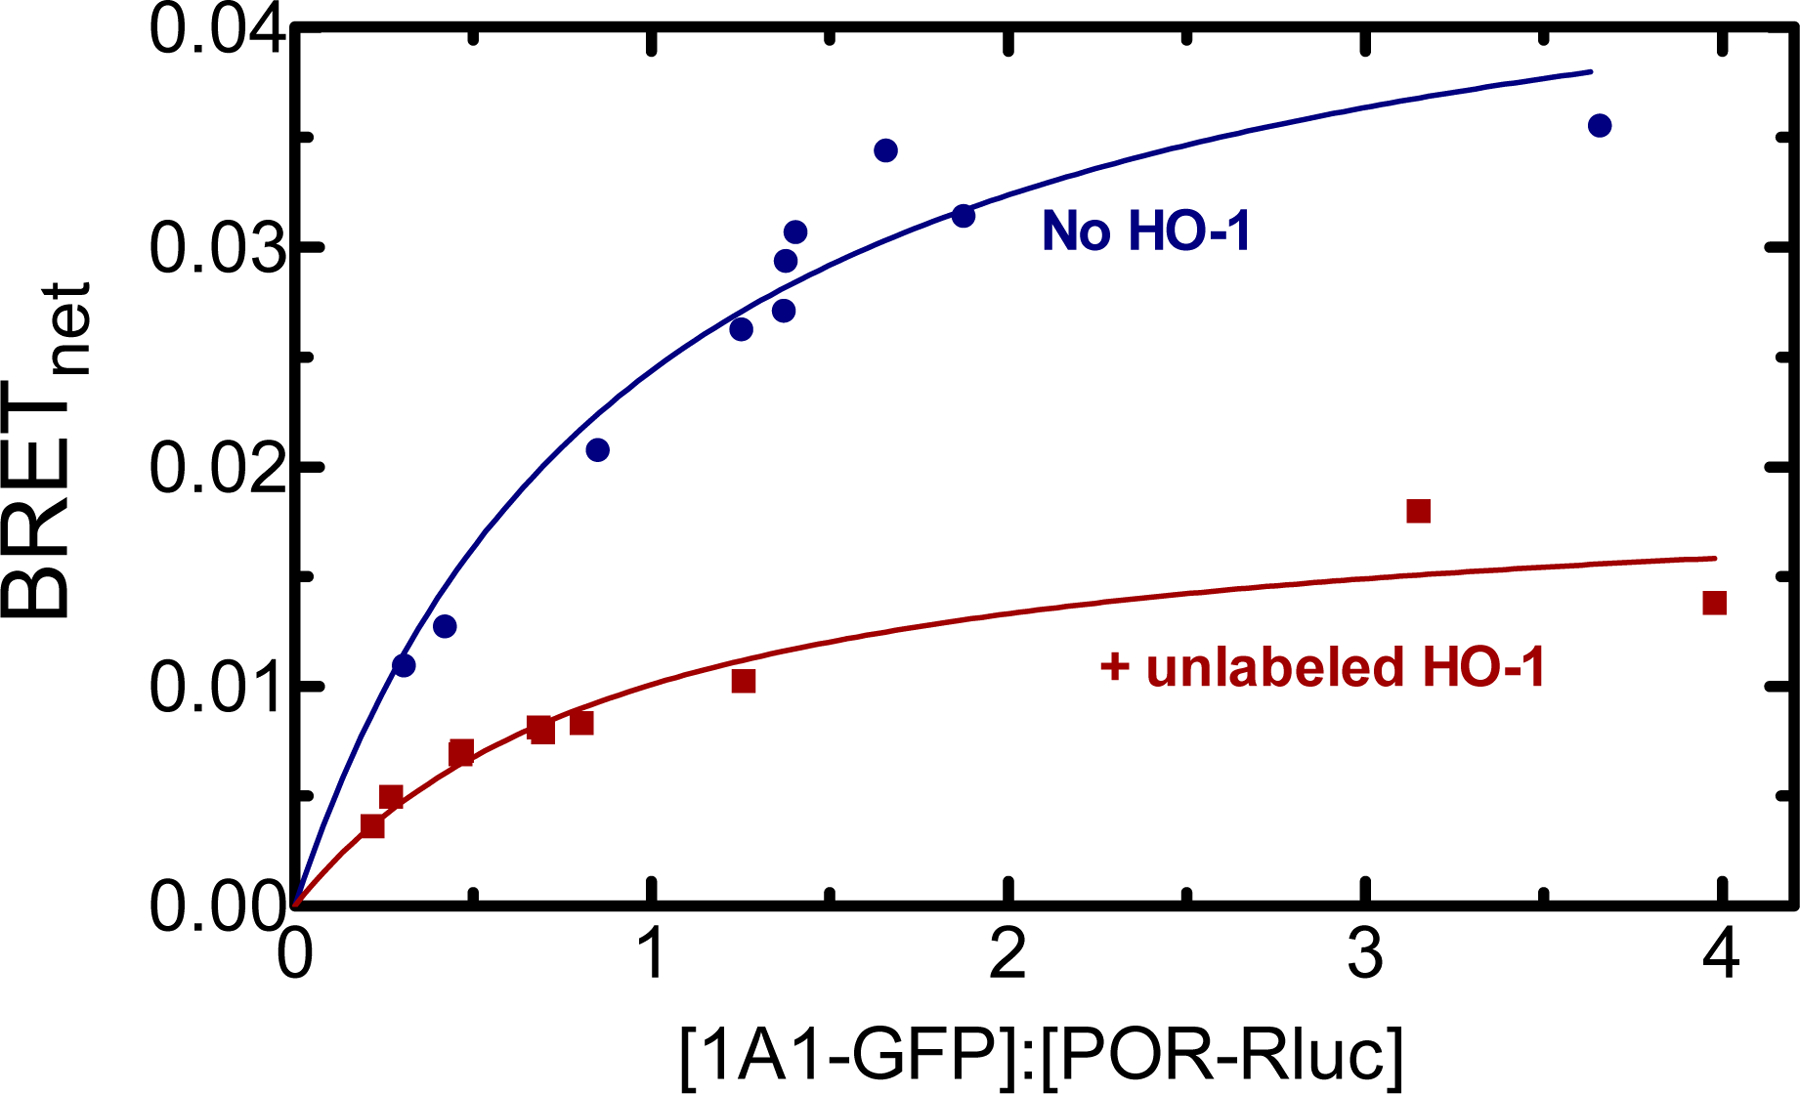
Figure 3.
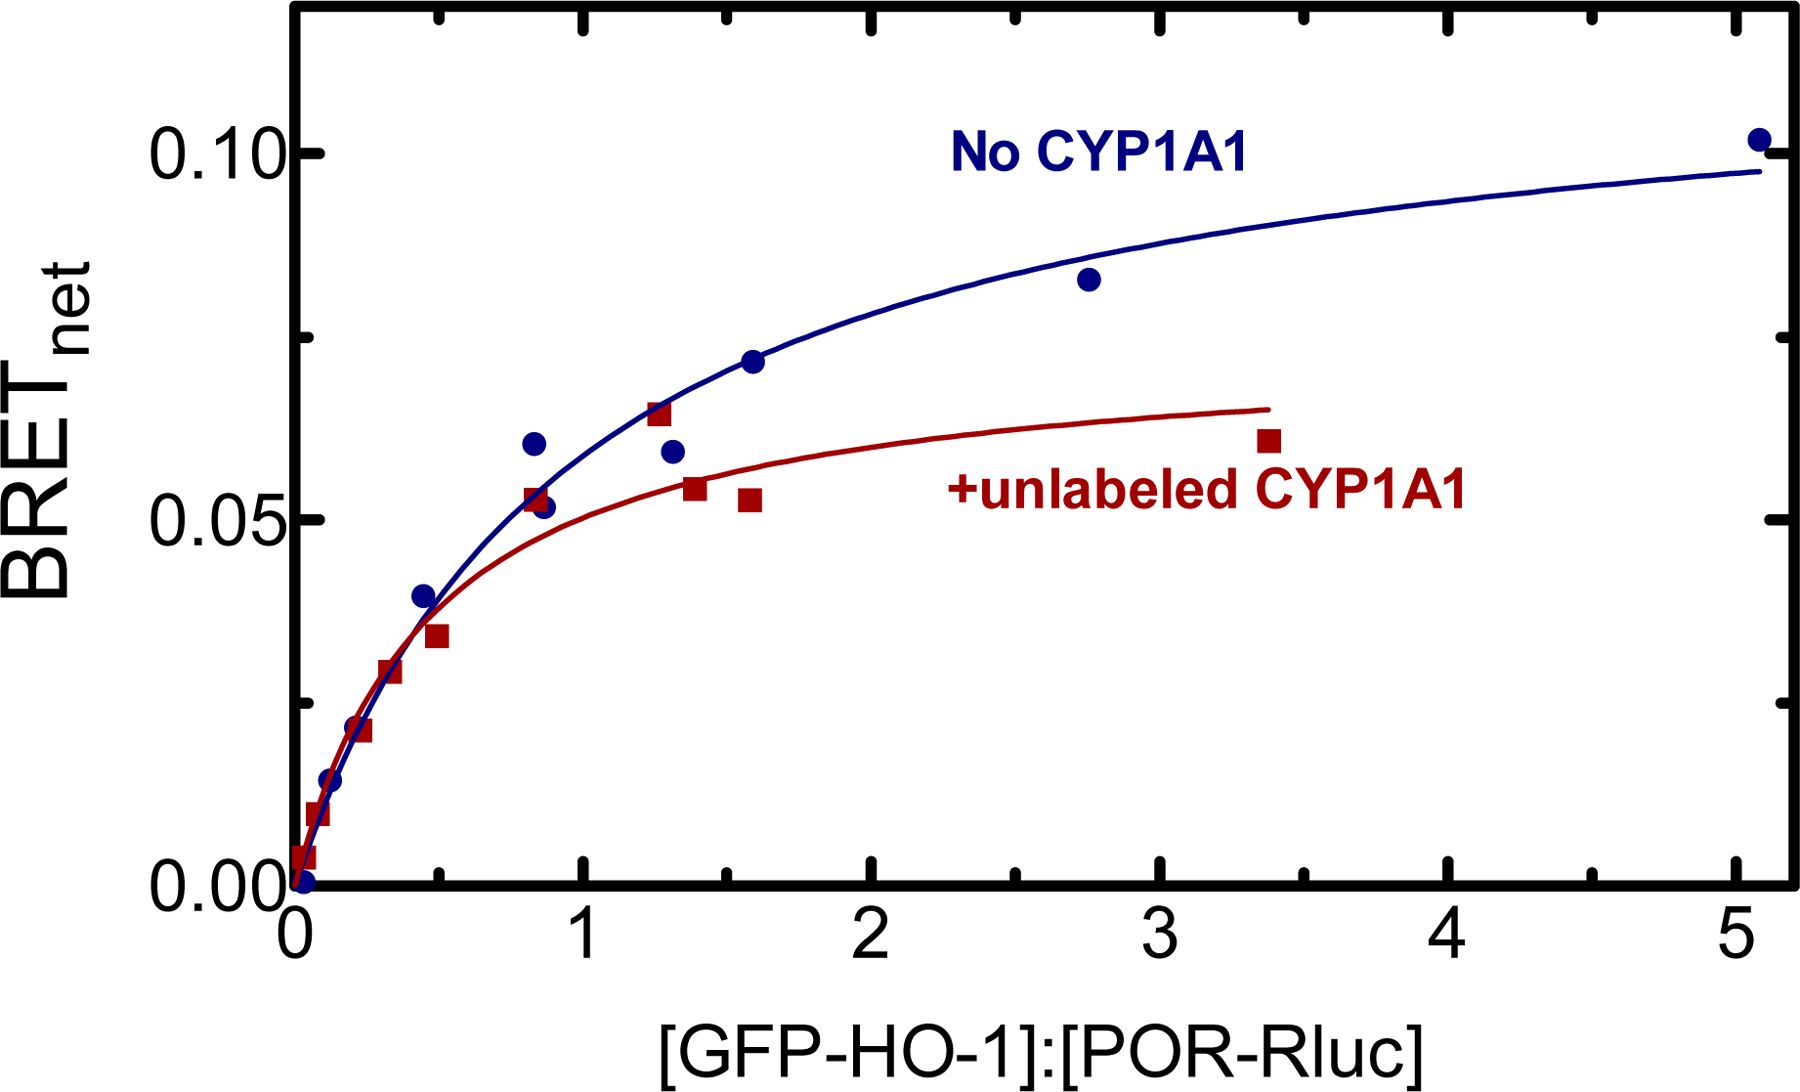
Effect of CYP1A1 on the interaction between GFP-HO-1 and POR-Rluc. A. HEK 293T/17 cells were transfected with plasmids coding for GFP-HO-1, POR-Rluc at a range of GFP:Rluc ratios in the absence and presence of unlabeled CYP1A1. BRET signals generated by the POR-Rluc•GFP-HO-1 pair were measured 24 hours after transfection in the absence (blue) and presence (red) of 1200 ng of unlabeled CYP1A1. Data points represent triplicate measurements of cells from a single transfection; error bars (SD) did not exceed the size of the points. This experiment was repeated with small adjustments to transfection conditions for optimization of protein expression, generating similar results.
RESULTS
Characterization of the physical interactions among CYP1A1, HO-1, and POR
With evidence for the recently reported formation of CYP1A2•HO-1 complexes, our initial studies focused on whether the closely related CYP1A1 also associated with HO-1. Formation of this complex was detected using BRET, labeling CYP1A1 with GFP, and HO-1 with Renilla luciferase (Rluc). As shown in Fig. 1, the CYP1A1/HO-1 pair was able to produce a BRET-detectable complex. Interestingly, co-transfection with 500 ng POR (~33% of the total transfected DNA) caused a sharp increase in BRETmax, potentially indicating a stabilization of the CYP1A1•HO-1 complex by POR. Transfecting a larger quantity of unlabeled POR DNA (1000 ng, ~50% of the total) caused some attenuation of the BRET signal compared to that measured at 500 ng POR; however, a significant BRET signal remained indicating a stable CYP1A1•HO-1 complex.
CYP1A1 function requires the formation of a redox complex with POR. However, as the effect of the presence of HO-1 on the POR•CYP1A1 complex is unknown, we examined the stability of this complex in the absence and presence of HO-1 (Fig. 2). As expected, CYP1A1-GFP and POR-Rluc generated a BRET signal consistent with the formation of a POR•CYP1A1 complex. Addition of 500 ng unlabeled HO-1 DNA to the transfection led to a sharp decrease in BRETmax, indicating that the ability of POR and CYP1A1 to form their redox complex was disturbed when HO-1 was present.
Figure 2.
Effect of HO-1 on the interaction between CYP1A1-GFP and POR-Rluc. HEK 293T/17 cells were transfected with plasmids coding for human CYP1A1-GFP and POR-Rluc at a range of GFP:Rluc ratios in the absence (blue) and presence (red) of 500 ng unlabeled HO-1. Cells were collected 24 h after the initial transfection, and BRET was measured. Data points represent triplicate measurements from a single transfection. In this experiment, the error bars representing the standard deviation (SD) did not exceed the size of the points. This experiment was repeated with small adjustments to transfection conditions for optimization of protein expression, generating similar results.
As a complex between POR and HO-1 is required for heme degradation, the ability of CYP1A1 to disrupt the POR•HO-1 complex was examined. Again, HO-1 formed a BRET-detectable complex with POR (Fig. 3), consistent with the high affinity complex found when measuring HO-1 activities [56]. Transfection of 1200 ng unlabeled CYP1A1 DNA led to a decrease in BRETmax for the GFP-HO-1/POR-Rluc pair (Fig. 3), which is consistent with its ability to disrupt the POR•HO-1 complex, but not to the extent observed with disruption of the POR•CYP1A1 complex (Fig. 2).
Effects of HO-1 on CYP1A1 activity
Based on the BRET data, we understand that CYP1A1 and HO-1 form a stable complex that is not disrupted, and potentially enhanced, by the addition of POR. This suggests that there is, at a minimum, a ternary complex among POR, HO-1 and CYP1A1 formed. However, it is uncertain how POR interacts with the CYP1A1•HO-1 complex, due to the ability of the competing heme-containing protein to disturb complex formation with POR. By simple observation of the BRET data, HO-1 appears to cause a greater disruption of the POR•CYP1A1 complex than in the converse experiment (Figs. 2 & 3), which is consistent with the previously reported high affinity of HO-1 for POR when in the membrane [46]. These results suggest that these proteins will not simply compete for the available POR but may exhibit a more complex catalytic mechanism, raising questions regarding how monooxygenase (CYP1A1) activity and heme (HO-1) metabolism are affected by the presence of the competing heme-containing protein.
As expected, reconstituted systems containing POR and CYP1A1 efficiently metabolized the probe substrate, 7-ethoxyresorufin, with a KmPOR•CYP1A1 of about 0.1 μM (95% CI: 0.05 – 0.15 μM), with Vmax = 0.16 μM/min (95% CI: 0.14 – 0.18 μM/min), a typical affinity for P450 complexes (Fig. 4 blue). The presence of equimolar HO-1 dramatically inhibited CYP1A1-mediated EROD activity, with inhibition evident even in the presence of excess POR (12:1:1 POR:CYP1A1:HO-1). This led to an increase in the apparent Km to 1.2 μM (95% CI: 0.3 – 2.2 μM). The apparent Vmax was 0.18 μM/min (95% CI: 0.08 – 0.27 μM/min), and although similar to the uninhibited rate exhibited significant uncertainty.
These changes suggest that complex formation caused a conformational change that affected the ability of both proteins to associate with POR. To test this possibility, DynaFit was used to simulate the expected result from a simple model where either: (1) CYP1A1 and HO-1 do not form a complex and simply compete for the available POR, or (2) CYP1A1 and HO-1 can form a complex, but complex formation does not alter the abilities of the two proteins to associate with POR (Fig. 4, red dashed line). The results show a sigmoidal response would be expected in the presence of HO-1. Because of the high affinity of HO-1 for POR, a significant inhibition of EROD was predicted at subsaturating POR. However, once all of the HO-1 binding sites were occupied (assuming a 1:1 POR•HO-1 complex), additional POR would be available for binding to CYP1A1. The significant difference between the model and the experimental results indicates that CYP1A1•HO-1 complex formation significantly affected the catalytic characteristics of CYP1A1 in a manner more complex than simple competition for POR.
Effects of CYP1A1 on HO-1 activity
In the converse experiment, the effect of CYP1A1•HO-1 complex formation on HO-1 activity and POR binding was examined. As previously reported [46, 51], full-length membrane-bound HO-1 has an extremely high affinity for POR having a Km POR•HO-1 of < 0.001 μM (95% CI: 0 – 0.004 μM) (Fig. 5). The presence of equimolar CYP1A1 caused a significant inhibition of HO-1 activity at subsaturating POR, but this was much less pronounced at the highest POR levels. It is interesting to note that the apparent ability of HO-1 to associate with POR was significantly altered in the presence of CYP1A1 with an apparent KmPOR•HO-1 of 0.31 μM (95% CI: 0.14–0.78 μM). Because of the >100-fold difference in affinity for POR between HO-1 and CYP1A1, we would expect the presence of CYP1A1 to have little effect on HO-1 activity in the case of simple competition, which was simulated using DynaFit. According to this model, HO-1 activity would only be marginally affected in the presence of CYP1A1 (Fig. 5 red dashed). These results clearly show that formation of the HO-1•CYP1A1 complex significantly affected the catalytic characteristics of HO-1.
DISCUSSION
Whereas baseline CYP1A1 expression is low, induction of CYP1A1 activity by exposure to aryl hydrocarbon receptor agonists has been observed in many tissues [1, 57]. HO-1 shares this pattern of low basal expression paired with ubiquitous inducibility (in this case, by general oxidative stress instead of by polycyclic aromatic hydrocarbons) [36]. There are numerous examples of specific cells that have been shown to express both CYP1A1 and HO 1 such as vascular endothelial cells [58–61], type II pneumocytes in the lung [62–64], and macrophages [65, 66], among others. This, together with the fact that both proteins share the cytosolic face of the ER membrane provides ample opportunity for physical interaction between CYP1A1 and HO-1 to occur [35, 67].
When analyzing physical complex formation using BRET, the most striking result was with the formation of the CYP1A1•HO-1 complex. This complex appeared to be stable on its own, but the lower BRETmax level suggested that a fraction of the proteins may be dissociated, and not in a CYP1A1•HO-1 complex. The effect of POR on the CYP1A1•HO-1 interaction was surprising in that BRETmax was increased when 500 ng POR DNA was co-transfected. There are two possible explanations for these results. First, POR could change the affinity of HO-1 for CYP1A1, leading to the recruitment of other HO-1 and CYP1A1 molecules into complex formation. Second, the presence of POR could lead to a conformational change in the proteins, leading to a closer interaction between the GFP and Rluc moieties, and consequently to BRET enhancement.
Interestingly, this increase was attenuated by transfection with a larger amount (1000 ng) of POR DNA. A plausible explanation for this behavior would be POR binding and stabilizing the POR•P450 complex at lower POR levels followed by less favorable complex-forming conditions once there is enough POR to form both POR•CYP1A1 and POR•HO-1 complexes. Again, this change in BRET could be attributed to either another change in conformation that moves the GFP and Rluc moieties farther apart, or to dissociation of the CYP1A1•HO-1 complex.
When examined qualitatively, the BRET competition experiments for both CYP1A1 and HO-1 interactions with POR (Figs. 2 & 3) were roughly consistent with competition between the enzymes for POR binding. When specifically examining the POR•HO-1 complex, the presence of CYP1A1 caused a moderate disruption of the POR•HO-1 complex. In contrast, HO-1 caused a larger disruption of the POR•CYP1A1 BRETmax. This is consistent with the Km values for the proteins when examined in binary systems. That is, with a KmPOR•CYP1A1 of about 0.1 μM and a KmPOR•HO-1 of about 0.002 μM, the presence of HO-1 would be expected to significantly disrupt the POR•CYP1A1 complex, whereas the POR•HO-1 complex would be less affected by co-transfection of CYP1A1. However, the data indicating formation of the CYP1A1•HO-1 complex clearly discount this simplest possibility.
In the event that HO-1 and CYP1A1 simply were to compete for the available POR, without any changes in their affinities or kcat, certain predictions could be made. We would anticipate that the interactions would be consistent with a competitive response. As shown in the simulated data (Fig. 4, black), CYP1A1 activity would be dramatically inhibited, but only until all of the POR binding sites on HO-1 were occupied. Further increases in the POR concentration would allow POR binding to CYP1A1, leading to the S-shaped curve predicted by DynaFit.
Experimentally, HO-1 activity was inhibited at lower POR levels; with CYP1A1 having no apparent effect on Vmax. Assuming that the HO-1•CYP1A1 complex either did not form, or the HO-1•CYP1A1 complex did not affect the ability of CYP1A1 to affect HO-1 binding or catalysis, HO-1 activity would not be measurably inhibited by the inclusion of CYP1A1, which is shown in the DynaFit simulation. The effect of CYP1A1 on HO-1 activity is much larger than expected given the disparity in apparent affinities of the two proteins for POR when measured alone. A more complete kinetic analysis will be required to decipher the mechanistic details related to this response.
These results are consistent with the formation of a CYP1A1•HO-1 complex that is further stabilized by the presence of POR. Although understanding the specific characteristics of this complex will require further study, the results point to a ternary CYP1A1•HO-1•POR complex (at subsaturating POR) and quaternary (POR•CYP1A1•HO-1•POR) complex at higher POR concentrations. Although the presence of CYP1A1 decreased the affinity of HO-1 for POR, the maximal catalytic activity of the POR•HO-1 complex was not substantially affected. In contrast, the presence of HO-1 caused a dramatic increase in the apparent Km for the POR•CYP1A1 complex, likely through a conformational change caused by CYP1A1•HO-1 complex formation.
These results are particularly interesting when considering our recent report that the closely related CYP1A2 and HO-1 also form complexes, but the characteristics of these complexes are completely different [45]. Both CYP1A1 and CYP1A2 form stable complexes with HO-1. Although the CYP1A2•HO-1 complex is unaffected by the presence of POR, the CYP1A1•HO-1 BRET complex is stabilized by POR. Another major difference was found with the enzyme activities. Whereas HO-1 caused substantial inhibition of CYP1A1-mediated EROD (Fig. 4), HO-1 actually caused an increase in CYP1A2-mediated EROD at subsaturating POR [45]. CYP1A1 also had a greater inhibitory effect on heme metabolism than did CYP1A2. These differences can be particularly important when considering tissue-specific differences in P450 expression and their response to chemical- or stress-induced induction of HO-1. With CYP1A2 being the predominant CYP1A form in the liver, induction of HO-1 would be expected to have a minimal effect on CYP1A2-dependent activities. However, in extrahepatic tissues where CYP1A1 predominates, induction of HO-1 may lead to substantial inhibition of CYP1A1. The consequences of these effects would be dependent on the expression levels of each of the contributing proteins, and the chemicals to which the organism is exposed.
Supplementary Material
ACKNOWLEDGEMENTS
The authors would like to thank Dr. Doug-Young Ryu (Seoul National University, South Korea) for supplying human CYP1A1, and the technical support of Marilyn Eyer (LSU Health Sciences Center).
FUNDING
This work was supported by United States Public Health Services grants from the National Institute of General Medical Sciences (R01 GM123253) and the National Institute of Environmental Health Sciences (P42 ES013648). A portion of this study was published in a dissertation by Dr. J. Patrick Connick entitled, “The cytochromes P450, heme oxygenase-1, and NADPH-cytochrome P450 reductase form multiple complexes that influence protein function.”
Abbreviations:
- CYP; P450
cytochrome P450
- BRET
bioluminescence resonance energy transfer
- EROD
7-ethoxyresorufin-O-dealkylation
- 7-ER
7-ethoxyresorufin
- NADPH
reduced nicotinamide adenine dinucleotide phosphate
- POR
NADPH – cytochrome P450 oxidoreductase
- DLPC
L-α-dilauroyl-sn-glycero-3-phosphocholine
- PBS
phosphate buffered saline
- αNF
α-naphthoflavone
- βME
β-mercaptoethanol
- PMSF
phenylmethylsulfonyl fluoride
Footnotes
COMPETING INTERESTS
The authors have no competing interests to declare.
DATA AVAILABILITY
Supporting data are included within the main article and the supplementary information.
REFERENCES
- 1.Nebert DW, Dalton TP, Okey AB and Gonzalez FJ (2004) Role of Aryl Hydrocarbon Receptor-mediated Induction of the CYP1 Enzymes in Environmental Toxicity and Cancer. Journal of Biological Chemistry 279, 23847–23850 [DOI] [PubMed] [Google Scholar]
- 2.Zhou SF, Wang B, Yang LP and Liu JP (2010) Structure, function, regulation and polymorphism and the clinical significance of human cytochrome P450 1A2. Drug Metab Rev 42, 268–354 [DOI] [PubMed] [Google Scholar]
- 3.Walsh AA, Szklarz GD and Scott EE (2013) Human cytochrome P450 1A1 structure and utility in understanding drug and xenobiotic metabolism. J Biol Chem 288, 12932–12943 [DOI] [PMC free article] [PubMed] [Google Scholar]
- 4.Kesharwani SS, Nandekar PP, Pragyan P and Sangamwar AT (2014) Comparative proteomics among cytochrome p450 family 1 for differential substrate specificity. Protein J 33, 536–548 [DOI] [PubMed] [Google Scholar]
- 5.Weems JM and Yost GS (2010) 3-Methylindole metabolites induce lung CYP1A1 and CYP2F1 enzymes by AhR and non-AhR mechanisms, respectively. Chem Res Toxicol 23, 696–704 [DOI] [PMC free article] [PubMed] [Google Scholar]
- 6.Shimada T, Inoue K, Suzuki Y, Kawai T, Azuma E, Nakajima T, Shindo M, Kurose K, Sugie A, Yamagishi Y, Fujii-Kuriyama Y and Hashimoto M (2002) Arylhydrocarbon receptor-dependent induction of liver and lung cytochromes P450 1A1, 1A2, and 1B1 by polycyclic aromatic hydrocarbons and polychlorinated biphenyls in genetically engineered C57BL/6J mice. Carcinogenesis 23, 1199–1207 [DOI] [PubMed] [Google Scholar]
- 7.Schweikl H, Taylor JA, Kitareewan S, Linko P, Nagorney D and Goldstein JA (1993) Expression of CYP1A1 and CYP1A2 genes in human liver. Pharmacogenetics 3, 239–249 [DOI] [PubMed] [Google Scholar]
- 8.Costa C, Catania S, De Pasquale R, Stancanelli R, Scribano GM and Melchini A (2010) Exposure of human skin to benzo[a]pyrene: role of CYP1A1 and aryl hydrocarbon receptor in oxidative stress generation. Toxicology 271, 83–86 [DOI] [PubMed] [Google Scholar]
- 9.van de Kerkhof EG, de Graaf IA, Ungell AL and Groothuis GM (2008) Induction of metabolism and transport in human intestine: validation of precision-cut slices as a tool to study induction of drug metabolism in human intestine in vitro. Drug Metab Dispos 36, 604–613 [DOI] [PubMed] [Google Scholar]
- 10.Paine MF, Hart HL, Ludington SS, Haining RL, Rettie AE and Zeldin DC (2006) The human intestinal cytochrome P450 “pie”. Drug Metab Dispos 34, 880–886 [DOI] [PMC free article] [PubMed] [Google Scholar]
- 11.Reed CJ, Lock EA and De Matteis F (1986) NADPH: cytochrome P-450 reductase in olfactory epithelium. Relevance to cytochrome P-450-dependent reactions. Biochem. J 240, 585–592 [DOI] [PMC free article] [PubMed] [Google Scholar]
- 12.Ghersi-Egea JF, Minn A, Daval JL, Jayyosi Z, Arnould V, Souhaili-El Amri H and Siest G (1989) NADPH:cytochrome P-450(c) reductase: biochemical characterization in rat brain and cultured neurons and evolution of activity during development. Neurochem. Res 14, 883–887 [DOI] [PubMed] [Google Scholar]
- 13.Shen AL and Kasper CB (1993) Regulation of NADPH-cytochrome P450 oxidoreductase. In Cytochrome P450 (Schenkman JB and Greim H, eds.). pp. 35–59, Springer-Verlag, Berlin [Google Scholar]
- 14.Connick JP, Reed JR and Backes WL (2018) Characterization of interactions among CYP1A2, CYP2B4, and NADPH-cytochrome P450 reductase: Identification of specific protein complexes. Drug Metab. Dispos 46, 197–203 [DOI] [PMC free article] [PubMed] [Google Scholar]
- 15.Reed JR, Cawley GF and Backes WL (2013) Interactions between cytochromes P450 2B4 (CYP2B4) and 1A2 (CYP1A2) lead to alterations in toluene disposition and P450 uncoupling. Biochemistry 52, 4003–4013 [DOI] [PMC free article] [PubMed] [Google Scholar]
- 16.Reed JR, Eyer M and Backes WL (2010) Functional interactions between cytochromes P450 1A2 and 2B4 require both enzymes to reside in the same phospholipid vesicle: Evidence for physical complex formation. J. Biol. Chem 285, 8942–8952 [DOI] [PMC free article] [PubMed] [Google Scholar]
- 17.Kelley RW, Reed JR and Backes WL (2005) Effects of ionic strength on the functional interactions between CYP2B4 and CYP1A2. Biochemistry 44, 2632–2641 [DOI] [PMC free article] [PubMed] [Google Scholar]
- 18.Backes WL, Batie CJ and Cawley GF (1998) Interactions among P450 enzymes when combined in reconstituted systems: Formation of a 2B4–1A2 complex with a high affinity for NADPH-cytochrome P450 reductase. Biochemistry 37, 12852–12859 [DOI] [PubMed] [Google Scholar]
- 19.Hwang HW, Lee JR, Chou KY, Suen CS, Hwang MJ, Chen C, Shieh RC and Chau LY (2009) Oligomerization is crucial for the stability and function of heme oxygenase-1 in the endoplasmic reticulum. J. Biol. Chem 284, 22672–22679 [DOI] [PMC free article] [PubMed] [Google Scholar]
- 20.Reed JR, Connick JP, Cheng D, Cawley GF and Backes WL (2012) Effect of homomeric P450•P450 complexes on P450 function. Biochem. J 446, 489–497 [DOI] [PMC free article] [PubMed] [Google Scholar]
- 21.Hu G, Johnson EF and Kemper B (2010) CYP2C8 exists as a dimer in natural membranes. Drug Metab. Dispos 38, 1976–1983 [DOI] [PMC free article] [PubMed] [Google Scholar]
- 22.Jamakhandi AP, Kuzmic P, Sanders DE and Miller GP (2007) Global analysis of protein-protein interactions reveals multiple CYP2E1-reductase complexes. Biochemistry 46, 10192–10201 [DOI] [PMC free article] [PubMed] [Google Scholar]
- 23.Davydov DR, Davydova NY, Sineva EV and Halpert JR (2015) Interactions among cytochromes P450 in microsomal membranes: Oligomerization of cytochromes P450 2E1, 3A5, and 2E1 and its functional consequences. J. Biol. Chem 290, 3850–3864 [DOI] [PMC free article] [PubMed] [Google Scholar]
- 24.Davydov DR, Davydova NY, Sineva EV, Kufareva I and Halpert JR (2013) Pivotal role of P450-P450 interactions in CYP3A4 allostery: the case of alpha-naphthoflavone. Biochem. J 453, 219–230 [DOI] [PMC free article] [PubMed] [Google Scholar]
- 25.Kelley RW, Cheng D and Backes WL (2006) Heteromeric complex formation between CYP2E1 and CYP1A2: Evidence for the involvement of electrostatic interactions. Biochemistry 45, 15807–15816 [DOI] [PMC free article] [PubMed] [Google Scholar]
- 26.Subramanian M, Low M, Locuson CW and Tracy TS (2009) CYP2D6-CYP2C9 protein-protein interactions and isoform-selective effects on substrate binding and catalysis. Drug Metab. Dispos 37, 1682–1689 [DOI] [PMC free article] [PubMed] [Google Scholar]
- 27.Subramanian M, Zhang H and Tracy TS (2010) CYP2C9-CYP3A4 protein-protein interactions in a reconstituted expressed enzyme system. Drug Metab. Dispos 38, 1003–1009 [DOI] [PMC free article] [PubMed] [Google Scholar]
- 28.Alston K, Robinson RC, Park SS, Gelboin HV and Friedman FK (1991) Interactions among cytochromes P-450 in the endoplasmic reticulum. Detection of chemically cross-linked complexes with monoclonal antibodies. J. Biol. Chem 266, 735–739 [PubMed] [Google Scholar]
- 29.Kenaan C, Shea EV, Lin HL, Zhang H, Pratt-Hyatt MJ and Hollenberg PF (2013) Interactions between CYP2E1 and CYP2B4: effects on affinity for NADPH-cytochrome P450 reductase and substrate metabolism. Drug Metab Dispos 41, 101–110 [DOI] [PMC free article] [PubMed] [Google Scholar]
- 30.Davydova NY, Dangi B, Maldonado MA, Vavilov NE, Zgoda VG and Davydov DR (2019) Toward a systems approach to cytochrome P450 ensemble: Interactions of CYP2E1 with other P450 species and their impact on CYP1A2. Biochem. J 476, 3661–3685 [DOI] [PMC free article] [PubMed] [Google Scholar]
- 31.Davydov DR, Davydova NY, Rodgers JT, Rushmore TH and Jones JP (2017) Toward a systems approach to the human cytochrome P450 ensemble: Interactions between CYP2D6 and CYP2E1 and their functional consequences. Biochem. J 474, 3523–3542 [DOI] [PMC free article] [PubMed] [Google Scholar]
- 32.Davydov DR (2011) Microsomal monooxygenase as a multienzyme system: The role of P450-P450 interactions. Expert Opin. Drug Metab. Toxicol 7, 543–558 [DOI] [PMC free article] [PubMed] [Google Scholar]
- 33.Reed JR and Backes WL (2017) Physical studies of P450–P450 interactions: Predicting quaternary structures of P450 complexes in membranes from their X-ray crystal structures. Frontiers in Pharmacology 8, 28. [DOI] [PMC free article] [PubMed] [Google Scholar]
- 34.Reed JR and Backes WL (2016) The functional effects of physical interactions involving cytochromes P450: Putative mechanisms of action and the extent of these effects in biological membranes. Drug Metab. Rev 48, 453–469 [DOI] [PMC free article] [PubMed] [Google Scholar]
- 35.Gottlieb Y, Truman M, Cohen LA, Leichtmann-Bardoogo Y and Meyron-Holtz EG (2012) Endoplasmic reticulum anchored heme-oxygenase 1 faces the cytosol. Haematologica 97, 1489–1493 [DOI] [PMC free article] [PubMed] [Google Scholar]
- 36.Maines MD (1997) The heme oxygenase system: a regulator of second messenger gases. Annu. Rev. Pharmacol Toxicol 37, 517–554 [DOI] [PubMed] [Google Scholar]
- 37.Gozzelino R, Jeney V and Soares MP (2010) Mechanisms of cell protection by heme oxygenase-1. Annu. Rev. Pharmacol. Toxicol 50, 323–354 [DOI] [PubMed] [Google Scholar]
- 38.Abraham NG and Kappas A (2008) Pharmacological and clinical aspects of heme oxygenase. Pharmacol. Rev 60, 79–127 [DOI] [PubMed] [Google Scholar]
- 39.Reed JR (2012) Elucidating the role of biliverdin reductase in the expression of heme oxygenase-1 as a cytoprotective response to stress. In Pharmacology (Gallelli L, ed.). pp. 535–568, InTech, Rijeka, Croatia [Google Scholar]
- 40.Piantadosi CA (2008) Carbon monoxide, reactive oxygen signaling, and oxidative stress. Free Radic. Biol. Med 45, 562–569 [DOI] [PMC free article] [PubMed] [Google Scholar]
- 41.Neuzil J and Stocker R (1993) Bilirubin attenuates radical-mediated damage to serum albumin. FEBS Lett 331, 281–284 [DOI] [PubMed] [Google Scholar]
- 42.Stocker R and Peterhans E (1989) Synergistic interaction between vitamin E and the bile pigments bilirubin and biliverdin. Biochim. Biophys. Acta 1002, 238–244 [DOI] [PubMed] [Google Scholar]
- 43.Kwak JY, Takeshige K, Cheung BS and Minakami S (1991) Bilirubin inhibits the activation of superoxide-producing NADPH oxidase in a neutrophil cell-free system. Biochim. Biophys. Acta 1076, 369–373 [DOI] [PubMed] [Google Scholar]
- 44.Reed JR, Cawley GF and Backes WL (2011) Inhibition of cytochrome P450 1A2-mediated metabolism and production of reactive oxygen species by heme oxygenase-1 in rat liver microsomes. Drug Metab Lett 5, 6–16 [DOI] [PMC free article] [PubMed] [Google Scholar]
- 45.Connick JP, Reed JR, Cawley GF and Backes WL (2020) Heme oxygenase-1 affects cytochrome P450 function through the formation of heteromeric complexes: Interactions between CYP1A2 and heme oxygenase-1. J Biol Chem [DOI] [PMC free article] [PubMed] [Google Scholar]
- 46.Huber WJ III and Backes WL (2007) Expression and characterization of full-length human heme oxygenase-1: the presence of intact membrane-binding region leads to increased binding affinity for NADPH cytochrome P450 reductase. Biochemistry 46, 12212–12219 [DOI] [PMC free article] [PubMed] [Google Scholar]
- 47.Lee SH, Kang S, Dong MS, Park JD, Park J, Rhee S and Ryu DY (2015) Characterization of the Ala62Pro polymorphic variant of human cytochrome P450 1A1 using recombinant protein expression. Toxicol Appl Pharmacol 285, 159–169 [DOI] [PubMed] [Google Scholar]
- 48.Lee SH, Yu HJ, Lee S and Ryu DY (2015) Characterization of the Gly45Asp variant of human cytochrome P450 1A1 using recombinant expression. Toxicol Lett 239, 81–89 [DOI] [PubMed] [Google Scholar]
- 49.Yasukochi Y and Masters BS (1976) Some properties of a detergent-solubilized NADPH-cytochrome c(cytochrome P-450) reductase purified by biospecific affinity chromatography. J. Biol. Chem 251, 5337–5344 [PubMed] [Google Scholar]
- 50.Shen AL, Porter TD, Wilson TE and Kasper CB (1989) Structural analysis of the FMN binding domain of NADPH-cytochrome P-450 oxidoreductase by site-directed mutagenesis. J Biol. Chem 264, 7584–7589 [PubMed] [Google Scholar]
- 51.Huber WJ III, Scruggs B and Backes WL (2009) C-terminal membrane spanning region of human heme oxygenase-1 mediates a time dependent complex formation with cytochrome P450 reductase. Biochemistry 48, 190–197 [DOI] [PMC free article] [PubMed] [Google Scholar]
- 52.Huber WJ, Marohnic CC, Peters M, Alam J, Reed JR, Masters BSS and Backes WL (2009) Measurement of Membrane-Bound Human Heme Oxygenase-1 Activity Using a Chemically Defined Assay System. Drug Metabolism and Disposition 37, 857–864 [DOI] [PMC free article] [PubMed] [Google Scholar]
- 53.Maines M (1996) Carbon monoxide and nitric oxide homology: differential modulation of heme oxygenases in brain and detection of protein and activity. Methods Enzymol 268, 473–488 [DOI] [PubMed] [Google Scholar]
- 54.Maines MD and Kappas A (1974) Cobalt induction of hepatic heme oxygenase; with evidence that cytochrome P-450 is not essential for this enzyme activity. Proc. Natl. Acad. Sci. U. S. A 71, 4293–4297 [DOI] [PMC free article] [PubMed] [Google Scholar]
- 55.Kuzmic P (1996) Program DYNAFIT for the analysis of enzyme kinetic data: application to HIV proteinase. Anal. Biochem 237, 260–273 [DOI] [PubMed] [Google Scholar]
- 56.Huber WJ III, Marohnic CC, Peters M, Alam J, Reed JR, Masters BS and Backes WL (2009) Measurement of membrane-bound human heme oxygenase-1 activity using a chemically defined assay system. Drug Metab. Dispos 37, 857–864 [DOI] [PMC free article] [PubMed] [Google Scholar]
- 57.Guengerich FP (2005) Human cytochrome P450 enzymes. In Cytochrome P450: Structure, mechanism, and biochemistry (Ortiz de Montellano PR, ed.). pp. 377–382, Springer, Boston, MA [Google Scholar]
- 58.Beyrich C, Loffler J, Kobsar A, Speer CP, Kneitz S and Eigenthaler M (2011) Infection of human coronary artery endothelial cells by group B streptococcus contributes to dysregulation of apoptosis, hemostasis, and innate immune responses. Mediators Inflamm 2011, 971502. [DOI] [PMC free article] [PubMed] [Google Scholar]
- 59.Conway DE, Sakurai Y, Weiss D, Vega JD, Taylor WR, Jo H, Eskin SG, Marcus CB and McIntire LV (2009) Expression of CYP1A1 and CYP1B1 in human endothelial cells: regulation by fluid shear stress. Cardiovasc Res 81, 669–677 [DOI] [PMC free article] [PubMed] [Google Scholar]
- 60.Maamoun H, Zachariah M, McVey JH, Green FR and Agouni A (2017) Heme oxygenase (HO)-1 induction prevents Endoplasmic Reticulum stress-mediated endothelial cell death and impaired angiogenic capacity. Biochem Pharmacol 127, 46–59 [DOI] [PubMed] [Google Scholar]
- 61.Hoffman JB, Petriello MC and Hennig B (2016) Butyrate Modulates Cav-1 and Its Binding Partner AhR, Leading to Differential Cyp1a1 and Cyp1b1 Gene Expression in Vascular Endothelial Cells. Faseb Journal 30 [Google Scholar]
- 62.Fredenburgh LE, Perrella MA and Mitsialis SA (2007) The role of heme oxygenase-1 in pulmonary disease. Am J Respir Cell Mol Biol 36, 158–165 [DOI] [PMC free article] [PubMed] [Google Scholar]
- 63.Oesch F, Fabian E and Landsiedel R (2019) Xenobiotica-metabolizing enzymes in the lung of experimental animals, man and in human lung models. Arch Toxicol 93, 3419–3489 [DOI] [PubMed] [Google Scholar]
- 64.Samuelsen JT, Holme JA, Lag M, Schwarze PE, Dahl JE and Becher R (2012) Biotransformation enzymes and lung cell response to 2-hydroxyethyl-methacrylate. J Biomed Mater Res A 100, 462–469 [DOI] [PubMed] [Google Scholar]
- 65.Vijayan V, Wagener F and Immenschuh S (2018) The macrophage heme-heme oxygenase-1 system and its role in inflammation. Biochem Pharmacol 153, 159–167 [DOI] [PubMed] [Google Scholar]
- 66.Peres AG, Zamboni R, King IL and Madrenas J (2017) Suppression of CYP1 members of the AHR response by pathogen-associated molecular patterns. J Leukoc Biol 102, 1471–1480 [DOI] [PubMed] [Google Scholar]
- 67.Edwards RJ, Murray BP, Singleton AM and Boobis AR (1991) Orientation of cytochromes P450 in the endoplasmic reticulum. Biochemistry 30, 71–76 [DOI] [PubMed] [Google Scholar]
Associated Data
This section collects any data citations, data availability statements, or supplementary materials included in this article.
Supplementary Materials
Data Availability Statement
Supporting data are included within the main article and the supplementary information.