Abstract
Multi-modality medical imaging techniques have been increasingly applied in clinical practice and research studies. Corresponding multi-modal image analysis and ensemble learning schemes have seen rapid growth and bring unique value to medical applications. Motivated by the recent success of applying deep learning methods to medical image processing, we first propose an algorithmic architecture for supervised multi-modal image analysis with cross-modality fusion at the feature learning level, classifier level, and decision-making level. We then design and implement an image segmentation system based on deep Convolutional Neural Networks (CNN) to contour the lesions of soft tissue sarcomas using multi-modal images, including those from Magnetic Resonance Imaging (MRI), Computed Tomography (CT) and Positron Emission Tomography (PET). The network trained with multi-modal images shows superior performance compared to networks trained with single-modal images. For the task of tumor segmentation, performing image fusion within the network (i.e. fusing at convolutional or fully connected layers) is generally better than fusing images at the network output (i.e. voting). This study provides empirical guidance for the design and application of multi-modal image analysis.
Keywords: Multi-modal Image, Magnetic Resonance Imaging (MRI), Computed Tomography (CT), Positron Emission Tomography (PET), Convolutional Neural Network
I. INTRODUCTION
In the field of biomedical imaging, use of more than one modality (i.e. multi-modal) on the same target has become a growing field as more advanced techniques and devices have become available. For example, simultaneous acquisition of Positron Emission Tomography (PET) and Computed Tomography (CT) [1] has become a standard clinical practice for a number of applications. Functional imaging techniques such as PET which lacks anatomical characterization while providing quantitative metabolic and functional information about diseases can work together with CT and Magnetic Resonance Imaging (MRI) which provide details on anatomic structures via high contrast and spatial resolution to better characterize lesions [2]. Another widely-used multi-modal imaging technique in neuroscience studies is the simultaneous recording of functional Magnetic Resonance Imaging (fMRI) and electroencephalography (EEG) [3], which offers both high spatial resolution (through fMRI) and temporal resolution (through EEG) on brain dynamics.
Correspondingly, various analyses using multi-modal bio-medical imaging and computer-aided detection systems have been developed. The premise is that various imaging modalities encompass abundant information which is different and complementary to each other. For example, in one deeplearning based framework [4], automated detection of solitary pulmonary nodules were implemented by first identifying suspect regions from CT images, followed by merging them with high-uptake regions detected on PET images. As described in a multi-modal imaging project for brain tumor segmentation [5], each modality reveals a unique type of biological/biochemical information for tumor-induced tissue changes and poses “somewhat different information processing tasks”. Similar concepts have been proposed in the field of ensemble learning [6], where decisions made by different methods are fused by a “meta-learner” to obtain the final result, based on the premise that the different priors used by these methods characterize different portions or views of the data.
There is a growing amount of data available from multimodal medical imaging and a variety of strategies for the corresponding data analysis. In this work we investigate the differences among multi-modal fusion schemes for medical image analysis, based on empirical studies in a segmentation task. In their review, James and Dasarathy provide a perspective on multi-modal image analysis [7], noting that any classical image fusion method is composed of “registration and fusion of features from the registered images”. It is also noted in the survey work of [8], that networks representing multiple sources of information “can be taken further and channels can be merged at any point in the network.”
Motivated by this perspective, we advance one step further from the abstraction of image fusion methods in [7] and propose an algorithmic architecture for image fusion strategies that can cover most supervised multi-modal biomedical image analysis methods. This architecture also addresses the need for a unified framework to guide the design of methodologies for multi-modal image processing. Based on the main stages of machine learning models, our design includes fusing at the feature level, fusing at the classifier level, and fusing at the decision-making level. We further propose that optimizing a multi-modal image analysis method for a specific application should consider the possibility of all the three strategies and select the most suitable one for the given use case.
Successes in applying deep Convolutional Neural Networks (CNN) for natural image [9] and medical image [10, 11] processing have been recently reported. Further, for the task of automatic tumor segmentation, CNN have been applied to segmentation of tumors in brain [5, 12, 13], liver [14], breast [15], lung [16, 17] and other regions [18]. These deep learning-based methods have achieved superior performance compared to traditional methods (such as level set or region growing), with good robustness towards common challenges in medical image analysis including noise and subject-wise heterogeneity. Deep learning on multi-modal images (which are also referred to as multi-source / multi-view images) is an important topic with growing interest in the computer vision and machine learning community. To name a few, works in [19] proposed the cross-modality feature learning scheme for shared representation learning. Work in [20] developed a multi-view deep learning model with deep canonical correlated autoencoder and shared representation to fuse two views of data. Similar multi-source modeling has also been applied for image retrieval [21] by incorporating view-specific and view-shared nodes in the network. In addition to correlation analysis, consistency evaluation across different information sources is used by multi-source deep learning framework in [22] to estimate trustiness of information sources. When image views/sources are unknown, the multi-view perceptron model introduced in [23] explicitly perform classification on views of the input images as an added route in the network. Various methods have also been developed for deep learning-based works for multi-modal / multi-view medical analysis. For example, work in [24] used shared image features from unregistered views of the same region to improve classification performance. Framework proposed in [25] fuses imaging data with non-image modalities by using a CNN to extract image features and jointly learn their non-linear correlations using another deep learning model. The multi-modal feature representation framework introduced in [26] fuses information from MRI and PET in a hierarchical deep learning approach. The unsupervised multimodal deep belief network [27] encoded relationships across data from different modalities with data fusion through a joint latent model.
However, there has been little investigation from a systematic perspective about how multi-modal imaging should be used. There are few empirical studies on how different fusing strategies can affect segmentation performance. In this work we address this problem by testing different fusion strategies through different implementations of CNN architecture.
A typical CNN for supervised image classification consists of: 1) convolutional layers for feature/representation learning, which utilize local connections and shared weights of the convolutional kernels followed by pooling operators, resulting in translation invariant features; and 2) fully connected layers for classification, which use high-level image features extracted from the convolutional layers as input to learn the complex mapping between image features and labels. CNN is a suitable platform to test and compare the different fusion strategies as proposed above in a practical setting, as we can customize the fusion location in the network structure: either at the convolutional layers, fully connected layers or network output.
II. MATERIALS AND METHODS
A. Algorithmic architecture for multi-modal image fusion strategies and summary of related works
As any supervised learning-based method consists of three stages: feature extraction/learning, classification (based on features), and decision making (usually a global classification problem but varies), we summarize the three strategies for fusing information from different image modalities, as shown below:
Fusing at feature level: multi-modality images are used together to learn a unified image feature set, which shall contain the intrinsic multi-modal representation of the data. The learned features are then used to support the learning of a classifier.
Fusing at the classifier level: images of each modality are used as separate inputs to learn individual feature sets. These single-modality feature sets will be then used to learn a multi-modal classifier. Learning the single-modality features and learning the classifier can be conducted in an integrated framework or separately (e.g. using unsupervised methods for learning the single-modality features then train a multi-modality classifier).
Fusing at the decision-making level: images of each modality are used independently to learn a single-modality classifier (and the corresponding feature set). The final decision of the multi-modality scheme is obtained by fusing the output from all the classifiers, which is commonly referred to as “voting” in the literate [6], although the exact scheme of decision making varies across methods.
Any practical scenario using supervised learning on multi-modal medical images belongs to one of these fusion strategies, and most of the current literature reports can be grouped accordingly. Works in [28] (co-analysis of fMRI and EEG using CCA), [29] (co-analysis of MRI and PET using PLSR) and [30] (co-learning features through pulse-coupled neural network) perform feature-level fusion of the images. Works in [31] (using features of contourlets), [32] (using feature of wavelet), [33] (using features of wavelets) and [34] (using features learned by Linear Discriminant Analysis) perform the classifier-level fusion. Several other works in image segmentation such as [35] (fusing the results from different atlases by majority voting) and [36] (fusing the Support Vector Machine results from different modalities by majority voting), as well as the Multimodal Brain Tumor Segmentation (BRATS) framework [5] (using majority vote for fusing results from different algorithms, rather than modalities) belong to decision-level fusion.
B. Data acquisition and preprocessing
In this work, we use the publicly available soft-tissue sarcoma (STS) dataset [37] from the Cancer Imaging Archive (TCIA) [38] for model development and validation. MRI is mainly used for the diagnosis of soft tissue sarcoma, while other options including computed tomography (CT) or ultrasound [39, 40]. As STS poses high risk of metastasis (especially to lung) leading to low survival rates, a comprehensive characterization of STSs including imagingbased biomarker identification is a crucial task for better adapted treatment. Accurate segmentation of the tumor region plays an important role for image interpretation, analysis and measurement. The soft-tissue sarcomas dataset contains a total of four imaging modalities: FDG-PET/CT and two anatomical MR imaging sequences (T1-weighted and T2-weighted fatsaturated). Images from all those four modalities have been pre-registered to the same space. It should be noted that throughout this work we regard T1- and T2-weighted imaging as two “modalities” because they portray different tissue characteristics. The STS data set encompasses 50 patients with histologically proven STSs of the extremities. The FDG-PET scans were performed on a PET/CT scanner (Discovery ST, GE Healthcare, Waukesha, WI) at the McGill University Health Centre (MUHC). PET attenuation corrected images were reconstructed (axial plane) using an ordered subset expectation maximization (OSEM) iterative algorithm. PET slice thickness resolution was 3.27mm and the median in-plane resolution was 5.47×5.47mm2. For MRI imaging, T1 sequences were acquired in the axial plane for all patients while T2 (or short tau inversion recovery (STIR)) sequences were scanned in different planes. The median in-plane resolution for T1-weighted MR imaging was 0.74×0.74mm2 and T2-weighted MR was 0.63×0.63mm2. The median slice thickness was 5.5mm and 5.0mm for T1 and T2, respectively.
The gross tumor volume (GTV) was manually annotated based on the T2-weigthed MR images by expert radiologists with access to the other modalities. After drawing the GTV on T2 images, corresponding contours of these annotations for the other modalities were then obtained using rigid registration with the commercial software MIM®(MIM software Inc., Cleveland, OH). As the PET/CT images have a much larger fields of view (FOV) than the MR images, they were truncated to the regions with MR images. In addition, the PET images were first converted to standardized uptake values (SUV) and linearly up-sampled to the same resolution of other modalities. Pixel values for all three modalities are linearly normalized to the value interval of 0∼255 according to the original pixel value.
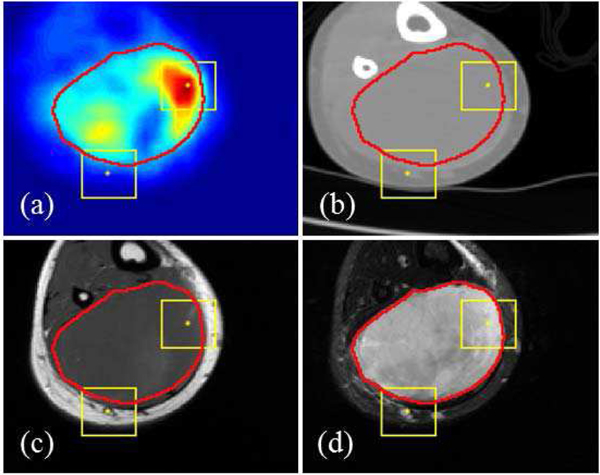
The final data used as input in this analysis has four modalities of imaging (PET, CT, T1 and T2 MR), all in the same image size for each subject while the size varies across different subjects. A sample multi-modal image set is illustrated in Fig. 1. In the analysis, image patches with the size of 28×28 are extracted from all images. A patch is labeled as ‘positive’ if its center pixel is within the annotation (i.e. tumor-positive) region and labeled as ‘negative’ otherwise. On average, around 1 million patches were extracted from each subject, with around 0.1 million ‘positive’ patches. During the training phase, to balance the number of positive and negative patches, we randomly selected negative patches to the same number of positive patches. During the testing phase, we used all the patches for segmentation.
Fig. 1.
Multi-modal images on the same position from a randomly-selected subject. (a): PET; (b): CT; (c): T1; (d): T2. The image size of this subject is 133×148. Red line is the contour of ground truth from manual annotation. Two yellow boxes illustrate the size of patches (28×28) used as the input for CNN. The center pixel of one patch is within the tumor region and another patch outside the tumor region.
C. Multi-modal Image Classification Using CNN
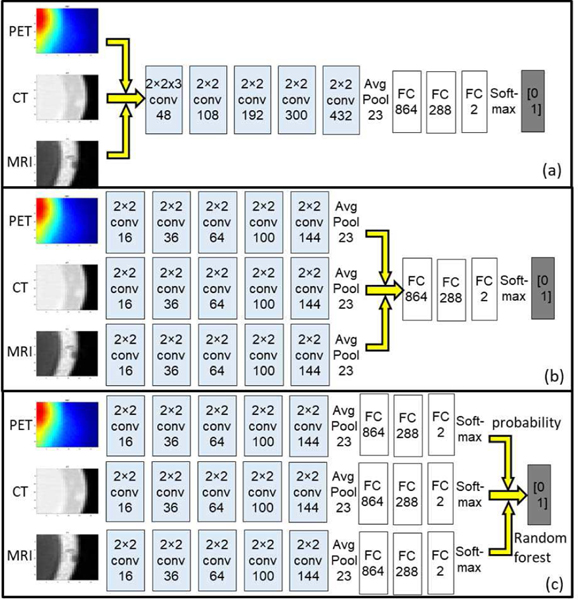
We implemented and tested the three fusion strategies in three different patch-based CNNs with corresponding variations in network structures, as illustrated in Fig. 2: The Type-I fusion network represents feature-level fusing; the Type-II fusion network represents classifier-level fusing; and the Type-III fusion network represents decision-level fusion. All the networks use same set of image patches as input. The network outputs, which are the labels of the given patches, are aggregated by assigning the corresponding label to the pixel in the patch center in the output label maps. All the single and multi-modal networks were implemented in TensorFlow and run on a single NVIDIA 1080Ti GPU. Training time for a single-modal network on the current dataset was around 3 hours. For multi-modal networks of all types, the training time was around 10 hours. Testing time (i.e. segmentation on new images) of any single or multi-modal network was negligible (<2 minutes).
Fig. 2.
Illustration of the structure for (a) Type-I fusion networks, (b) Type-II fusion network and (c) Type-III fusion network. The yellow arrows indicate the fusion location
For the Type-I fusion network, patches from different modalities are transformed into a 3D tensor (28×28×k, where k is the number of modalities) and convoluted by a 2×2×k kernel as shown in Fig. 2a, to fuse the high-dimensional features to the 2D space thus performing the feature-level fusion. Outputs from the k-dimensional kernel are then convoluted by typical 2×2 kernels. For the Type-II fusion network, the features are learned separately through each modality’s own convolutional layers. Outputs of the last convolutional layers from each modality, which are considered the high-level representation of the corresponding images, are used to train a single fully connected network (i.e. classifier), as in Fig. 2b.
For the Type-III fusion network, for each modality we train a single-modal 2D CNN to map its own image to the annotation. The prediction results (i.e. patch-wise probability) of these single-modality networks are then ensembled together to obtain the final decision (i.e. patch-wise label). The ensemble can be done in many ways: the simplest form is majority voting (i.e. label of a patch is set to the majority label from classifiers). In this work we utilized the random forest algorithm [41] to train a series of decision trees for the patch-wise label classification, as random forest has been shown to be capable of achieving better generalizability and avoid overfitting in many applications. The random forest algorithm uses bootstrap sampling of the data to learn a set of decision trees, where a random subset of data is used at each decision split. Details of implementation can be found in [42]. The random forest algorithm in this study uses an ensemble of 10 bagged decision trees, each tree with maximum depth of 5. These hyper parameters were determined through grid search.
D. Experiments on synthetic low-quality images
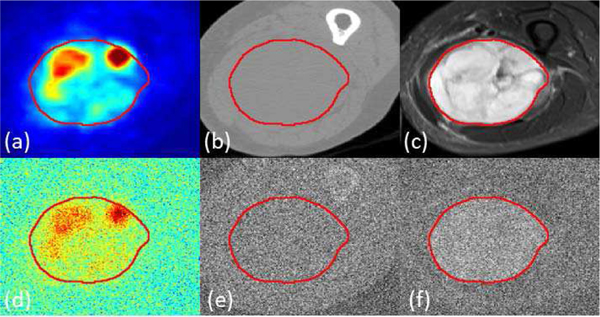
While it is expected that multi-modal imaging should offer additional information for lesion classification resulting in better performance compared with single-modality methods, it is interesting to investigate the extent of such a benefit. To answer this question, and at the same time simulate a practical scenario of low-dose imaging, we generated synthetic low-quality images by adding random Gaussian noise into the original images and used them for training and testing in both the single-modality and multi-modality networks, following the same 10-folds cross-validation scheme. Images after adding Gaussian noise were normalized to the same value interval as the original images to ensure similar settings in the imaging parameters. A sample multi-modal image before and after adding noise is visualized in Fig. 3.
Fig. 3.
Sample multi-modal image before and after adding Gaussian noise: (a) Ground truth shown as red contour overlaid on PET image, (b) CT image (c) T2 image. After adding noise, (d) PET image, (e) CT image and (f) T2 image. The magnitude factor k equals to 1.
As seen in Fig. 3, when the noise magnitude is 1 (standard deviation equal to the 90% of the cumulative histogram distribution value of the image), low-quality PET images maintain good contrast of the tumor region with blurred boundaries. Similarly, tumor regions can be visually identified from the low-quality T2 image, but the contrast is very low. On the other hand, the contrast of CT image after adding noise became so low that tumors cannot be distinguished from background. Apparently performing segmentation on these synthetic images will be challenging for certain modalities, which is similar to the case of low-dose image analysis.
E. Segmentation and performance evaluation
The whole image set containing PET, CT and MR T1-weighted and T2-weighted images from 50 patients were divided into training (including validation) and testing sets, based on the 10-folds cross-validation scheme. In each run of the cross-validation experiment for the single-modality and type I/II networks, PET+CT+T1 or PET+CT+T2 images from 45 patients were used for training the 3-modality network, while the remaining 5 patients were used for testing and performance evaluation. With a total of 10 runs, images from every patient were tested. In each run, the same number (around 5 million) of ‘positive’ and ‘negative’ samples were used as training input. Model performances were evaluated based on pixel-wise accuracy by comparing the predicted label with the ground truth from human annotation, as well as Sørensen–Dice coefficient [43] (DICE coefficient) which equals to twice the number of voxels within both regions divided by the summed number of voxels in each region to measure the similarity between predicted region and annotation region. It should be noted while labels of all the patches from the 5 test patients in each run were predicted during the testing phase, we calculated the prediction result based on equal numbers of positive and negative patches, in order to overcome the problem of unbalanced samples. For the Type-III network with random forest, the prediction was based on the single modality networks in the 10-folds cross validation. Patch-wise probabilities of each patch being within the tumor region from the single-modality networks are then combined to train a random forest (training labels of the patches are ground truth) in the same 10-folds cross validation approach.
We also performed comparison between the model performance using three modalities (PET, CT, MRI T1 or T2) and two modalities (PET+CT, CT+T2, and PET+T2). Hyper parameters remain similar for these networks with alteration of network structure for the number of modalities. For example, multi-modal PET+CT fusion Type-I network has two input channels, the images will go through 2×2×2 convolutional kernel followed by 2D 2×2 kernels. All fused networks were implemented with Type-I, Type-II and Type-III strategies. Raw outputs of the networks, which are of patch-wise classification results, were transformed to the “label map” by assigning each pixel in the input image the label of the patch centered at it.
III. RESULTS
A. Performances comparison between single-modality networks and multi-modality fusion networks
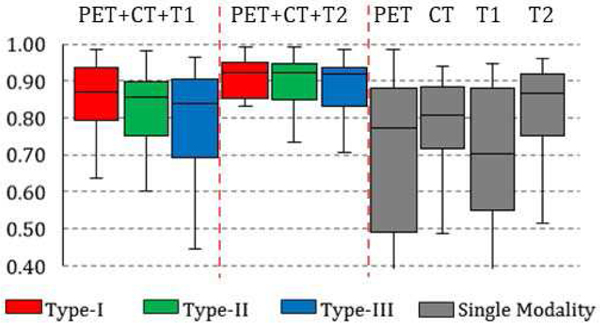
DICE coefficient of single and multi-modality networks are summarized in the box charts of Fig. 4: average DICE of Type-I, II and III fusion networks on PET+CT+T1 is 82%, 80% and 77%. Average DICE of Type-I, II and III fusion networks on PET+CT+T2 is 85%, 85% and 84%. Average performance of a single-modality network is 76%, 68%, 66% and 80% for PET, CT, T1 and T2 images. From the statistics, it can be seen that the DICE of single-modality networks are all lower than the multi-modality fusion networks, while no network achieved result higher than 80%. The networks trained and tested on the T2-weighted MR had the best performance. The reason is that: 1) annotation is performed on T2 images, and 2) T2 relaxation is more sensitive to soft-tissue sarcomas, as illustrated in Fig. 1d. It is also interesting to observe that the performance of PET-based network is the worst in average while PET is designed to detect the tumor presence. This is mainly caused by the necrosis in the center of large tumor which barely show uptake in FDG-PET images.
Fig. 4.
Box chart for the statistics (median, first/third quartile and the min/max) of the DICE coefficient across 50 subjects. Each box corresponds to one specific type of network trained and tested on one specific combination of modalities. For example, the first box from the left shows the prediction statistics of Type-I fusion network trained and tested on images from PET, CT and T1-weighted MR imaging modalities.
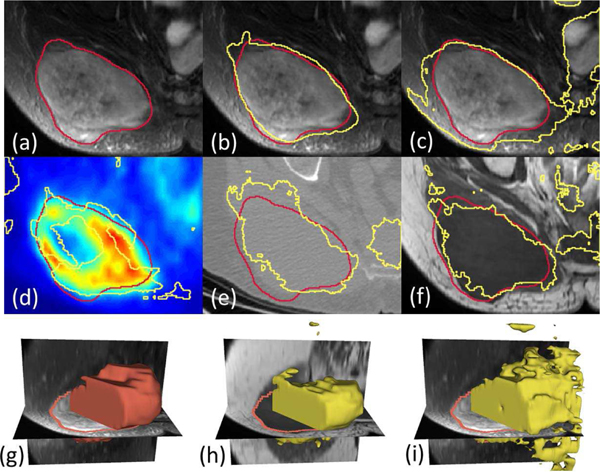
Although the annotation was mainly performed on the T2-weighted images, the fusion network trained and tested on the combination of PET, CT and T1 (without T2) achieved better result, on average compared to the single-modality network based on T2 images (by around 2% improvement). Such result shows that while modalities other than T2 might be inaccurate and/or insufficient to capture the tumor region in single, the fusion network (using any of the fusion scheme) can automatically take advantage of the combined information. An illustrative example is shown in Fig. 5, where the multi-modality fusion network Fig. 5(b) can obtain the better result comparing with T2-based single modality network (c). A closer examination of the single modality networks based on PET, CT and T1 shows that neither of these three modalities can lead to a good prediction: PET (d) suffers from the necrosis in the center issue as discuss above, while a large region of false positive is presented in CT, T1 and T2 results (c, e, and f).
Fig. 5.
(a) Ground truth shown as red contour line overlaid on T2-weighted MR image. (b) Result from Type-II fusion network based on PET+CT+T1. (c) Result from single-modality network based on T2. (d-f) Results from single-modality network based on PET, CT and T1, respectively. (g) 3D surface visualization of the ground truth. (h) 3D surface visualization of the result from Type-III fusion network based on PET+CT+T1. (i) 3D surface visualization of the result from single-modality network based on T2.
B. Performance comparison on synthetic low-quality image
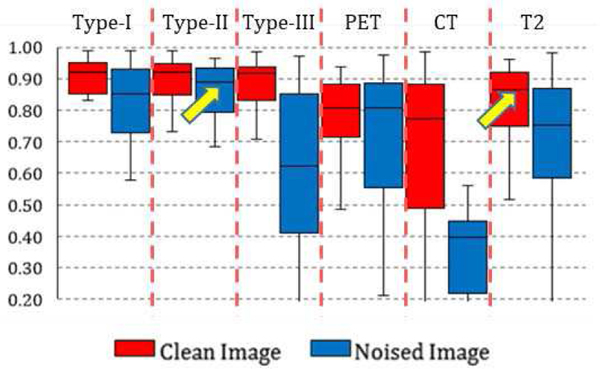
By training and testing the single-modality and multi-modality networks on the synthetic low-quality images with Gaussian noise, we obtained label maps and corresponding prediction accuracies. Model performance on both original images and low-quality images are summarized in Fig. 6, under the noise magnitude k of 1. From the statistics, three important observations can be made:
Fig. 6.
Box chart for the statistics (median, first/third quartile and the min/max) of the DICE coefficient across 50 subjects. Red box stands for networks trained and tested on original clean images, blue box stands for networks based on synthetic noised image.
First, when the image quality degrades, the segmentation performance decreased for all the networks. However, the level of decrease for single-modality networks was far higher than the multi-modality networks. For example, the result of segmentation on single-modality low-quality CT images decreases to random guessing, which is in correspondence with what has been observed in Fig. 3. On the other hand, performance of all type I, and II networks only slightly decrease: their DICE measurements are all above 80%.
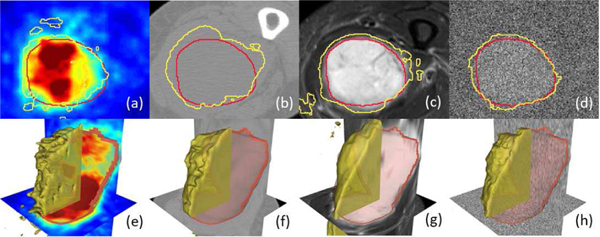
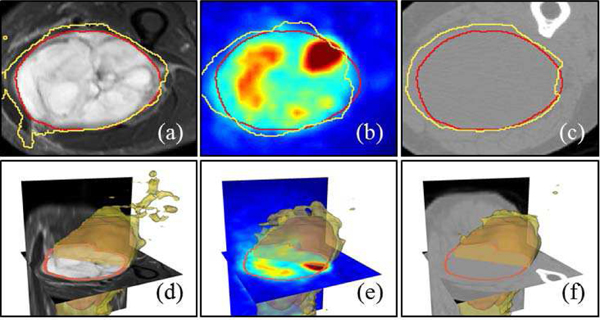
Second, it is interesting to find that the performance of multi-modality networks based on low-quality images is on the same level or even higher than the performance of single-modality networks based on original images, as indicated by the arrows in Fig. 6. The observation indicates that multi-modal imaging can be useful in low-image quality settings (such as low-dose scans), as its analytic performance is far less impacted by the degraded image quality. Fig. 7 shows an example consisting of the results from three single modality networks (on original image) and one Type-II fusion network (on low-quality image). Networks based on PET as a single modality cannot define correct tumor boundaries while at the same time they generate false positives outside the tumor region. Networks based on single CT and T2 MRI can delineate the rough tumor boundaries but with either false positive outliers (Fig. 5c, from T2) or incorrect boundary definition (Fig. 7b, from CT). On the other hand, the performance of a multi-modal fusion network on the same subject is clearly superior (Fig. 7d), although it was trained and tested on noised images (as visualized in the background). Further examination of multi-modal fusion network performance on low-quality images with different noise magnitudes shows that on low-to-mid noise magnitudes (k=0.5/1), the performance of multi-modal fusion networks is similar to performance on original clean images. Specifically, for k=0.5 (i.e. standard deviation of Gaussian noise is almost half of the image intensity), there is no significant difference (p<0.05) between the segmentation result on original and noised images for each subject. At higher noise magnitudes (k=2), the model performance deteriorates to below 80% (0.62% for Type-I, 75% for Type-II and 52% for Type-III fusion networks), which is worse than the single-modality performance on T2 images.
Fig. 7.
network result on different modalities. Contour line of the ground truth annotation (red line) and network performance (yellow line) (a) single PET network on PET image (b) single CT network on CT image (c) single T2 network on T2 image (d) fused noisy PET/CT T2 image on noisy T2. (e)-(h) 3D surface visualization of the segmentation results in (a)-(d).
Third, among different fusion strategies, fusion networks of Type-I and II perform largely the same per the statistics, both on original images and on low-quality noised images. While Type-III networks with random forest have consistently worse performance. It is important to find it performs the worst among the three strategies, as it is commonly applied in multi-modal image studies. Finally, with regard to the computational complexity which affects training and testing time as well as hardware cost, and the ease of implementation, networks with earlier fusion (Type-I) are superior for their simplicity in model structure.
C. Performance comparison using different modality combinations
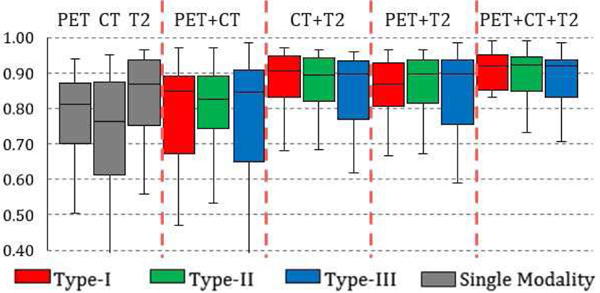
Based on the observations on model performance difference between multi-modal and single-modal networks and the detailed investigation of the label maps from network results, we have found that additional imaging modalities can offer new information to the segmentation task even with lowered image quality. Yet it is still unclear how (and whether) different modalities contribute to the multi-modality network. In other words, if little or no performance increase is consistently observed from a certain combination of imaging modalities compared with its single-modality counterpart, then we can conclude that the extra modality is not contributing to the segmentation task. To this end, we trained and tested the multi-modal fusion networks on additional combinations of imaging modalities as introduced in the methods section. Statistics of the performance of these networks are summarized in Fig. 8.
Fig. 8.
Box chart for the statistics (median, first/third quartile and the min/max) of the DICE coefficient across 50 subjects. Red box stands for network train and test on type I network, blue box stands for type II network and green stands for type III. Performance of single-modality network are shown as grey boxes to the left for reference.
From Fig. 8, it can be observed that a fusion network based on PET+T2 has similar but lowered performance compared to a fusion network based on PET+CT+T2, showing CT has a limited contribution to the segmentation. More importantly, a fusion network based on PET+CT has significantly (p<0.05) higher performance than single-modality networks on PET or CT for Type-I and Type-II fusion strategies, indicating that a low-contrast imaging modality (such as CT) can significantly improve the segmentation accuracy for functional imaging (PET). To further illustrate this, Fig. 9 is an example case of segmentation from a single-modality network based on T2 images, a multi-modality network based on T2+PET images and a multi-modality network based on T2+PET+CT images. By gradually adding extra modalities, the resulting tumor region segmentation is showed corresponding improvements: a single-modality T2 network can delineate a rough boundary of the tumor but also generates false positives in the bottom left corner due to the confusing boundaries of the anatomical structures. This error is then corrected by utilizing functional information from PET images (where such anatomical deviations show little contrast) to form a multi-modal fusion network (Fig. 9b). By incorporating CT images, the segmentation boundary is further smoothed, achieving the best possible performance.
Fig. 9.
Contour line of the ground truth annotation (red line) and segmentation result (yellow line): (a) Single-Modality network on T2 (b) Multi-modality network on T2+PET (Type-I) (c) Multi-Modalities network on T2+PET+CT. (d)-(f) 3D surface visualization of the segmentation results in (a)-(c).
IV. CONCLUSION AND DISCUSSION
Based on the network performance comparison, we empirically demonstrate several findings. First, comparison results between multimodality and single modality networks in section III-A and III-B show that multi-modal fusion networks perform better than single-modal networks. More interestingly, fusion networks based on synthetic low-quality images perform better than single-modality networks on high-quality images, at certain noise levels. This finding brings in new evidence for the benefit of multi-modal imaging in medical applications in which one of the modalities can only provide images with limited quality, such as screening or low-dose scans. It is then a better option to utilize more than one modality for better analytics.
Second, comparison results of fusion strategies in section III-A shows that for the task of tumor region segmentation using CNN, performing fusion within the network (at the convolutional layer or fully connected layer) is better than outside the network (at network output through voting), even when the voting weights are learned by using sophisticated classification algorithms such as random forest. As voting is commonly used by multi-modal analytics, this conclusion could provide empirical guidance for the corresponding model design (e.g. consider an integrated multi-modal framework through registration rather than voting).
Third, modality combination results in section III-C show that multi-modal fusion networks can take advantage of the additional anatomic or physiological characterizations provided by different modalities, even if the extra modality can only provide limited contrast in the target region. This conclusion is in accordance with “weak learnability” in the field of ensemble learning [44], indicating that as long as a learner (or source of information, as the imaging modality in this context) can perform slightly better than random guessing, it can be added into a learning system to improve its performance.
Although we have only tested the framework on a single dataset using one set of simple network structures, most of the current conclusions we draw from the empirical results are not dependent upon the exact data used. We are aiming to test more network structures including end-to-end semantic segmentation networks, on datasets with more types of modalities in future work.
In addition, as fully convolutional neural network such as U-Net [45] has been widely used in medical image analysis especially semantic segmentation, we performed the same segmentation task using U-Net based on Type-I fusion scheme. Structure of U-Net used in this work consists of 4 convolution layers for encoding and 4 deconvolution layers for decoding, in accordance with input image size (128×128). Other model parameters and implementation details can be found in our previous work [46]. Comparison between the segmentation result from U-Net-based and CNN-based fusion networks (all Type-I) shows that these two methods achieved very similar performance, with relative difference<0.5%. This result shows that with the same fusion scheme, actual performance is similar for different segmentation methods (e.g. between patch-based and encoder-decoder-based methods). Further, it shows that fusion schemes introduced in this work is not dependent on the implementation of segmentation, thus it can serve as a general design rule for multi-modal image segmentation.
Our algorithmic architecture (three fusion strategies) only covers supervised, classification-purposed methods. Yet we also note that there exist unsupervised methods in medical image analysis such as gradient flow-based methods for image segmentation [47], as well as well-established deformable image registration algorithms [48]. These unsupervised methods can also be applied to multi-modal images, while their fusion schemes can be studied by an extension of the current framework.
While the empirical study is performed on a well-registered image dataset, we recognize that registration across different imaging modalities is a vital part of any fusion model. All three types multi-modal fusion networks used in this study assumes good voxel-level correspondence, while erroneous registration across different modalities in an incoming patient can lead to dramatically decreased prediction performance within the misaligned region, depending on the number of modalities affected by the misalignment and its severity. This limitation has inspired us for a plan to develop an integrated framework consisting of iterative segmentation and registration through alternative optimization, with shared multi-modal image features.
ACKNOWLEDGMENT AND NOTES
This work is supported by the National Institutes of Health under grant 1RF1AG052653-01A1, 1P41EB022544-01A1 and C06 CA059267. Zhe Guo is supported by China Scholarship Council. We thank MGH & BWH Center for Clinical Data Science for computational resources and Dr. James Thrall for proofreading the manuscript.
Contributor Information
Zhe Guo, School of Information and Electronics, Beijing Institute of Technology, China.
Xiang Li, Massachusetts General Hospital, USA.
Heng Huang, Department of Electrical and Computer Engineering, University of Pittsburgh, USA..
Ning Guo, Massachusetts General Hospital, USA.
Quanzheng Li, Massachusetts General Hospital, USA.
REFERENCES
- [1].Beyer T, Townsend DW, Brun T, Kinahan PE, Charron M, Roddy R, Jerin J, Young J, Byars L, and Nutt R, “A Combined PET/CT Scanner for Clinical Oncology,” Journal of Nuclear Medicine, vol. 41, no. 8, pp. 1369–1379, 2000. [PubMed] [Google Scholar]
- [2].Bagci U, Udupa JK, Mendhiratta N, Foster B, Xu Z, Yao J, Chen X, and Mollura DJ, “Joint segmentation of anatomical and functional images: Applications in quantification of lesions from PET, PET-CT, MRI-PET, and MRI-PET-CT images,” Medical Image Analysis, vol. 17, no. 8, pp. 929–945. [DOI] [PMC free article] [PubMed] [Google Scholar]
- [3].Czisch M, Wetter TC, Kaufmann C, Pollmächer T, Holsboer F, and Auer DP, “Altered Processing of Acoustic Stimuli during Sleep: Reduced Auditory Activation and Visual Deactivation Detected by a Combined fMRI/EEG Study,” NeuroImage, vol. 16, no. 1, pp. 251–258, 2002. [DOI] [PubMed] [Google Scholar]
- [4].Teramoto A, Fujita H, Yamamuro O, and Tamaki T, “Automated detection of pulmonary nodules in PET/CT images: Ensemble false-positive reduction using a convolutional neural network technique,” Medical Physics, vol. 43, no. 6Part1, pp. 2821–2827, 2016. [DOI] [PubMed] [Google Scholar]
- [5].Menze BH, Jakab A, Bauer S, Kalpathy-Cramer J, Farahani K, Kirby J, Burren Y, Porz N, Slotboom J, Wiest R, Lanczi L, Gerstner E, Weber MA, Arbel T, Avants BB, Ayache N, Buendia P, Collins DL, Cordier N, Corso JJ, Criminisi A, Das T, Delingette H, Durst DÇCR, Dojat M, Doyle S, Festa J, Forbes F, Geremia E, Glocker B, Golland P, Guo X, Hamamci A, Iftekharuddin KM, Jena R, John NM, Konukoglu E, Lashkari D, Mariz JA, Meier R, Pereira S, Precup D, Price SJ, Raviv TR, Reza SMS, Ryan M, Sarikaya D, Schwartz L, Shin HC, Shotton J, Silva CA, Sousa N, Subbanna NK, Szekely G, Taylor TJ, Thomas OM, Tustison NJ, Unal G, Vasseur F, Wintermark M, Ye DH, Zhao L, Zhao B, Zikic D, Prastawa M, Reyes M, and Leemput KV, “The Multimodal Brain Tumor Image Segmentation Benchmark (BRATS),” IEEE Transactions on Medical Imaging, vol. 34, no. 10, pp. 1993–2024, 2015. [DOI] [PMC free article] [PubMed] [Google Scholar]
- [6].Rokach L, “Ensemble-based classifiers,” Artificial Intelligence Review, vol. 33, no. 1, pp. 1–39, 2010. [Google Scholar]
- [7].James AP, and Dasarathy BV, “Medical image fusion: A survey of the state of the art,” Information Fusion, vol. 19, no. Supplement C, pp. 4–19, 2014. [Google Scholar]
- [8].Litjens G, Kooi T, Bejnordi BE, Setio AAA, Ciompi F, Ghafoorian M, van der Laak JAWM, van Ginneken B, and Sánchez CI, “A survey on deep learning in medical image analysis,” Medical Image Analysis, vol. 42, pp. 60–88, 2017. [DOI] [PubMed] [Google Scholar]
- [9].LeCun Y, Bengio Y, and Hinton G, “Deep learning,” Nature, vol. 521, no. 7553, pp. 436–444, 2015. [DOI] [PubMed] [Google Scholar]
- [10].Shen D, Wu G, and Suk H-I, “Deep Learning in Medical Image Analysis,” Annual Review of Biomedical Engineering, 2016. [DOI] [PMC free article] [PubMed] [Google Scholar]
- [11].Thrall JH, Li X, Li Q, Cruz C, Do S, Dreyer K, and Brink J, “Artificial Intelligence and Machine Learning in Radiology: Opportunities, Challenges, Pitfalls, and Criteria for Success,” Journal of the American College of Radiology, vol. 15, no. 3, pp. 504–508, 2018. [DOI] [PubMed] [Google Scholar]
- [12].Havaei M, Davy A, Warde-Farley D, Biard A, Courville A, Bengio Y, Pal C, Jodoin P-M, and Larochelle H, “Brain tumor segmentation with Deep Neural Networks,” Medical Image Analysis, vol. 35, pp. 18–31, 2017. [DOI] [PubMed] [Google Scholar]
- [13].Pereira S, Pinto A, Alves V, and Silva CA, “Brain Tumor Segmentation Using Convolutional Neural Networks in MRI Images,” IEEE Transactions on Medical Imaging, vol. 35, no. 5, pp. 1240–1251, 2016. [DOI] [PubMed] [Google Scholar]
- [14].Christ PF, Elshaer MEA, Ettlinger F, Tatavarty S, Bickel M, Bilic P, Rempfler M, Armbruster M, Hofmann F, D’Anastasi M, Sommer WH, Ahmadi S-A, and Menze BH, “Automatic Liver and Lesion Segmentation in CT Using Cascaded Fully Convolutional Neural Networks and 3D Conditional Random Fields,” Medical Image Computing and Computer-Assisted Intervention – MICCAI 2016, pp. 415–423, 2016. [Google Scholar]
- [15].Rouhi R, Jafari M, Kasaei S, and Keshavarzian P, “Benign and malignant breast tumors classification based on region growing and CNN segmentation,” Expert Systems with Applications, vol. 42, no. 3, pp. 990–1002, 2015. [Google Scholar]
- [16].Wang S, Zhou M, Liu Z, Liu Z, Gu D, Zang Y, Dong D, Gevaert O, and Tian J, “Central focused convolutional neural networks: Developing a data-driven model for lung nodule segmentation,” Medical Image Analysis, vol. 40, pp. 172–183, 2017. [DOI] [PMC free article] [PubMed] [Google Scholar]
- [17].Feng X, Yang J, Laine AF, and Angelini ED, “Discriminative Localization in CNNs for Weakly-Supervised Segmentation of Pulmonary Nodules,” in Medical Image Computing and Computer-Assisted Intervention - MICCAI 2017, Cham, 2017, pp. 568–576. [DOI] [PMC free article] [PubMed] [Google Scholar]
- [18].Jiazhou W, Jiayu L, Gan Q, Lijun S, Yiqun S, Hongmei Y, Zhen Z, and Weigang H, “Technical Note: A deep learning-based autosegmentation of rectal tumors in MR images,” Medical Physics, vol. 45, no. 6, pp. 2560–2564, 2018. [DOI] [PubMed] [Google Scholar]
- [19].Ngiam J, Khosla A, Kim M, Nam J, Lee H, and Ng AY, “Multimodal Deep Learning,” in International Conference on Machine Learning, 2011. [Google Scholar]
- [20].Wang W, Arora R, Livescu K, and Bilmes J, “On deep multi-view representation learning,” in Proceedings of the 32nd International Conference on International Conference on Machine Learning - Volume 37, Lille, France, 2015, pp. 1083–1092. [Google Scholar]
- [21].Kang Y, Kim S, and Choi S, “Deep Learning to Hash with Multiple Representations,” in 2012 IEEE 12th International Conference on Data Mining, 2012, pp. 930–935. [Google Scholar]
- [22].Ge L, Gao J, Li X, and Zhang A, “Multi-source deep learning for information trustworthiness estimation,” in Proceedings of the 19th ACM SIGKDD international conference on Knowledge discovery and data mining, Chicago, Illinois, USA, 2013, pp. 766–774. [Google Scholar]
- [23].Zhu Z, Luo P, Wang X, and Tang X, “Multi-View Perceptron: a Deep Model for Learning Face Identity and View Representations,” in Advances in Neural Information Processing Systems, 2014. [Google Scholar]
- [24].Carneiro G, Nascimento J, and Bradley AP, “Unregistered Multi-view Mammogram Analysis with Pre-trained Deep Learning Models,” in Medical Image Computing and Computer-Assisted Intervention – MICCAI 2015, Cham, 2015, pp. 652–660. [Google Scholar]
- [25].Xu T, Zhang H, Huang X, Zhang S, and Metaxas DN, “Multimodal Deep Learning for Cervical Dysplasia Diagnosis,” in Medical Image Computing and Computer-Assisted Intervention – MICCAI 2016, Cham, 2016, pp. 115–123. [Google Scholar]
- [26].Suk H-I, Lee S-W, and Shen D, “Hierarchical feature representation and multimodal fusion with deep learning for AD/MCI diagnosis,” NeuroImage, vol. 101, pp. 569–582, 2014. [DOI] [PMC free article] [PubMed] [Google Scholar]
- [27].Liang M, Li Z, Chen T, and Zeng J, “Integrative Data Analysis of Multi-Platform Cancer Data with a Multimodal Deep Learning Approach,” IEEE/ACM Transactions on Computational Biology and Bioinformatics, vol. 12, no. 4, pp. 928–937, 2015. [DOI] [PubMed] [Google Scholar]
- [28].Correa NM, Eichele T, Adalı T, Li Y-O, and Calhoun VD, “Multiset canonical correlation analysis for the fusion of concurrent single trial ERP and functional MRI,” NeuroImage, vol. 50, no. 4, pp. 1438–1445, 2010. [DOI] [PMC free article] [PubMed] [Google Scholar]
- [29].Lorenzi M, Simpson IJ, Mendelson AF, Vos SB, Cardoso MJ, Modat M, Schott JM, and Ourselin S, “Multimodal Image Analysis in Alzheimer’s Disease via Statistical Modelling of Non-local Intensity Correlations,” Scientific Reports, vol. 6, pp. 22161, 2016. [DOI] [PMC free article] [PubMed] [Google Scholar]
- [30].Xu X, Shan D, Wang G, and Jiang X, “Multimodal medical image fusion using PCNN optimized by the QPSO algorithm,” Appl. Soft Comput, vol. 46, no. C, pp. 588–595, 2016. [Google Scholar]
- [31].Bhatnagar G, Wu QMJ, and Liu Z, “Directive Contrast Based Multimodal Medical Image Fusion in NSCT Domain,” IEEE Transactions on Multimedia, vol. 15, no. 5, pp. 1014–1024, 2013. [Google Scholar]
- [32].Singh R, and Khare A, “Fusion of multimodal medical images using Daubechies complex wavelet transform – A multiresolution approach,” Information Fusion, vol. 19, no. Supplement C, pp. 49–60, 2014. [Google Scholar]
- [33].Yang Y, “Multimodal Medical Image Fusion through a New DWT Based Technique,” in 2010 4th International Conference on Bioinformatics and Biomedical Engineering, 2010, pp. 1–4. [Google Scholar]
- [34].Zhu X, Suk H-I, Lee S-W, Shen D, and the I. Alzheimer’s Disease Neuroimaging, “Subspace Regularized Sparse Multi-Task Learning for Multi-Class Neurodegenerative Disease Identification,” IEEE transactions on bio-medical engineering, vol. 63, no. 3, pp. 607–618, 2016. [DOI] [PMC free article] [PubMed] [Google Scholar]
- [35].Klein S, van der Heide UA, Lips IM, van Vulpen M, Staring M, and Pluim JPW, “Automatic segmentation of the prostate in 3D MR images by atlas matching using localized mutual information,” Medical Physics, vol. 35, no. 4, pp. 1407–1417, 2008. [DOI] [PubMed] [Google Scholar]
- [36].Cai H, Verma R, Ou Y, Lee S. k., Melhem ER, and Davatzikos C, “Probabilistic Segmentation of Brain Tumors Based on Multi-Modality Magnetic Resonance Images,” in 2007 4th IEEE International Symposium on Biomedical Imaging: From Nano to Macro, 2007, pp. 600–603. [Google Scholar]
- [37].Vallières M, Freeman CR, Skamene SR, and Naqa IE, “A radiomics model from joint FDG-PET and MRI texture features for the prediction of lung metastases in soft-tissue sarcomas of the extremities,” Physics in Medicine & Biology, vol. 60, no. 14, pp. 5471, 2015. [DOI] [PubMed] [Google Scholar]
- [38].Clark K, Vendt B, Smith K, Freymann J, Kirby J, Koppel P, Moore S, Phillips S, Maffitt D, Pringle M, Tarbox L, and Prior F, “The Cancer Imaging Archive (TCIA): Maintaining and Operating a Public Information Repository,” Journal of Digital Imaging, vol. 26, no. 6, pp. 1045–1057, 2013. [DOI] [PMC free article] [PubMed] [Google Scholar]
- [39].Group TEESNW, “Soft tissue and visceral sarcomas: ESMO Clinical Practice Guidelines for diagnosis, treatment and follow-up†,” Annals of Oncology, vol. 25, no. suppl3, pp. iii102–iii112, 2014. [DOI] [PubMed] [Google Scholar]
- [40].Grimer R, Judson I, Peake D, and Seddon B, “Guidelines for the Management of Soft Tissue Sarcomas,” Sarcoma, vol. 2010, pp. 506182, 2010. [DOI] [PMC free article] [PubMed] [Google Scholar]
- [41].Tin Kam H, “The random subspace method for constructing decision forests,” IEEE Transactions on Pattern Analysis and Machine Intelligence, vol. 20, no. 8, pp. 832–844, 1998. [Google Scholar]
- [42].Breiman L, “Random Forests,” Machine Learning, vol. 45, no. 1, pp. 5–32, 2001. [Google Scholar]
- [43].Dice LR, “Measures of the Amount of Ecologic Association Between Species,” Ecology, vol. 26, no. 3, pp. 297–302, 1945. [Google Scholar]
- [44].Schapire RE, “The strength of weak learnability,” Machine Learning, vol. 5, no. 2, pp. 197–227, 1990. [Google Scholar]
- [45].Ronneberger O, Fischer P, and Brox T, “U-Net: Convolutional Networks for Biomedical Image Segmentation,” in Medical Image Computing and Computer-Assisted Intervention – MICCAI 2015, Cham, 2015, pp. 234–241. [Google Scholar]
- [46].Zhang M, Li X, Xu M, and Li Q, “RBC Semantic Segmentation for Sickle Cell Disease Based on Deformable U-Net,” in Medical Image Computing and Computer Assisted Intervention – MICCAI 2018, Cham, 2018, pp. 695–702. [Google Scholar]
- [47].Li G, Liu T, Tarokh A, Nie J, Guo L, Mara A, Holley S, and Wong STC, “3D cell nuclei segmentation based on gradient flow tracking,” BMC Cell Biology, vol. 8, no. 1, pp. 40, 2007. [DOI] [PMC free article] [PubMed] [Google Scholar]
- [48].Sotiras A, Davatzikos C, and Paragios N, “Deformable Medical Image Registration: A Survey,” IEEE Transactions on Medical Imaging, vol. 32, no. 7, pp. 1153–1190, 2013. [DOI] [PMC free article] [PubMed] [Google Scholar]


