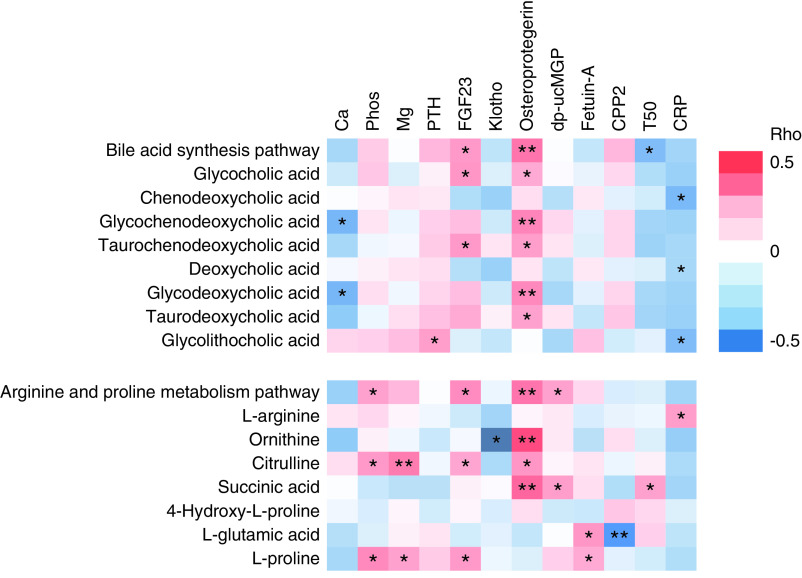
Figure 3.
Correlations of bile-acid synthesis and arginine/proline-metabolism pathways and their key metabolites with serum markers of mineral metabolism (Ca, Phos, Mg, PTH, FGF23, klotho), circulating inhibitors of calcification (osteoprotegerin, dp-ucMGP, fetuin-A, CPP2, T50), and inflammation (CRP). The first principal component scores were used to represent the pathways. Heat map shows Spearman rank correlations. Correlation strength is represented by color bar (red, positive correlation; white, no correlation; blue, negative correlation). *P<0.05; **P<0.005. Ca, calcium; CPP2, secondary calciprotein particle; CRP, C-reactive protein; dp-ucMGP, dephosphorylated and uncarboxylated matrix glutamate protein; FGF-23, fibroblast growth factor-23; klotho, soluble klotho; Mg, magnesium; phos, phosphorous; PTH, intact parathyroid hormone; T50, time of half maximal transformation from primary to secondary calciprotein particle.

