Abstract
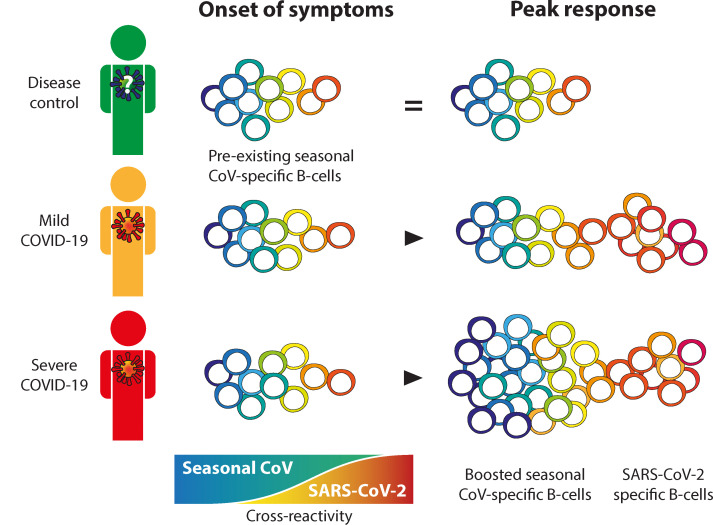
Severe acute respiratory syndrome coronavirus 2 (SARS-CoV-2) is the cause of coronavirus disease 2019 (COVID-19). Little is known about the interplay between preexisting immunity to endemic seasonal coronaviruses and the development of a SARS-CoV-2–specific IgG response. We investigated the kinetics, breadth, magnitude, and level of cross-reactivity of IgG antibodies against SARS-CoV-2 and heterologous seasonal and epidemic coronaviruses at the clonal level in patients with mild or severe COVID-19 as well as in disease control patients. We assessed antibody reactivity to nucleocapsid and spike antigens and correlated this IgG response to SARS-CoV-2 neutralization. Patients with COVID-19 mounted a mostly type-specific SARS-CoV-2 response. Additionally, IgG clones directed against a seasonal coronavirus were boosted in patients with severe COVID-19. These boosted clones showed limited cross-reactivity and did not neutralize SARS-CoV-2. These findings indicate a boost of poorly protective CoV-specific antibodies in patients with COVID-19 that correlated with disease severity, revealing “original antigenic sin.”
Keywords: Immunology, Virology
Keywords: Immunoglobulins, Imprinting
Introduction
The introduction of the zoonotic severe acute respiratory syndrome coronavirus 2 (SARS-CoV-2) has led to a pandemic of coronavirus disease 2019 (COVID-19) (1). The majority of patients with COVID-19 experience mild symptoms including fever, cough, and myalgia, none of which can be considered specific to SARS-CoV-2 infection (2). Some patients with COVID-19 develop acute respiratory distress syndrome (ARDS) that requires treatment in an intensive care unit (ICU) and carries in a high mortality rate (2–4).
Although correlates of protection against severe COVID-19 are not fully defined in humans, SARS-CoV-2–neutralizing antibodies are considered a hallmark of immune protection (5–7). The kinetics of preexisting and newly induced antibodies upon SARS-CoV-2 infection are expected to be important. Preexisting memory B cells that were once primed by antigenically related seasonal common cold coronaviruses (CCCs) may provide fast protection against SARS-CoV-2 infection by a rapid production of cross-reactive antibodies from memory recall, e.g., cross-neutralizing antibodies (5, 8). However, preexisting immunity may also promote pathology (9). A lack of knowledge regarding the specific effector mechanisms associated with protection against SARS-CoV-2 in COVID-19 hampers the development of targeted immune modulators to prevent or overcome severe disease (10). Thus, there is an urgent need for detailed insight into the SARS-CoV-2 immune response in the context of a CCC-experienced immune system.
Immunity to antigenically related pathogens affects the development of a new immune response and is a key factor in the clinical outcome of infection (11). Memory recall of B cells has been related to both positive and negative outcomes of heterologous virus infections. As an example, Fonville and others observed that influenza virus infections not only induce new antibodies targeting the current infection or vaccination strain but also boost antibody titers against a broad range of preceding heterologous influenza virus infections and vaccinations (12, 13). Here, the authors argue that this “backboost” has a positive contribution to vaccine efficacy by helping maintain immunity to a broad range of influenza viruses. Consequently, they argue that the induction of a broad immune response offers the prospect of preemptive vaccine updates (12, 14). By contrast, other studies showed that the B cell clones that were primed to target a specific viral antigen may be boosted and dominate the IgG response to target a new infection where a related antigen is present. The antibodies that are boosted may have reduced affinity and functionality, e.g., poor neutralizing potential, toward the new infection and negatively affect the clinical outcome of infection (15–18). This mechanism, termed “original antigenic sin” (OAS), has been described for immunity to different viruses, including influenza and dengue virus (15–18).
The structural homology between the ectodomain (SECTO) or nucleocapsid (N) protein of the β-CoV SARS-CoV-2 and the SECTO or N of other β-CoV epidemic strains (SARS-CoV and MERS-CoV), α-CCCs (HCoV-229E and HCoV-NL63) and β-CCCs (HCoV-HKU1 and HCoV-OC43) suggests that memory B cells capable of expressing cross-reactive antibodies may preexist in patients with COVID-19 (19, 20). This is exemplified by the highly cross-reactive antibody response to SARS-CoV-2 in individuals who were previously infected with SARS-CoV, probably due to their high sequence homology (88.6% shared amino acids in N and 69.2% in S; refs. 19, 21, 22). The level of sequence homology between SARS-CoV-2 and other β-CoVs is lower (34%–49% for N and 32%–33% for S), and even lower still for α-CoVs (28-29% for N and 28–30% for S; ref. 23). However, in contrast to SARS-CoV, CCCs cause millions of infections worldwide every year (24). Repeated exposure to CCCs may therefore strongly affect the development of a SARS-CoV-2–specific response (25). For example, high serum OC43-SECTO IgG titers are associated with COVID-19 disease severity (23, 24). However, a limitation of the majority of polyclonal serological studies is that IgG cross-reactivity is rarely investigated. Therefore, the functional contribution of CCC-specific IgG clones to immune protection or immunopathogenesis remains largely unknown. Although monoclonal antibodies targeting shared epitopes in the stalk domain of S (S2) of SARS-CoV-2 and HCoV-HKU1 or HCoV-OC43 have been identified (26, 27), little is known about the patterns of CCC IgG cross-reactivity with SARS-CoV-2 and how this affects the immune response to SARS-CoV-2.
In this study, we longitudinally enumerated and categorized type-specific and cross-reactive circulating B cell clones targeting a broad array of N and S antigens from all known human coronaviruses. Subsequently, we determined the functional contribution of these clones to serum SARS-CoV-2 neutralization. In order to correlate these findings to disease severity, we compared patients with severe COVID-19 admitted to the ICU with patients with ambulant, mild COVID-10 and disease controls. The aim was to gain insight into the kinetics, magnitude, breadth, and function of SARS-CoV-2 antibodies in patients with mild or severe COVID-19. Here, we found evidence of a boost of CCC-specific IgG clones in patients with severe COVID-19 that showed limited cross-reactivity with SARS-CoV-2. These boosted clones did not contribute to SARS-CoV-2 neutralization, which endorses OAS.
Results
Clinical characteristics of the study participants.
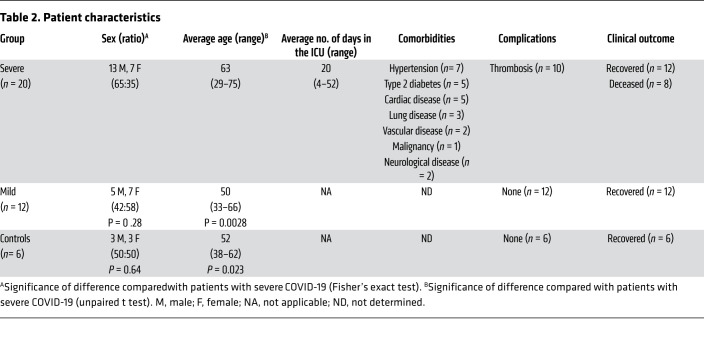
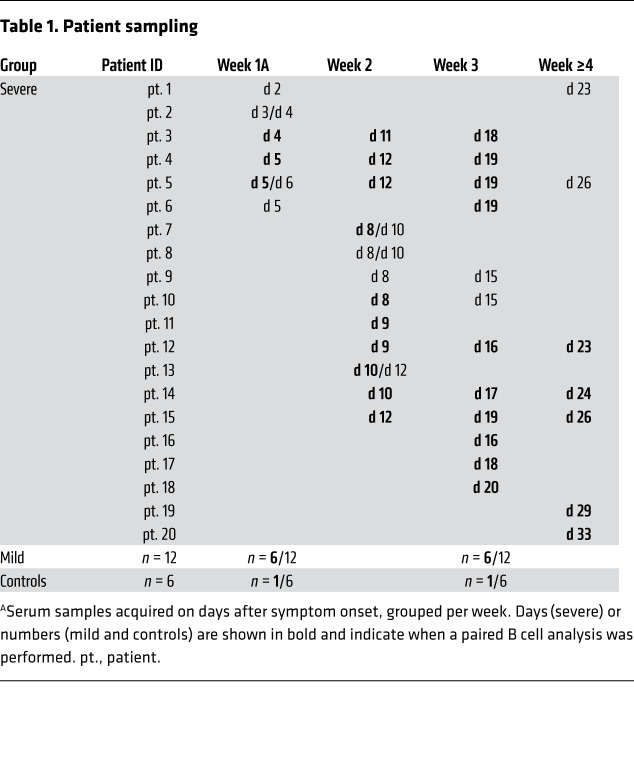
This study included 20 patients with severe COVID-19 who had reverse transcription-PCR–confirmed (RT-PCR–confirmed) SARS-CoV-2 infection and were admitted to the ICU with ARDS. Additionally, 12 RT-PCR–confirmed SARS-CoV-2 patients with COVID-19 who had only mild coronavirus infection–related symptoms and 6 RT-PCR–negative disease controls with similarly mild symptoms were included. None of the patients with mild disease was admitted to the hospital. There was no significant difference with regard to sex (P ≥ 0.28), but the patients with severe COVID-19 were older (average age of 63 years, range 29–75) than those with mild COVID-19 (average age of 50 years, range 33–66, P = 0.0028) or the controls (average age of 52 years, range 38–62, P = 0.023). Six patients with severe COVID-19 (patients 3, 4, 5, 12, 14, and 15; Table 1) were tested by RT-PCR and found to be negative for NL63, OC43, and 229E at 2 time points, ruling out CCC coinfections (data not shown). Six patients with severe COVID-19 were included in the first week after the onset of symptoms, 9 additional patients were included in the second week, 3 additional patients in the third week, and 2 additional patients in the fifth week. Longitudinal samples were available for 15 of 20 patients with severe COVID-19. From all patients with mild COVID-19 and disease controls, samples were collected in the first week (at nasopharyngeal swab sampling for RT-PCR) and the third week after the onset of symp OC43-SECTO IgG titers were already immunodominant at toms. Information on blood collection time points and patient characteristics are provided in Tables 1 and 2, respectively.
Serum IgG titers against a range of coronavirus N and S antigens increase during SARS-CoV-2 infection in patients with severe COVID-19.
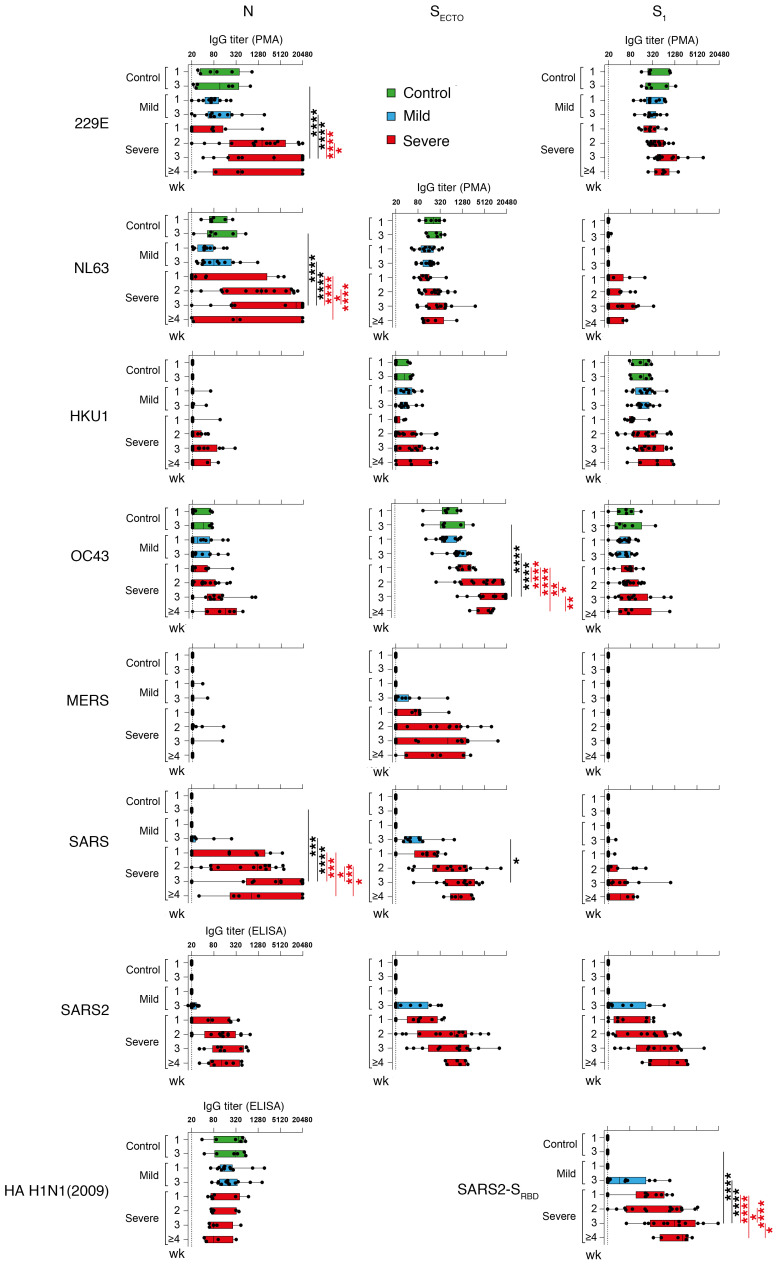
Serum titers against CCCs and epidemic coronavirus antigens, including N, SECTO, the head domain of S (S1) and the receptor-binding domain of S (SRBD), were simultaneously determined by protein microarray (PMA). Serum IgG responses specific for SARS2-N and influenza virus HA H1N1 (2009), included as a respiratory infection control virus, were determined separately by ELISA. Patients with mild or severe COVID-19 mounted a SARS-CoV-2 immune response, as shown by the induction of serum IgG titers against SARS2-N, SARS2-SECTO, SARS2-S1, and SARS2-SRBD (Figure 1). SARS-CoV-2 IgG titers were higher in patients with severe COVID-19 than in those with mild COVID-19, and titers increased over the course of the infection. SARS-CoV-2–negative disease controls remained IgG seronegative for all SARS-CoV-2 antigens (Figure 1) and SARS-CoV-2 virus neutralization (data not shown). Influenza virus HA IgG titers remained stable over time in all patient groups. Patients recruited for this study were probably never exposed to SARS-CoV or MERS-CoV, as seroprevalence in the general population is very low (<0.2%; refs. 28, 29). Nevertheless, we detected an IgG response to all SARS-CoV antigens and MERS-SECTO in all patients with severe COVID-19 and the majority of patients with mild disease. Although the SARS-CoV N (SARS-N) IgG titers appeared higher than the SARS2-N titers, this likely reflects a difference in the sensitivity of PMA versus ELISA. Given the high structural similarities between the respective structural proteins of SARS-CoV and SARS-CoV-2 and between MERS-S2 and SARS2-S2 (19, 24), it is plausible that a cross-reactive response was mounted. Close relatedness between SARS-CoV and SARS-CoV-2 also probably explains the strong correlation between the SARS-N and SARS2-N IgG titers (R = 0.93, P < 0.0001; Supplemental Figure 1A; supplemental material available online with this article; https://doi.org/10.1172/JCI150613DS1).
All patients with mild or severe disease exhibited substantial IgG reactivity to at least 1 of the 229E, NL63, HKU1, or OC43 antigens, suggesting that they were seropositive for all CCCs. Besides the increasing SARS-CoV-2 IgG response, serum IgG reactivity to various CCC antigens increased in patients with mild or severe COVID-19. This increment was only significant in patients with severe COVID-19 for the 229E-N, NL63-N, and OC43-SECTO antigens. OC43-SECTO IgG titers were already dominant at the time of study inclusion for all patient groups. In patients with severe COVID-19, these titers increased significantly more over time compared with patients with mild disease in week 3 after the onset of symptoms (Figure 1).
Frequencies of circulating B cells targeting N and S of SARS-CoV-2 and CCC increase following SARS-CoV-2 infection.
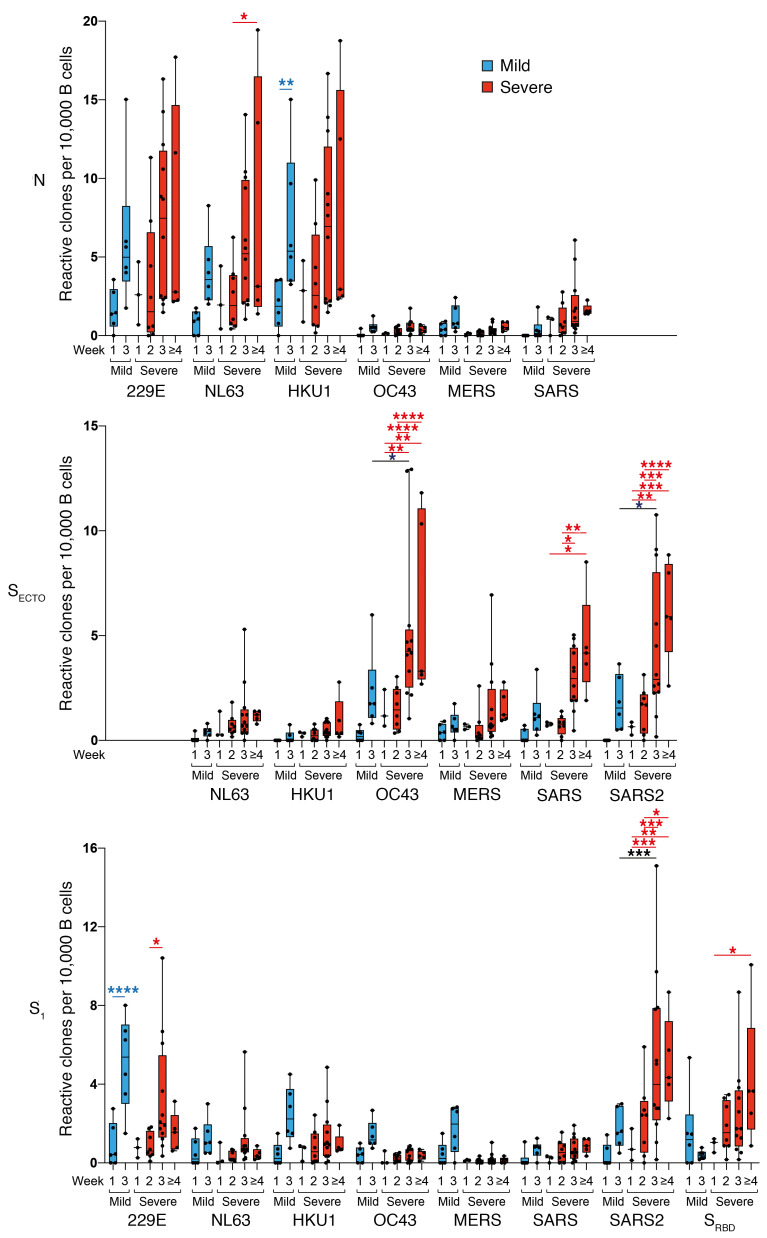
To analyze the kinetics of the coronavirus-specific B cell response, we longitudinally enumerated circulating B cell clones specific for coronavirus antigens using B cell profiling (Figure 2). To that aim, we isolated CD19+ B cells from PBMC samples that were collected at the same time points as the serum samples in the previous section, from 1 control patient as well as from 6 patients with mild COVID-19 and 17 patients with severe COVID-19 (Table 1). CD19+ B cells were stimulated in an antigen- and B cell receptor–independent manner in oligoclonal cultures at a limiting dilution. This culture system ensured an unbiased clonal analysis of the coronavirus-specific response. We individually screened the supernatants for IgG reactivity to all available coronavirus antigens using PMA. The frequency of reactive wells was 15% ± 14% for N and 22% ± 15% for S (average ± SD). The number of reactive B cell supernatants was normalized to the number of screened B cells per patient in order to compare frequencies between different samples.
Overall, the frequency of in vitro–stimulated peripheral blood–derived B cells reflected total serum IgG reactivity, with a few exceptions. The differences in B cell counts and serum IgG titers potentially reflected in vitro and in vivo differences in B cell activation or regulation. As we observed with serum IgG reactivity, patients with COVID-19 showed a strong expansion of SARS-CoV-2–reactive B cells, which was most prominent in those with severe disease. Moreover, the number of B cell clones reactive to various CCCs and epidemic coronavirus antigens expanded upon SARS-CoV-2 infection. This increase in CCC-specific B cells was most striking for 229E-N, NL63-N, HKU1-N, OC43-SECTO, and 229E-S1 antigens. The frequency of HKU1-N–reactive B cells was higher than expected, as shown by the low serum reactivity. The OC43-SECTO B cell response was immunodominant in patients with severe COVID-19 and increased significantly in the following weeks. This response was significantly higher in the patients with severe COVID-19 than in those with mild COVID-19 in the third week following the onset of symptoms. Contrastingly, the frequency of 229E-S1–reactive B cells was immunodominant in patients with mild COVID-19 and increased significantly over time (Figure 2). However, as with HKU1-N–specific B cells, we did not observe these differences in serum IgG titers (Figure 1).
B cells reactive to heterologous coronaviruses are differentially boosted in patients with mild or severe COVID-19.
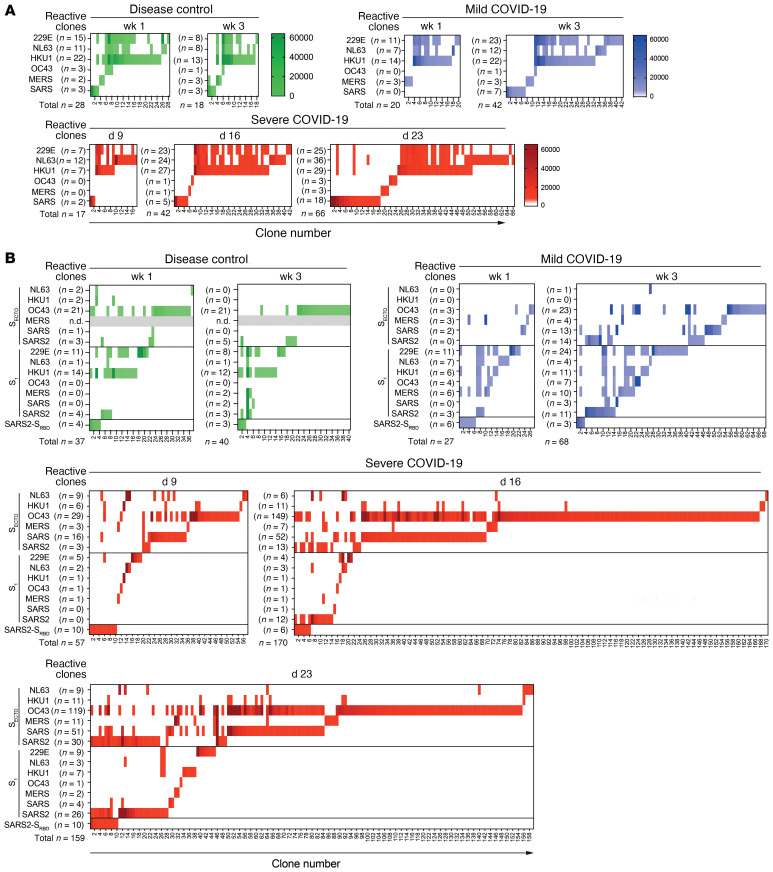
The outgrowth of B cells that target heterologous coronavirus strains is potentially driven by cross-reactivity with SARS-CoV-2. Therefore, we analyzed the multiplex PMA profiles of in vitro–stimulated B cell cultures to determine the level of cross-reactivity of monoclonal IgG. A longitudinal profile of coronavirus antigen–reactive cultures that represents the observed kinetics in the pooled analysis (Figure 2) is shown for each patient group (Figure 3).
The N-reactive IgG clones from the 3 representative donors are shown at different time points. In the case of the control patient, the number of detected N-reactive clones decreased, but for COVID-19 patients, the number of N-specific B cell clones increased in patients with mild disease (n = 20 in week 1 and n = 42 in week 3) and in those with severe disease (n = 17 at day 9, n = 42 on day 16 and n = 66 on day 23). For all patients, a substantial number of clones cross-reacted between 229E-N, NL63-N, and HKU1-N antigens. In contrast, the IgG clones reacting to OC43-N, MERS-N, and SARS-N showed minor to no binding to CCC N antigens on PMA (Figure 3A). Analysis of selected SARS-N binding clones on SARS-N and SARS2-N ELISA revealed significant cross-reactivity between both antigens (R = 0.49, P = 0.0034; Supplemental Figure 1B), which confirmed that the serum IgG response to SARS-N was due to cross-reactivity with SARS2-N.
The control patient showed stable S-reactivity over time. We detected some SARS-CoV-2–reactive B cells, and most cross-reacted with CCCs. These likely represent preexisting CCC-specific clones or naive B cells. In contrast, both COVID-19 patients showed an expanding, mostly type-specific SARS-CoV-2 S response with increasing numbers of SARS2-SECTO– and SARS2-S1–reactive B cell clones. In the case of the patient with mild COVID-19, we detected no SARS2-SECTO–specific IgG clones in the first week. In week 3, we found that 8 of 14 (57%) SARS2-SECTO–specific clones also reacted with SARS2-S1. In the case of the patient with severe COVID-19, 0 of 3 SARS2-SECTO–specific IgG clones reacted with SARS2-S1 on day 9; 10 of 13 (77%) on day 16; and 22 of 30 (73%) on day 23 (Figure 3B). The relative increase in the number of SARS2-SECTO– and SARS2-S1–reactive clones indicated that over time, S1-reactive clones were positively selected in vivo in both patients with mild COVID-19 and in those with severe disease. This domain is the target of most potent neutralizing antibodies (5). Therefore, this finding indicates the maturation of a SARS-CoV-2–specific IgG response.
Clonal S-specific IgG cross-reactivity patterns were similar between the control patient and in week 1 in the patients with mild COVID-19. However, the patterns were strikingly different between the 2 representative COVID-19 patients. A broadly cross-reactive S1 response was present in the patient with mild COVID-19 in the first week of symptoms (8 of 22 [36%] of S1-specific clones cross-reacted), and 229E-S1 was immunodominant (11 of 27 [41%] of total S-specific clones). Three weeks after symptom onset, more CoV-specific clones were detected, the S-IgG cross-reactivity was reduced (11 of 40 [28%] of S1-specific clones cross-reacted with heterologous strains), and 229E-S1 remained immunodominant (24 of 68 [35%] of total S-specific clones). The patient with severe COVID-19 had a stronger type-specific SARS-CoV-2 response. This patient with severe disease had less cross-reactivity between S1 antigens compared with the patient with mild COVID-19 (1 of 19 [5%] of S1 clones cross-reacted on day 9; 4 of 21 [19%] on day 16; and 5 of 45 [11%] on day 23). OC43-SECTO clones dominated the coronavirus-specific IgG response on day 9 (29 of 57 [51%] of total S-specific clones), and these clones were prominently boosted on day 16 (149 of 170 [88%]) and day 23 (119 of 159 [75%]). Although many OC43-SECTO clones cross-reacted with SARS-CoV SECTO (SARS-SECTO) (101 of 297 [34%] on all 3 days combined), a limited number of clones showed binding to SARS-CoV-2 antigens on PMA (18 of 297 [6%]; Figure 3B).
N-specific IgGs have similar cross-reactive patterns in patients with mild or severe COVID-19, whereas S-specific IgGs show differential cross-reactivity patterns in both patient groups.
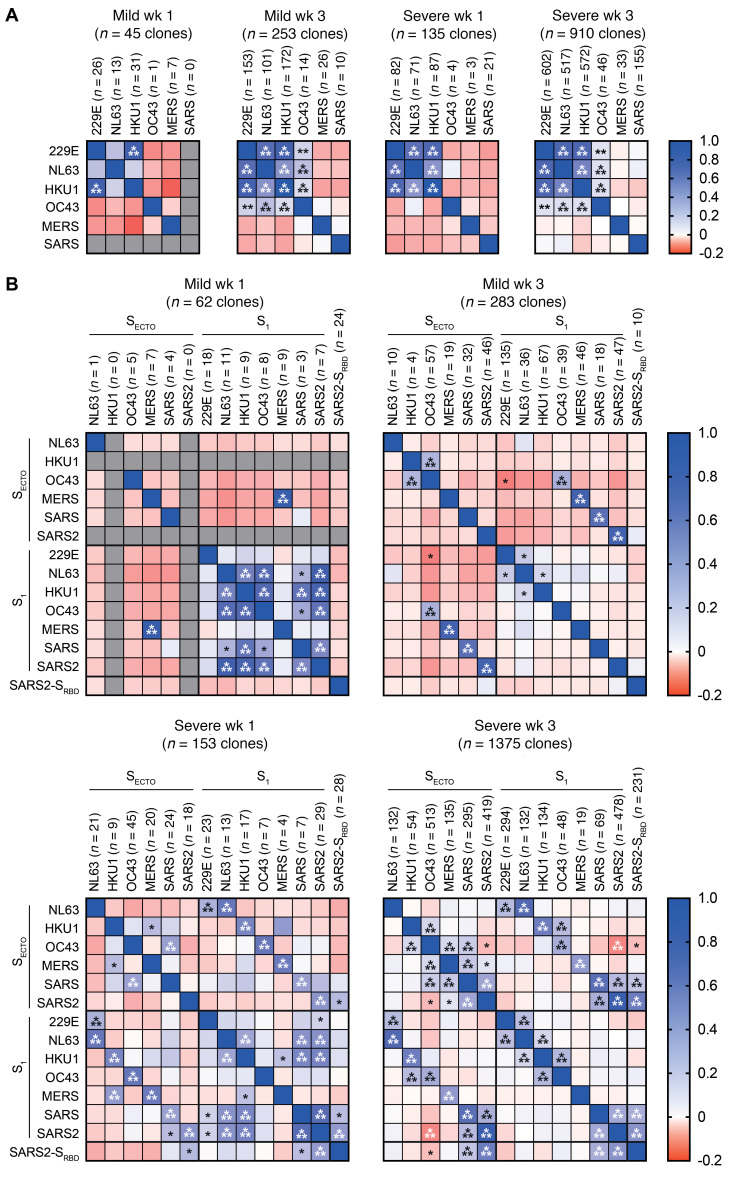
In order to confirm our previous findings and identify additional differences in the IgG cross-reactivity patterns between patients with mild COVID-19 and those with severe disease, we analyzed all coronavirus-specific IgG clones that were detected at available overlapping time points. Specifically, we compared patients in week 1 (n = 6 mild and n = 3 severe COVID-19) and week 3 (n = 6 mild and n = 11 severe COVID-19) after the onset of clinical symptoms. We performed Pearson’s regression analysis to quantify the cross-reactivity between antigens.
For N, this analysis validated that the 229E-N, NL63-N, and HKU1-N IgG clones cross-reacted in patients with mild or severe COVID-19 during the first week of SARS-CoV-2 infection. Three weeks after the onset of symptoms, the cross-reactivity patterns we observed in week 1 became more robust in both COVID-19 patient groups. Additionally, we observed weak yet highly significant correlations between OC43-N and the other CCC strains. However, we detected no significant IgG cross-reactivity between the CCC and epidemic coronavirus strains, indicating that different epitopes were involved (Figure 4A).
The combined analysis of all S-IgG clones showed complex cross-reactivity patterns including CCC and epidemic strains. In patients with mild disease sampled in the first week after the onset of symptoms, we confirmed the significant cross-reactivity between S1 of the CCC and epidemic strains (Figure 3 and Figure 4B). Contrastingly, the patients with severe disease sampled in the first week displayed a weak but broadly S–cross-reactive response, including SECTO and S1 antigens. Moreover, matched S1 and SECTO antigens of each coronavirus strain were significantly correlated, indicating substantial reactivity to an S1 epitope (Figure 4B). Three weeks after the onset of symptoms, cross-reactivity patterns in patients of both COVID-19 groups differed from the ones observed in week 1. For patients with mild disease, we confirmed that the cross-reactivity of the S1 response was greatly reduced. Conversely, strain-matched S1 and SECTO reactivity increased. In contrast, patients with severe disease had a similar but more pronounced cross-reactive pattern in the third week compared with that seen in the first week after the onset of symptoms. Reactivity with shared epitopes in all SARS-CoV-2 antigens increased. However, cross-reactivity between CCC and epidemic coronaviruses on S1 antigens disappeared almost completely. Strikingly, patients with severe disease displayed a significant negative correlation between the immunodominant OC43-SECTO IgG response and all SARS-CoV-2 antigens (Figure 4B). This confirms that OC43-SECTO reactive clones were overall unlikely to show detectable cross-reactivity with SARS-CoV-2 on PMA in patients with severe COVID-19.
The majority of boosted OC43-SECTO–reactive clones did not react with OC43-S1. To determine whether they were reactive to S2, we analyzed OC43-S2 reactivity of randomly selected OC43-SECTO–reactive clones by ELISA. Out data confirmed that all selected OC43-SECTO clones bound to OC43-S2 (Supplemental Figure 2).
IgG cross-reactivity between OC43-SECTO and SARS-CoV-2 S antigens remains limited over time in severe COVID-19.
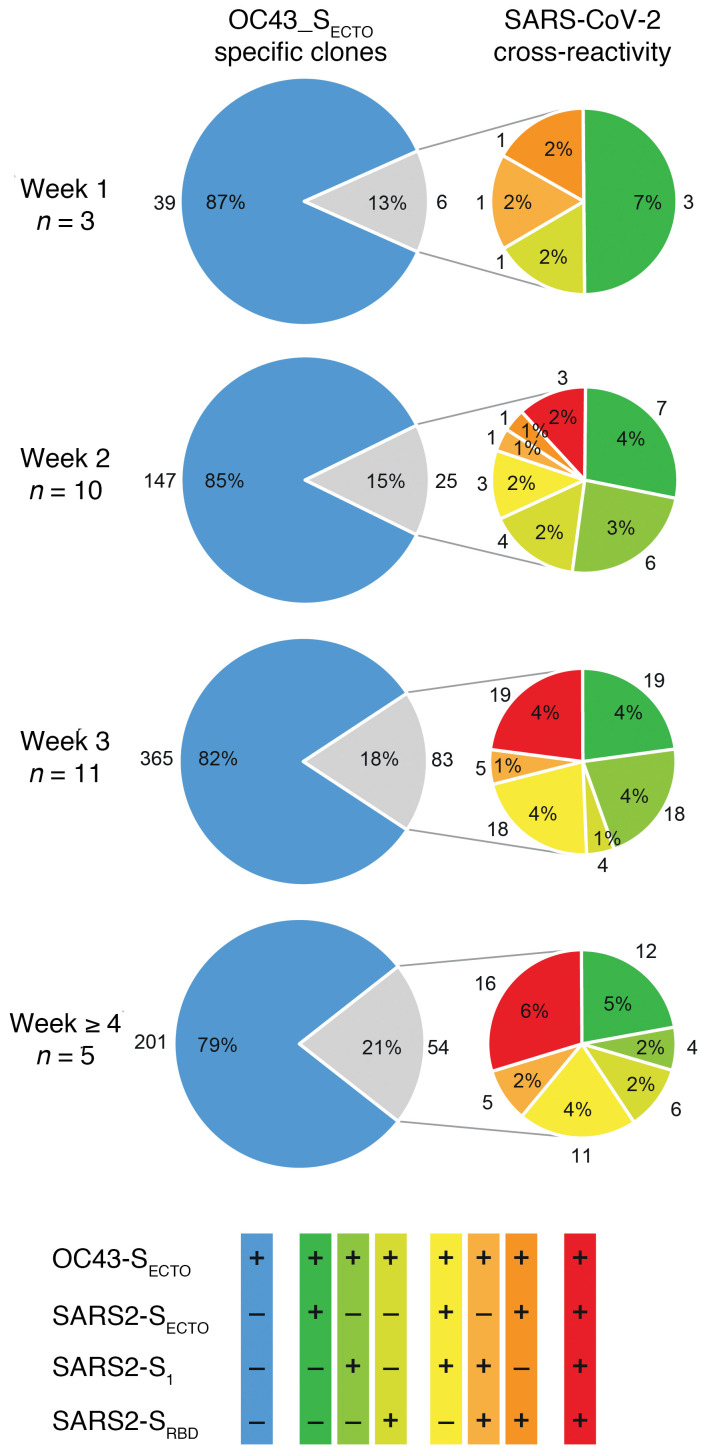
An in-depth analysis of the boosted immunodominant OC43-SECTO response in all patients with severe COVID-19 for whom PBMCs were available (n = 17; Table 1) confirmed that the majority of OC43-SECTO clones (752 of 920 [82%]) did not cross-react with SARS-CoV-2. However, the relative number of OC43-SECTO clones that cross-reacted with SARS-CoV-2 S antigens moderately increased over time (from 13% to 21%, grouped per week after the onset of symptoms). Strikingly, this minority of OC43-SECTO–reactive clones that cross-reacted with SARS-CoV-2 increasingly recognized epitopes in SARS2-S1 and SARS2-SRBD (Figure 5). This suggests that there was incremental recognition of epitopes with high neutralization potential in a minority of the OC43-SECTO clones (5, 21).
No evidence for functional contribution of seasonal coronavirus-specific antibodies against SARS-CoV-2 neutralization.
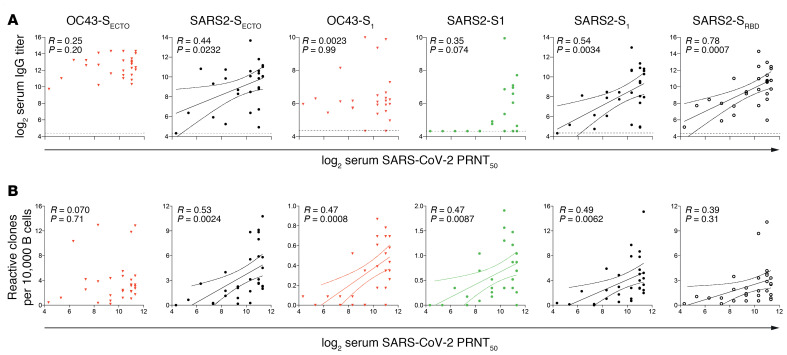
To determine which coronavirus-reactive IgGs functionally contribute to SARS-CoV-2 neutralization, we correlated serum S–reactive IgG titers with the 50% plaque reduction neutralization test (PRNT50) serum titers for SARS-CoV-2. We found that serum SARS2-SECTO–, SARS2-S1–, and SARS2-SRBD–specific IgG titers selectively correlated with serum SARS-CoV-2 PRNT50 titers. All other S-specific IgG titers did not correlate with neutralization (Figure 6A).
To determine which circulating coronavirus S-specific B cells contribute to SARS-CoV-2 neutralization, we correlated the normalized S-reactive B cell counts with paired serum SARS-CoV-2 PRNT50 titers. Similar to serum IgG titers, SARS2-SECTO– SARS2-S1–, and SARS2-SRBD–specific B cells correlated with serum PRNT50 titers. Additionally, the frequency of OC43-S1– and SARS-S1–specific B cells showed a positive correlation with PRNT50 titers. Notably, the frequency of OC43-S1–reactive B cells was low (<0.01% of screened B cells) and therefore probably had a limited contribution to the total SARS-CoV-2 virus neutralization response (Figure 6B).
Discussion
Multiplex IgG analysis of paired serum and culture supernatants of in vitro–stimulated B cells from patients with mild or severe COVID-19 and disease controls allowed us to (a) show the kinetics and magnitude of the SARS-CoV-2 IgG response in the context of the CCC-specific immunological background; (b) perform an in-depth analysis of a large number of IgG B cell clones (in total, 2420 N-specific and 3261 S-specific B cell clones) that are representative of the complete coronavirus immunological breadth; (c) distinguish de novo induced strain-specific SARS-CoV-2-specific IgG clones from preexisting CCC strain–specific IgG clones and CCC/SARS-CoV-2 cross-reactive IgG clones; and (d) correlate our findings with disease severity.
We show that all patients with COVID-19 had an evolving, mostly type-specific SARS-CoV-2–specific IgG response. Cross-reactivity patterns differed between patients with severe COVID-19 and those with mild disease. The magnitude of the SARS-CoV-2 response in patients with severe disease was greater than that in patients with mild disease. Notably, patients with severe disease also displayed a strong increase in CCC-specific IgG and B cell clones. Strikingly, this phenomenon did not correlate with detectable cross-reactivity with SARS-CoV-2. Serum SARS-CoV-2 S–specific IgG and the frequency of the respective circulating B cell clones correlated with SARS-CoV-2 neutralization titers. However, except for a minor fraction of OC43-S1–specific B cells, the boosted CCC-specific IgG response did not correlate with neutralization titers. These findings indicate that the boost of CCC-specific IgG in patients with severe COVID-19 did not contribute to SARS-CoV-2 neutralization. Notably, we did not observe a limited or delayed elicitation of a SARS-CoV-2 response in the patients with severe COVID-19, which may be a feature of OAS. However, the strong association with severe disease suggests a negative effect on clinical outcome of infection, which corroborates OAS (14–18, 30).
For N, serum IgG antibody titers against the α-CoV 229E and NL63 antigens were dominant in all patients upon inclusion in the study, yet they were selectively boosted in patients with severe COVID-19. The outgrowth of CCC N-specific B cells was most striking for 229E, NL63, and the β-CoV HKU1 in patients with mild or severe COVID-19. We observed very limited cross-reactivity between CCC and epidemic coronavirus strains for this antigen. We could not confirm this for all SARS2-N–reactive clones, given the lack of the antigen on PMA. However, we found a strong correlation between SARS-N– and SARS2-N–specific serum IgG titers (Supplemental Figure 1A) and SARS2-N reactivity of SARS-N–specific B cell clones (Supplemental Figure 1B). These data, together with the high level of structural and sequence homology between both antigens (88.6%; refs. 23, 24), suggest that the SARS-N antigen can be used as a proxy for SARS2-N in our analysis.
For S, serum levels of IgG antibody against the β-CoV OC43 dominated in all patients upon their inclusion in the study and were selectively boosted in patients with severe COVID-19, as was observed with the dominant α-CoV N-specific serum IgG responses. This suggests that preexisting immunodominant serum IgG responses to heterologous strains are preferentially boosted by SARS-CoV-2, even though other strains have a greater shared amino acid identity (23). This is a key feature of OAS (12, 13, 18).
In the first week after the onset of symptoms, we observed substantial cross-reactivity between S1 of SARS-CoV-2 and α- and β-CoVs. These correlations were strongest in patients with mild COVID-19. An early S1 cross-reactive response potentially set the stage for the rapid development of an antibody response that protected against severe disease. However, the breadth of S1 cross-reactivity declined over time.
The outgrowth of CCC S-reactive B cell clones was most striking for OC43-SECTO in patients with severe COVID-19. Of the OC43-SECTO–reactive clones, only a minor fraction reacted with a shared epitope in OC43-S1 (66 of 920 [7%]), and the majority recognized OC43-S2, which corresponds to findings in previous studies (24, 26, 31). The fraction of the dominant OC43-SECTO–specific clones that showed detectable cross-reactivity with SARS-CoV-2 antigens on PMA was limited. Of these cross-reactive clones, we found that reactivity was increasingly directed toward SARS2-S1 and SARS2-SRBD. Of interest, IgGs targeting S1 and SRBD confer the strongest neutralization potential (5, 20). Indeed, the minority of cross-reactive OC43-S1 clones contributed to SARS-CoV-2 neutralization, but the dominant OC43-S2 IgG response did not correlate with SARS-CoV-2 neutralization. The lack of detectable cross-reactivity between CCC S-specific IgG and SARS2-SECTO is congruent with their lack of SARS-CoV-2 neutralization potential. Although it is possible that CCC-specific IgGs restrict viral replication via Fc-mediated mechanisms, they may also play no role, or even have a detrimental effect by delaying the development of a type-specific response or by enhancing immune pathology (11, 32).
It is likely that the avidity of boosted IgG was below the detection limit of a PMA, yet was sufficient to drive expansion of the respective CCC-specific B cells in vivo. As the clonal selection of B cells is driven by the affinity of the B cell antigen receptor, one would expect that clones with detectable high-affinity cross-reactivity would overgrow low-affinity clones. Indeed, the fraction of OC43-SECTO–specific clones that cross-react with SARS-CoV-2 antigens marginally increases over time (13% in week 1 to 21% after 4 weeks). Nevertheless, this process was too slow to substantially contribute to the SARS-CoV-2–neutralizing response. Alternatively, boosted OC43-S2 clones targeted cryptic epitopes that were not exposed in the stabilized trimeric conformation of SARS2-SECTO on PMA. It is possible that the respective SARS2-S2 epitope was only available after conformational changes that occurred after angiotensin-converting enzyme 2 (ACE-2 binding or in linear epitopes that were only available in degraded or denatured proteins in vivo. The stable influenza-specific IgG responses over time in all patient groups suggests that this SARS-CoV-2–induced backboost was coronavirus specific. This argues against a general inflammatory state to drive IgG production in a fully antigen-independent manner. The mechanism underlying the outgrowth of CCC-specific B cells remains to be determined.
A limitation of our study is that clonality was not confirmed. However, on average, less than 22% of oligoclonal cultures showed reactivity to at least 1 antigen, which suggests that the majority of cultures contained only a single reactive clone. Furthermore, to correct for potential dual reactive cultures, we performed Pearson’s regression analysis to ensure that only robust and significant cross-reactivity patterns were identified that were not influenced by rare artifactual cross-reactive events. A second limitation is that, because the amount of culture supernatant was limited, we were not able to confirm the neutralization potential of individual S-specific IgG clones.
In conclusion, we found robust OAS in patients with severe COVID-19. Boosted CCC-specific IgGs did not substantially contribute to SARS-CoV-2 neutralization, which is considered key in immune protection. Moreover, recent studies showed that the rise in CCC-specific IgG titers does not contribute to CCC neutralization and is not associated with protection (33, 34). These findings mitigate any positive effect of CCC antibody backboost in maintaining broad immunity to preceding infections, as was described for influenza virus (12). We believe that the detailed insights into the kinetics and cross-reactivity patterns of N- and S-reactive IgGs presented in this study will aid in the interpretation of serological studies and further expand our understanding of how the CCC-experienced humoral immune system responds to SARS-CoV-2. Our study underscores the notion that the immunological background of individuals needs to be considered an important factor in assessing the quality and quantity of a newly initiated antibody response to SARS-CoV-2, either by infection or vaccination.
Methods
Study design, patient characteristics, and clinical specimens.
Twelve RT-PCR–confirmed SARS-CoV-2–infected health care workers at the EMC with mild COVID-19 symptoms, including fever, cough, or myalgia, and 6 RT-PCR–negative control patients with mild disease with similar clinical symptoms were included in the COVID-19 EMC health care worker study (MEC-2020-0264). Twenty RT-PCR–confirmed patients with severe COVID-19 (35) who were admitted to the EMC ICU with ARDS were included in the CIUM biorepository study (MEC-2017-417). Serum and PBMCs were collected from patients with mild disease (health care workers) in the first and third weeks after the onset of clinical symptoms. Serum and PBMCs were collected from the patients with severe COVID-19 on a weekly basis, with the initial sample collected within 2 days of admittance to the ICU, until ICU discharge or the patient’s death in the ICU. Additional serum samples from patients with severe disease were included in the study when available (Table 1). All samples were analyzed according to the SARS-CoV-2 protocol (MEC-2020-0222). Peripheral blood was collected in EDTA tubes for PBMCs and SST-II tubes for serum (both from BD Biosciences). PBMCs were isolated using Lymphoprep (GE Healthcare) density-gradient centrifugation and cryopreserved at –196°C (36). Serum was isolated according to the manufacturer’s instructions, and aliquots were stored at –80˚C.
B cell profiling.
Short-term B cells were cultured essentially as described elsewhere (37). In brief, B cells were isolated from cryopreserved PBMCs using the EasySep Human CD19 Positive Selection Kit (STEMCELL Technologies) according to the manufacturer’s instructions. Oligoclonal cultures of 100–300 CD19+ B cells per well were seeded in 96-well, U-bottomed plates in B cell medium consisting of AIM-V AlbuMAX medium supplemented with 10% FBS, penicillin-streptomycin (all from Invitrogen, Thermo Fisher Scientific), and β-mercaptoethanol (MilliporeSigma). Oligoclonal B cell cultures were stimulated in an antigen- and B cell receptor–independent manner. Each culture was stimulated for 48 hours with 50 U/mL IL-2 (Novartis), 10 ng/mL IL-10 (Peprotech), 25 ng/mL IL-21 (Peprotech), 1 μg/mL resiquimod (InvivoGen), and 1000 L-CD40L cells (provided by J. Banchereau, The Jackson Laboratory for Genomic Medicine, Farmington, Connecticut, USA) that were growth-arrested by 40 Gy γ-irradiation. CD40L expression and the absence of mycoplasma were confirmed for L-CD40L cells. B cells were subsequently cultured for 12 days in B cell medium supplemented with 25 ng/mL IL-21. Culture supernatants were harvested, and the reactivity of secreted IgGs was determined using PMA.
PMA.
Serum IgG reactivity as well as the reactivity of secreted IgGs in oligoclonal culture supernatants to an array of coronavirus N and S proteins were analyzed by PMA as described elsewhere (38). All SECTO antigens were provided by Berend Jan Bosch (Utrecht University, Utrecht, Netherlands) (39–43). All S1 antigens were produced in-house (23). N antigens were derived from commercial sources. Details on the antigens used are provided in Supplemental Table 1. Using a standard panel of control sera, the minimal amount of antigen required to reach a plateau in the serum titration assays was determined for each antigen. These standard sera were also used to validate the consistency of results by including them on each ELISA plate and testing each PMA batch that was used. MERS-SECTO reactivity was not determined in the control patient by PMA, because this antigen batch did not pass quality control. Instead, MERS-SECTO IgG cross-reactivity in the control patients was determined by ELISA (Supplemental Figure 3).
PMA slides were scanned using a PowerScanner (Tecan). The background was determined for each spot, and the MFI signal (range, 0–65,535) of 2 spots was calculated for each serum or culture supernatant. For B cell culture supernatants, a cutoff was set at the average plus 3 times the SD of 20 nonreactive cultures with a minimum MFI of 1000. Serum IgG titers were calculated using 4-parameter logistic regression with the titer as the inflection point (25).
SARS-N, SARS2-N and influenza virus HA H1N1 (2009) ELISA.
Serum IgG titers or culture supernatant IgG reactivities to SARS-N, SARS2-N, OC43-SECTO, OC43-S2, MERS-SECTO, SARS2-SECTO, and influenza virus HA of H1N1 2009 were separately determined by ELISA as described previously (37). The antigens are specified in Supplemental Table 1. In brief, high-binding Corning Costar 96-Well EIA/RIA Plates were coated overnight at 4°C with a titrated concentration of antigen that was required to reach a plateau in the titration of standard sera. Plates were blocked with 1% BSA and 0.05% Tween-20 PBS blocking buffer (BB) for 1 hour at 37°C. A dilution series of serum or a fixed dilution of B cell supernatant was prepared in BB and incubated on the plates for 1 hour at 37°C. ELISA plates were washed with 0.05% Tween-20 PBS and incubated with goat anti–human IgG polyclonal antibody conjugated with HRP (MilliporeSigma, A8667) in BB. The plates were washed with 0.05% Tween-20 PBS and incubated with 3,3′,5,5′-tetramethylbenzidine (Invitrogen, Thermo Fisher Scientific). The peroxidase reaction was stopped by the addition of 0.5N sulfuric acid, and the OD at 450 nm wavelength OD450 signal was analyzed on a Tecan Infinite F200 reader.
SARS-CoV-2 biosafety level 3 PRNT50.
SARS-CoV-2 neutralization titers were determined at biosafety level 3 facilities by PRNT50 as previously described (23).
Statistics.
Serum IgG and PRNT50 titers and MFI values of PMA were log2-transformed for analysis. Two-way ANOVA with Tukey’s multiple-comparison test was used to assess the differences in longitudinal serum IgG responses and B cell clone counts within each patient group and at similar time points between patient groups. The cross-reactivity of clones was assessed using Pearson’s regression analysis. Simple linear regression was used to correlate serum IgG, PRNT50, and B cell clone counts. P values of less than 0.05 were considered statistically significant. All analyses were performed using Graphpad Prism 9 (GraphPad Software).
Study approval.
Personal or written consent was obtained from all study participants or from a legal representative, partner, or family member of the participant, respectively. All studies were approved by the EMC medical ethics committee and performed in compliance with Declaration of Helsinki principles.
Author contributions
GPVN, MAB, BMW, and MPGK conceived the study. MAB, BMW, EDB, and GPVN designed the study methodology. MAB, BMW, FDC, NMAO, and GPVN performed experiments. GPVN performed graphical visualization of the data. BLH and MPGK acquired funding. MPR, TL, HE, JPCVDA, DAMPJG, ECMVG, RDDV, and CHGVK acquired the clinical samples. GPVN and MAB wrote the original draft of the manuscript. BMW, RDDV, TL, RAMF, BHGR, and MPGK, wrote, reviewed, and edited the manuscript. The order of the co–first authors, MAB and BMW, was determined alphabetically by surname.
Supplementary Material
Figure 1. Patients with severe COVID-19 generate a strong serum SARS-CoV-2 IgG response and have an increasingly stronger IgG response to other coronaviruses.
Longitudinal serum IgG titers (x axis) for 6 disease control donors (green boxes), 12 patients with mild COVID-19 (blue boxes), and 20 patients with severe COVID-19 (red boxes), grouped by week number after the onset of symptoms (y axis), against a panel of coronavirus nucleocapsid proteins (N, left column), the ecto (SECTO, middle column) and head domains (S1, right column) of S protein, and the SARS-CoV-2 SRBD and HA of the H1N1 (2009) influenza virus (listed along the y axis). A SARS-CoV-2–specific response was mounted in all patients with COVID-19, together with a boost of seasonal human 229E, NL63, HKU1, OC43, and epidemic MERS, SARS, and SARS2 coronavirus antigens. Dotted line shows the assay background. Boxes represent the median, upper, and lower quartiles, and whiskers show the range. P values calculated using a 2-way ANOVA with Tukey’s multiple-comparison test (*P < 0.05, **P < 0.01, ***P < 0.001, and ****P < 0.0001) are shown in black (significant intergroup differences) and red (significant intragroup differences).
Figure 2. Patients with severe COVID-19 exhibit a prominent expansion of SARS-CoV-2 and OC43-SECTO–specific IgG B cells.
Normalized enumeration of in vitro–stimulated peripheral blood–derived IgG B cells from patients with mild COVID-19 (blue boxes) and patients with severe COVID-19 (red boxes) with reactivity to N, SECTO, and S1 coronavirus antigens and SARS-CoV-2 SRBD. Relative OC43-SECTO–, SARS-SECTO SARS2-SECTO/S1–, and SRBD-specific IgG B cell clones showed a highly significant outgrowth in the first 4 weeks after SARS-CoV-2 infection in patients with severe COVID-19. In patients with mild COVID-19, a highly significant increase was only seen for 229E-S1–specific IgG clones 3 weeks after the onset of symptoms. Boxes represent the median, upper, and lower quartiles, and whiskers show the range. P values calculated using a 2-way ANOVA with Tukey’s multiple-comparison test (*P < 0.05, **P < 0.01, ***P < 0.001, and ****P < 0.0001) are shown in black (intergroup significant differences), blue (significant mild COVID-19 intragroup differences), and red (severe COVID-19 intragroup significant differences).
Figure 3. In vitro–stimulated B cells from a representative disease control, a patient with mild COVID-19, and a patient with severe COVID-19 show different patterns of clonal IgG cross-reactivity to human coronavirus strains.
B cells were isolated from peripheral blood samples and stimulated in vitro in oligoclonal cultures at limiting dilution to analyze IgG reactivity at the clonal level. The representative patients were analyzed on the indicated day or week after the onset of symptoms. (A) Heatmaps show the MFI of clonal IgG reactivity to N of different human coronaviruses. The number of single- and cross-reactive N-specific B cell clones (x axis) remained stable in the disease control (green) but increased over time after SARS-CoV-2 infection in the patients with mild (blue) or severe (red) COVID-19. (B) Heatmaps show the MFI of clonal IgG reactivity to SECTO, S1, and SRBD antigens from the same representative patients. The disease control showed stable reactivity. By contrast, the patient with severe COVID-19 showed the strongest response to OC43-SECTO, and this response poorly cross-reacted with SARS-CoV-2 antigens.
Figure 4. Combined analysis of reactive IgG clones from patients with mild or severe COVID-19 shows major differences in cross-reactivity patterns.
Pearson’s correlation analysis of (A) N- and (B) S-reactive IgG clones identified in patients with mild COVID-19 (n = 6) in week 1 and week 3 after the onset of symptoms, and in patients with severe COVID-19 in week 1 (n = 3) and week 3 (n = 11) after the onset of symptoms. Heatmaps show the R value of Pearson’s regression (red to blue shades, range –0.2–1) and the significant P value (*P < 0.05, **P < 0.01, and ***P < 0.001) of these correlations.
Figure 5. OC43-SECTO–reactive clones show limited yet antigenically evolving cross-reactivity with SARS-CoV-2.
All OC43-SECTO–reactive clones (n = 920) from 17 patients with severe COVID-19 were stratified by week number after the onset of clinical symptoms. The proportion of single OC43-SECTO (blue) and SARS-CoV-2 cross-reactive clones (gray) is shown (left pie). The cross-reactivity with 1 (green colors), 2 (yellow and orange colors), and 3 SARS-CoV-2 antigens (red) is depicted (right pie). The number of patients analyzed per week is indicated on the left. The frequency and number of contributing clones for each cluster are shown inside and adjacent to each part, respectively.
Figure 6. IgG titers and normalized counts of B cells reactive to SARS-CoV-2 S, but not OC43-SECTO, correlate with serum SARS-CoV-2 virus neutralization titers.
(A) Linear regression between log2-transformed serum IgG and SARS-CoV-2 virus neutralization (PRNT50) titers show that only SARS-CoV and SARS-CoV-2 S–reactive IgG correlated with neutralization titers. Horizontal dotted lines show the background of the PMA. (B) Normalized counts of B cells specific for the SARS-CoV-2 antigens OC43-S1 and SARS-S1 selectively correlated with PRNT50 titers. Serum samples from 20 patients and B cell analysis for 17 patients with severe COVID-19 were included in these analyses. Solid line in A and B depicts the best-fit regression coefficient. Curved lines in A and B show the 95% confidence of the best-fit line.
Table 2. Patient characteristics.
Table 1. Patient sampling.
Acknowledgments
This study was funded by the European Union’s Horizon 2020 research and innovation program under grant agreements from the Versatile Emerging Infectious Disease Observatory (VEO; 874735), Rapid European COVID-19 Emergency Response Research (RECoVER; 101003589), and the Netherlands Organization for Health Research and Development (ZonMw; 10150062010008). We acknowledge Berend Jan Bosch, Chunyan Wang, and Wentao Li (Utrecht University, Netherlands) for generously supplying the SECTO antigens; Katharina S. Schmitz for technical assistance with the biosafety level 3 work; and Georges M.G.M. Verjans and Pieter L.A. Fraaij for scientific discussions (EMC, Rotterdam, Netherlands).
Version 1. 09/09/2021
In-Press Preview
Version 2. 11/01/2021
Electronic publication
Footnotes
Conflict of interest: The authors have declared that no conflict of interest exists.
Copyright: © 2021, American Society for Clinical Investigation.
Reference information: J Clin Invest. 2021;131(21):e150613.https://doi.org/10.1172/JCI150613.
Contributor Information
Muriel Aguilar-Bretones, Email: m.aguilarbretones.1@erasmusmc.nl.
Brenda M. Westerhuis, Email: westerhuis.brenda@gmail.com.
Matthijs P. Raadsen, Email: m.p.raadsen@erasmusmc.nl.
Erwin de Bruin, Email: e.debruin@erasmusmc.nl.
Felicity D. Chandler, Email: f.chandler@erasmusmc.nl.
Nisreen M.A. Okba, Email: n.okba@erasmusmc.nl.
Bart L. Haagmans, Email: b.haagmans@erasmusmc.nl.
Thomas Langerak, Email: thomas.langerak@erasmusmc.nl.
Henrik Endeman, Email: h.endeman@erasmusmc.nl.
Diederik A.M.P.J. Gommers, Email: d.gommers@erasmusmc.nl.
Eric C.M. van Gorp, Email: e.vangorp@erasmusmc.nl.
Rory D. de Vries, Email: r.d.devries@erasmusmc.nl.
Ron A.M. Fouchier, Email: r.fouchier@erasmusmc.nl.
Barry H.G. Rockx, Email: b.rockx@erasmusmc.nl.
Marion P.G. Koopmans, Email: m.koopmans@erasmusmc.nl.
Gijsbert P. van Nierop, Email: g.p.vannierop@erasmusmc.nl.
References
- 1.Zhu N, et al. A novel coronavirus from patients with pneumonia in China, 2019. N Engl J Med. 2020;382(8):727–733. doi: 10.1056/NEJMoa2001017. [DOI] [PMC free article] [PubMed] [Google Scholar]
- 2.Huang C, et al. Clinical features of patients infected with 2019 novel coronavirus in Wuhan, China. Lancet. 2020;395(10223):497–506. doi: 10.1016/S0140-6736(20)30183-5. [DOI] [PMC free article] [PubMed] [Google Scholar]
- 3.Wang D, et al. Clinical characteristics of 138 hospitalized patients with 2019 novel Coronavirus-infected pneumonia in Wuhan, China. JAMA. 2020;323(11):1061–1069. doi: 10.1001/jama.2020.1585. [DOI] [PMC free article] [PubMed] [Google Scholar]
- 4.Chen N, et al. Epidemiological and clinical characteristics of 99 cases of 2019 novel coronavirus pneumonia in Wuhan, China: a descriptive study. Lancet. 2020;395(10223):507–513. doi: 10.1016/S0140-6736(20)30211-7. [DOI] [PMC free article] [PubMed] [Google Scholar]
- 5.Wec AZ, et al. Broad neutralization of SARS-related viruses by human monoclonal antibodies. Science. 2020;369(6504):731–736. doi: 10.1126/science.abc7424. [DOI] [PMC free article] [PubMed] [Google Scholar]
- 6.Piccoli L, et al. Mapping neutralizing and immunodominant sites on the SARS-CoV-2 spike receptor-binding domain by structure-guided high-resolution serology. Cell. 2020;183(4):1024–1042. doi: 10.1016/j.cell.2020.09.037. [DOI] [PMC free article] [PubMed] [Google Scholar]
- 7.Long QX, et al. Antibody responses to SARS-CoV-2 in patients with COVID-19. Nat Med. 2020;26(6):845–848. doi: 10.1038/s41591-020-0897-1. [DOI] [PubMed] [Google Scholar]
- 8.Shrock E, et al. Viral epitope profiling of COVID-19 patients reveals cross-reactivity and correlates of severity. Science. 2020;370(6520):eabd4250. doi: 10.1126/science.abd4250. [DOI] [PMC free article] [PubMed] [Google Scholar]
- 9.Lee WS, et al. Antibody-dependent enhancement and SARS-CoV-2 vaccines and therapies. Nat Microbiol. 2020;5(10):1–1191. doi: 10.1038/s41564-020-00789-5. [DOI] [PMC free article] [PubMed] [Google Scholar]
- 10.Wu C, et al. Risk factors associated with acute respiratory distress syndrome and death in patients with Coronavirus Disease 2019 Pneumonia in Wuhan, China. JAMA Intern Med. 2020;180(7):934–943. doi: 10.1001/jamainternmed.2020.0994. [DOI] [PMC free article] [PubMed] [Google Scholar]
- 11.Yewdell JW, Santos JJS. Original antigenic sin: how original? How sinful? Cold Spring Harb Perspect Med. 2021;11(5):a038786. doi: 10.1101/cshperspect.a038786. [DOI] [PMC free article] [PubMed] [Google Scholar]
- 12.Fonville JM, et al. Antibody landscapes after influenza virus infection or vaccination. Science. 2014;346(6212):996–1000. doi: 10.1126/science.1256427. [DOI] [PMC free article] [PubMed] [Google Scholar]
- 13.Lessler J, et al. Evidence for antigenic seniority in influenza A (H3N2) antibody responses in southern China. PLoS Pathog. 2012;8(7):26. doi: 10.1371/journal.ppat.1002802. [DOI] [PMC free article] [PubMed] [Google Scholar]
- 14.Meade P, et al. Influenza virus infection induces a narrow antibody response in children but a broad recall response in adults. mBio. 2020;11(1):1–15. doi: 10.1128/mBio.03243-19. [DOI] [PMC free article] [PubMed] [Google Scholar]
- 15.Rey FA, et al. The bright and the dark side of human antibody responses to flaviviruses: lessons for vaccine design. EMBO Rep. 2018;19(2):206–224. doi: 10.15252/embr.201745302. [DOI] [PMC free article] [PubMed] [Google Scholar]
- 16.Halstead SB, et al. Original antigenic sin in dengue. Am J Trop Med Hyg. 1983;32(1):154–156. doi: 10.4269/ajtmh.1983.32.154. [DOI] [PubMed] [Google Scholar]
- 17.Kim JH, et al. Original antigenic sin responses to influenza viruses. J Immunol. 2009;183(5):3294–3301. doi: 10.4049/jimmunol.0900398. [DOI] [PMC free article] [PubMed] [Google Scholar]
- 18.Thomas Jr F. On the doctrine of original antigenic sin. Proc Am Philos Soc. 1960;104(6):572–578. [Google Scholar]
- 19.Wrapp D, et al. Cryo-EM structure of the 2019-nCoV spike in the prefusion conformation. Science. 2020;367(6483):1260–1263. doi: 10.1126/science.abb2507. [DOI] [PMC free article] [PubMed] [Google Scholar]
- 20.Barnes CO, et al. Structures of human antibodies bound to SARS-CoV-2 spike reveal common epitopes and recurrent features of antibodies. Cell. 2020;182(4):828–842. doi: 10.1016/j.cell.2020.06.025. [DOI] [PMC free article] [PubMed] [Google Scholar]
- 21.Walls AC, et al. Structure, function, and antigenicity of the SARS-CoV-2 spike glycoprotein. Cell. 2020;181(2):281–292. doi: 10.1016/j.cell.2020.02.058. [DOI] [PMC free article] [PubMed] [Google Scholar]
- 22.Lv H, et al. Cross-reactive antibody response between SARS-CoV-2 and SARS-CoV infections. Cell Rep. 2020;31(9):1–20. doi: 10.1016/j.celrep.2020.107725. [DOI] [PMC free article] [PubMed] [Google Scholar]
- 23.Okba NMA, et al. Severe acute respiratory syndrome coronavirus 2-specific antibody responses in Coronavirus disease patients. Emerg Infect Dis. 2020;26(7):1478–1488. doi: 10.3201/eid2607.200841. [DOI] [PMC free article] [PubMed] [Google Scholar]
- 24.Wang Y, et al. Kinetics of viral load and antibody response in relation to COVID-19 severity. J Clin Invest. 2020;130(10):5235–5244. doi: 10.1172/JCI138759. [DOI] [PMC free article] [PubMed] [Google Scholar]
- 25. Westerhuis BM, et al. Homologous and heterologous antibodies to coronavirus 229E NL63 OC43 HKU1 SARS MERS and SARS-CoV-2 antigens in an age stratified cross-sectional serosurvey in a large tertiary hospital in The Netherlands [preprint]. Posted on medRxiv August 24, 2020. [DOI]
- 26.Ladner JT, et al. Epitope-resolved profiling of the SARS-CoV-2 antibody response identifies cross-reactivity with endemic human coronaviruses. Cell Rep Med. 2021;2(1):100189. doi: 10.1016/j.xcrm.2020.100189. [DOI] [PMC free article] [PubMed] [Google Scholar]
- 27.Song G, et al. Cross-reactive serum and memory B cell responses to spike protein in SARS-CoV-2 and endemic coronavirus infection. Nat Commun. 2021;12(1):2938. doi: 10.1101/2020.09.22.308965. [DOI] [PMC free article] [PubMed] [Google Scholar]
- 28.Hui DS, et al. Middle East respiratory syndrome coronavirus: risk factors and determinants of primary, household, and nosocomial transmission. Lancet Infect Dis. 2018;18(8):e217–e227. doi: 10.1016/S1473-3099(18)30127-0. [DOI] [PMC free article] [PubMed] [Google Scholar]
- 29.Leung GM, et al. Seroprevalence of IgG antibodies to SARS-coronavirus in asymptomatic or subclinical population groups. Epidemiol Infect. 2006;134(2):211–221. doi: 10.1017/S0950268805004826. [DOI] [PMC free article] [PubMed] [Google Scholar]
- 30.Fierz W, Walz B. Antibody dependent enhancement due to original antigenic sin and the development of SARS. Front Immunol. 2020;11(june):1–5. doi: 10.3389/fimmu.2020.01120. [DOI] [PMC free article] [PubMed] [Google Scholar]
- 31.Ng KW, et al. Preexisting and de novo humoral immunity to SARS-CoV-2 in humans. Science. 2020;370(6522):1339–1343. doi: 10.1126/science.abe1107. [DOI] [PMC free article] [PubMed] [Google Scholar]
- 32.Monsalvo AC, et al. Severe pandemic 2009 H1N1 influenza disease due to pathogenic immune complexes. Nat Med. 2011;17(2):195–199. doi: 10.1038/nm.2262. [DOI] [PMC free article] [PubMed] [Google Scholar]
- 33.Anderson EM, et al. Seasonal human coronavirus antibodies are boosted upon SARS-CoV-2 infection but not associated with protection. Cell. 2021;184(7):1858–1864. doi: 10.1016/j.cell.2021.02.010. [DOI] [PMC free article] [PubMed] [Google Scholar]
- 34.Aydillo T, et al. Immunological imprinting of the antibody response in COVID-19 patients. Nat Commun. 2021;12(1):3781. doi: 10.1038/s41467-021-23977-1. [DOI] [PMC free article] [PubMed] [Google Scholar]
- 35.Corman VM, et al. Detection of 2019 novel coronavirus (2019-nCoV) by real-time RT-PCR. Euro Surveill. 2020;25(3):1–8. doi: 10.2807/1560-7917.ES.2020.25.3.2000045. [DOI] [PMC free article] [PubMed] [Google Scholar]
- 36.Weiskopf D, et al. Phenotype and kinetics of SARS-CoV-2-specific T cells in COVID-19 patients with acute respiratory distress syndrome. Sci Immunol. 2020;5(48):1–14. doi: 10.1126/sciimmunol.abd2071. [DOI] [PMC free article] [PubMed] [Google Scholar]
- 37.Westerhuis B, et al. Specific memory B cell response in humans upon infection with highly pathogenic H7N7 avian influenza virus. Sci Rep. 2020;10(1):3152. doi: 10.1038/s41598-020-60048-9. [DOI] [PMC free article] [PubMed] [Google Scholar]
- 38.Koopmans M, et al. Profiling of humoral immune responses to influenza viruses by using protein microarray. Clin Microbiol Infect. 2012;18(8):797–807. doi: 10.1111/j.1469-0691.2011.03701.x. [DOI] [PubMed] [Google Scholar]
- 39.Walls AC, et al. Glycan shield and epitope masking of a coronavirus spike protein observed by cryo-electron microscopy. Nat Struct Mol Biol. 2016;23(10):899–905. doi: 10.1038/nsmb.3293. [DOI] [PMC free article] [PubMed] [Google Scholar]
- 40.Wang C, et al. A conserved immunogenic and vulnerable site on the coronavirus spike protein delineated by cross-reactive monoclonal antibodies. Nat Commun. 2021;12(1):1715. doi: 10.1038/s41467-021-21968-w. [DOI] [PMC free article] [PubMed] [Google Scholar]
- 41.Widjaja I, et al. Towards a solution to MERS: protective human monoclonal antibodies targeting different domains and functions of the MERS-coronavirus spike glycoprotein. Emerg Microbes Infect. 2019;8(1):516–530. doi: 10.1080/22221751.2019.1597644. [DOI] [PMC free article] [PubMed] [Google Scholar]
- 42.Fedry J, et al. Structural insights into the cross-neutralization of SARS-CoV and SARS-CoV-2 by the human monoclonal antibody 47D11. Sci Adv. 2021;7(23):eabf5632. doi: 10.1126/sciadv.abf5632. [DOI] [PMC free article] [PubMed] [Google Scholar]
- 43.Tortorici MA, et al. Structural basis for human coronavirus attachment to sialic acid receptors. Nat Struct Mol Biol. 2019;26(6):481–489. doi: 10.1038/s41594-019-0233-y. [DOI] [PMC free article] [PubMed] [Google Scholar]
Associated Data
This section collects any data citations, data availability statements, or supplementary materials included in this article.


