

Abstract
Racial and gender disparities in end-of-life decision-making practices have not been well described in surgical patients. We performed an eight-year retrospective analysis of surgical patients within the Cerner Acute Physiology and Chronic Health Evaluation Outcomes database. ICU patients with documented admission code status, and death or ICU discharge code status, respectively, were included. Logistic regression analysis was performed to assess change in code status. Of 468,000 ICU patients, 97,968 (20.9%) were surgical, 63,567 (95%) survived, and 3,343 (5%) died during their hospitalization. Of those, 50,915 (80.1%) and 2,625 (78.5%) had complete code status data on admission and discharge or death, respectively. Women were less likely than men to remain full code at ICU discharge and death (n = 20,940, 95.6% and n = 141, 11.9% vs n = 29,320, 97.4% and n = 233, 16.3%, P < 0.001). Compared with whites, blacks and other minorities had a 0.46 odds (95% confidence interval [CI]: 0.33–0.64, P < 0.001) and 0.54 odds (95% CI: 0.34–0.85, P = 0.01) of changing from full code status before death, respectively. Before ICU discharge, blacks and other minorities had a 0.56 odds of changing from full code status when compared with whites (95% CI: 0.40–0.79, P < 0.001 vs 95% CI: 0.36–0.87, P = 0.01, respectively). Women were more likely to be discharged or die after a change in code status from full code (odds ratio 1.27, 95% CI: 1.06–1.07, P < 0.001; odds ratio 1.39, 95% CI: 1.09–1.79, P = 0.009). Men and minorities are more likely to be discharged from the ICU or die with a full code status designation.
GREATER THAN 20 per cent of deaths in the United States follow admission to an ICU.1 The healthcare utilization within the last 12 months of life significantly contributes to the cost of health care in the United States. It is reported that 10 to 12 per cent of the total United States healthcare expenditure is used around the end of life and accounts for greater than one-fourth of Medicare expenditures for the elderly.2 Several European countries have strict limits on care delivery based on age and comorbidities in an attempt to limit the cost of end-of-life care. In the United States, social and political factors make rationing of healthcare services untenable.3–6
Despite considerable technologic breakthroughs in the provision of intensive care during the last 40 years, mortality in the ICU remains high, ranging from 6.4 to 40 per cent across ICUs depending on the severity of illness.7 Increasingly, clinicians are discussing patients’ preferences for life-sustaining treatments (LSTs) with the patients and/or their surrogates to promote patient autonomy. Limitations in LSTs include withholding or withdrawing cardiopulmonary resuscitation, mechanical ventilation, renal replacement therapy, intravenous blood pressure support, or artificial nutrition. These discussions commonly lead to orders designating a patient’s “code status” or care directives in the hospital.
Advanced age is known to be associated with an increased use of do-not-resuscitate (DNR) orders, but little is known about what other factors impact the decision to add or reverse prior limitations to LSTs during perioperative critical illness. Thus, the purpose of this study was to investigate the effect gender and race had on code status before death in patients admitted to United States’ surgical ICUs after surgery.
Methods
We performed a retrospective analysis of the prospectively collected data using the Cerner Acute Physiology and Chronic Health Evaluation (APACHE) Outcomes database.8 The database comprises 238 hospitals which submit data to Cerner for patients requiring ICU admission. Data fields are manually abstracted by trained clinical abstractors at participating hospitals. All abstractors receive formal training in APACHE data definitions and standards. All patients who are admitted to an ICU at a participating center are included in the database. Each new admission to the hospital is considered a primary admission and results in a unique patient-ICU encounter.
The study cohort included patients admitted to the ICU of participating centers between January 1, 2008, and December 31, 2016. All patients with surgery as their primary indication for admission and documented code status at ICU admission and death if they died during their hospitalization or ICU discharge if they survived their hospitalization were included. Surgery as primary indication for admission was defined for this study as being admitted to the ICU before or after undergoing a surgical procedure during the hospital admission.
Race/ethnicity in the Cerner APACHE database was categorized as white, black, Hispanic, Asian, American Indian, Alaska Native, and other. Race/ethnicity categories other than white and black were too small to be meaningfully analyzed; therefore, they were collapsed and labeled as “other minority” cohort.
The study population was analyzed using descriptive statistics in the overall sample and then stratified by mortality status. The cohort was then further categorized by code status at the time of ICU admission, ICU discharge, and death. Univariate analysis was performed to determine data distribution and missing values. There was less than 5 per cent missing data after application of the inclusion and exclusion criteria in the variables analyzed for this study. For measures of central tendency, univariate analysis was reported as means (±SD) or medians (IQR) if the covariates were not normally distributed. Bivariate analysis was performed over mortality and code status in two separate analyses. To compare the distribution of exposure across demographic variables, χ2 for categorical variables and Student’s t test or analysis of variance for normally distributed continuous variables were used.
To determine which predictors were associated with a change in code status from ICU admission to death and from ICU admission to ICU discharged for those who survived, we performed a multivariate logistic regression predictive model. A priori, the variables included were age, gender, race, modified Charlson Comorbidity Index, and APACHE III score. Other variables significant at P < 0.05 on bivariate analysis for change in code status were also included in the multivariate model. The fully adjusted model included age, gender, race, surgical specialty category, APACHE III score, ICU length of stay (LOS), and insurance status. The logistic regression was repeated with the fully adjusted model, with race and gender replaced as a combined single variable. A backward elimination approach was performed to reduce error in both models, with removal of variables based on P value (>0.05). Precision was maintained because there was narrowing of confidence intervals (CIs). A reduction in bias was obtained because there was <10 per cent change seen in coefficients. Based on these criteria, insurance status was removed from the final models because its inclusion was not statistically significant in the multiple logistic regression. Removal resulted in minimal change in the coefficients, with narrowing of the CIs.
This analysis was performed using StataCorp v14.2, College Station, TX. CIs are reported at 95 per cent, and alpha was set at 0.05 for this study. This study was approved by the University of Minnesota and the University of North Carolina Institutional Review Boards. The need for individual patient consent was waived because all data used in this study were already de-identified by Cerner.
Results
Of 468,000 ICU patients in the Cerner Apache database, 97,968 (20.9%) were classified with surgery as their primary admission diagnosis. Recorded ICU admission code status was present in 66,918 (68.3%; Fig. 1). Of those with ICU admission code status, 63,567 (95%) survived and 3,343 (5%) died during their hospitalization. The cohort who survived were younger (62. 4 ± 16 vs 68.8 ± 15.6 years, P < 0.001). Similar proportions of each gender (men: n = 1,823, 4.8%; women: n = 1,518, 5.3%, P = 0.001) and race (white: n = 2,690, 4.9%; black: n = 361, 5.2%; other minority: n = 193, 5.2%, P = 0.3) died. Mortality was highest in patients admitted for a trauma surgery (n = 455, 10%) and general surgery (n = 913, 9.6%) indications. There is a statistically significant difference in mortality between surgical categories (P < 0.001). The cohort who survived had lower Modified Charlson Comorbidity Index (1.3 ± 1.8 vs 1.4 ± 1.8, P < 0.001) and APACHE scores (46.1 ± 19.8 vs 80.9 ± 33.2, P < 0.001; Table 1).
Fig. 1.
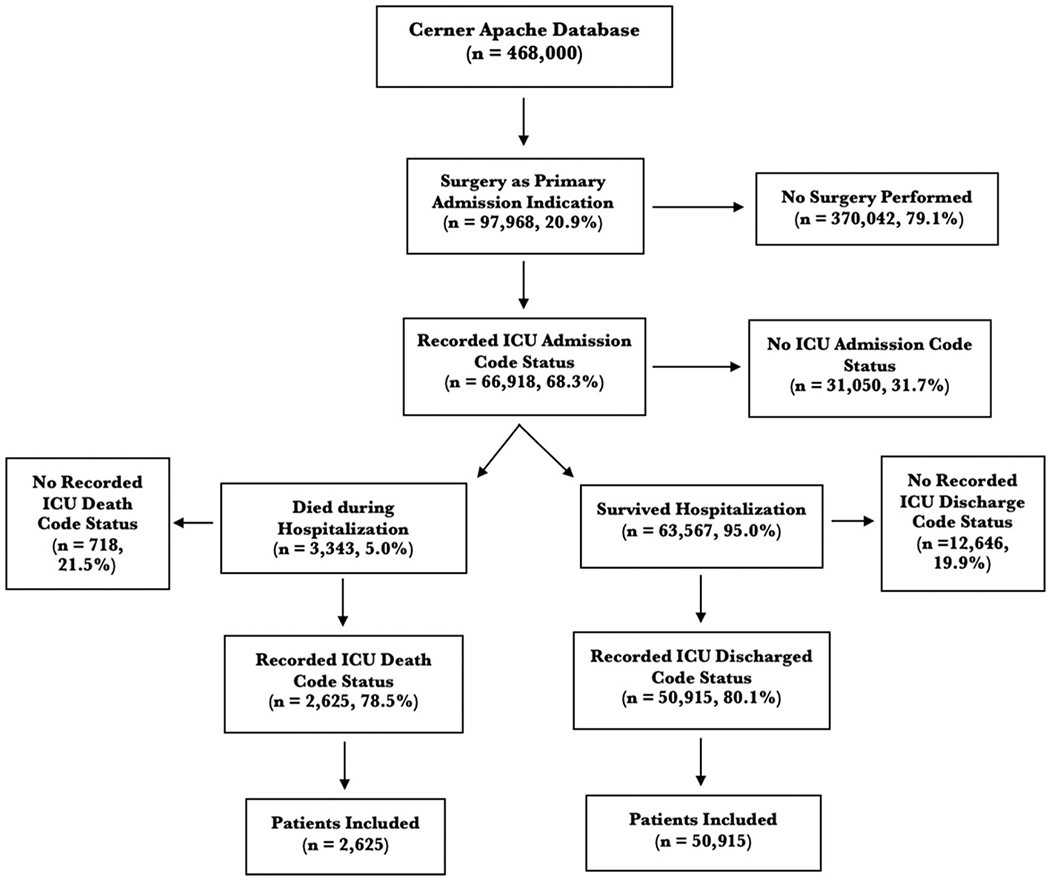
Study inclusion and exclusion criteria.
Table 1.
Characteristics of All ICU Admits, with ICU Code Status of those Who Lived and Died
| Lived (n = 63,567, 95%) | Died (n = 3,343, 5%) | P Value | |
|---|---|---|---|
| Age (years), mean ± SD | 62.4 ± 16 | 68.8 ± 15.6 | <0.001 |
| Gender, n (%) | 0.001 | ||
| Male | 36,474 (95.2) | 1,823 (4.8) | |
| Female | 27,079 (94.7) | 1,518 (5.3) | |
| Race, n (%) | 0.3 | ||
| White | 52,491 (95.1) | 2,690 (4.9) | |
| Black | 6,590 (94.8) | 361 (5.2) | |
| Other | 3,493 (94.8) | 193 (5.2) | |
| Surgical category, n (%) | <0.001 | ||
| Cardiac | 15,723 (97.7) | 376 (2.3) | |
| Trauma | 4,108 (90) | 455 (10) | |
| Vascular | 8,427 (94.3) | 511 (5.7) | |
| General surgery | 8,646 (90.5) | 913 (9.6) | |
| Endocrine | 344 (97.7) | 8 (2.3) | |
| Surgical oncology | 2,572 (94.3) | 156 (5.7) | |
| Transplant | 1,251 (97.9) | 27 (2.1) | |
| ENT | 1,627 (97.8) | 37 (2.2) | |
| OB/GYN | 1,089 (98.4) | 18 (1.6) | |
| Neurosurgery | 10,648 (96.2) | 420 (3.8) | |
| Thoracic | 3,338 (95.5) | 159 (4.6) | |
| Urology | 2,808 (96) | 117 (4) | |
| Orthopedics | 1,275 (94.1) | 80 (5.9) | |
| Plastics | 291 (99.3) | 2 (0.7) | |
| Other | 1,259 (96.8) | 42 (3.2) | |
| Modified Charlson Comorbidity Index, mean ± SD | 1.3 ± 1.8 | 1.4 ± 1.8 | <0.001 |
| APACHE score, mean ± SD | 46.1 ± 19.8 | 80.9 ± 33.2 | <0.001 |
| ICU LOS (days), median (IQR) | 3 (2–4) | 3 (2–8) | <0.001 |
| Hospital LOS (days), median (IQR) | 7.3 (4.4–12.2) | 8.7 (3.4–17.2) | <0.001 |
| Insurance, n (%) | <0.001 | ||
| Private | 9,047 (97.2) | 264 (2.8) | |
| Uninsured | 2,450 (94.4) | 145 (5.6) | |
| Government issued | 38,145 (94.7) | 2,139 (5.3) | |
| Other | 806 (96.3) | 31 (3.7) |
OB/GYN, obstetrics and gynecology.
Of those who survived their hospitalization, recorded ICU discharge code status was present in 50,915 (80.1%) and were included for further analysis. On admission, evaluation of code status revealed 50,121 (98.4%), 799 (1.6%), and 1 (0%) patients were full code, DNR, and comfort care, respectively. At ICU discharge, 49,533 (96.6%) were full code, 1,234 (2.4%) were DNR, and 154 (0.3%) were comfort care (Table 2).
Table 2.
Patients’ Code Status on ICU Admission and at Discharge or Death
| ICU Admission Code Status | Full Code, n (%) | DNR, n (%) | Comfort Care, n (%) | Total, n (%) |
|---|---|---|---|---|
| n = 52,010 | ICU Discharge Code Status (n = 52,010) | |||
| Full code, n (%) | 49,311 (96.8) | 671 (1.3) | 139 (2.7) | 50,121 (98.4) |
| DNR, n (%) | 222 (0.4) | 563 (1.1) | 14 (0) | 799 (1.6) |
| Comfort care, n (%) | 0 (0) | 0 (0) | 1 (0) | 1 (0) |
| Total, n (%) | 49,533 (96.6) | 1,234 (2.4) | 154 (0.3) | 50,921 (100) |
| n = 2,625 | Death Code Status (n = 2,625) | |||
| Full code, n (%) | 373 (14.2) | 569 (21.7) | 1,494 (56.9) | 2,436 (92.8) |
| DNR, n (%) | 2 (0.1) | 68 (2.6) | 104 (4) | 174 (6.6) |
| Comfort care, n (%) | 0 (0) | 0 (0) | 15 (0.6) | 15 (0.6) |
| Total, n (%) | 375 (10.5) | 637 (24.3) | 1,613 (61.4) | 2,625 (100) |
Of those who died during their hospital admission, 2625 (78.5%) had ICU admission and death code status recorded and were included for further analysis. On admission, evaluation of code status revealed 2436 (92.8%) patients were full code, 174 (6.6%) were DNR, and 15 (0.6%) were comfort care. At death, 375 (14.3%) patients were full code, 637 (24.3%) were DNR, and 1613 (61.4%) were comfort care (Table 2).
After stratifying by code status on ICU admission, ICU discharge, and death, demographics of the respective cohorts were compared (Table 3). Overall, patients with DNR status were older than those with full code status. On ICU admission, 1,352 (94.3%) and 1,082 (91%) of men and women were full code, respectively. Of those who survived hospitalization, 29,320 (97.4%) of men and 20,940 (95.6%) of women were full code. For those who died, 233 (16.3%) and 141 (11.9%) of men and women were full code at death, respectively. Similar proportions of patients were full code on ICU admission code status between whites (n = 44,153, 98%), blacks (n = 4,704, 98.7%), and the other minority cohorts (n = 2,744, 98.9%). A higher proportion of blacks (n = 4,536, 98.1%; n = 65, 26.1%) and other minorities (n = 2,640, 98.3%; n = 31, 22.3%) remained full code at ICU discharge and death than whites (n = 42,207, 96.4%; n = 269, 12.5%, P < 0.001). Patients with full code status (1.3 ± 1.8) at ICU admission had a lower Modified Charlson Comorbidity Index than those who were DNR (1.4 ± 1.9) or comfort cares (1.7 ± 1.4); however, there was no statistical difference in Modified Charlson Comorbidity Index between the code statuses at ICU discharge or death (Table 3).
Table 3.
Characteristics of Those with ICU Admission Code Status, as well as ICU Discharge Code Status for Those Who Survived and Death Code Status for Those Who Died during Their Hospitalization
| ICU Admission Code Status |
ICU Discharge Code Status |
ICU Death Code Status |
||||||||||
|---|---|---|---|---|---|---|---|---|---|---|---|---|
| Full Code | Do Not Resuscitate | Comfort Care | P Value | Full Code | Do Not Resuscitate | Comfort Care | P value | Full Code | Do Not Resuscitate | Comfort Care | P Value | |
| Age (years), mean ± SD | 62.9 ± 15.8 | 76.4 ± 12.9 | 76.3 ± 11.3 | <0.001 | 62.6 ± 15.8 | 76.3 ± 12.3 | 52.1 ± 22.5 | <0.001 | 63.7 ± 17.3 | 72.3 ± 14 | 69.3 ± 15.2 | 0.03 |
| Gender, n (%) | <0.001 | <0.001 | 0.002 | |||||||||
| Male | 30,499 (98.2) | 439 (1.4) | 6 (0.2) | 29,320 (97.4) | 786 (2.6) | 4 (0.01) | 233 (16.3) | 325 (22.7) | 876 (61.1) | |||
| Female | 22,050 (97.6) | 534 (2.4) | 10 (0.4) | 20,940 (95.6) | 954 (4.4) | 7 (0.03) | 141 (11.9) | 312 (26.2) | 736 (61.9) | |||
| Race, n (%) | 0.001 | <0.001 | <0.001 | |||||||||
| White | 44,153 (98) | 871 (1.9) | 14 (0.03) | 42,207 (96.4) | 1,579 (3.6) | 8 (0.02) | 269 (12.5) | 508 (23.6) | 1,380 (64) | |||
| Black | 4,704 (98.7) | 60 (1.3) | 1 (0.02) | 4,536 (98.1) | 86 (1.9) | 0(0) | 65 (26.1) | 70 (28.1) | 114 (45.8) | |||
| Other | 2,744 (98.9) | 32 (1.2) | 0 (0) | 2,640 (98.3) | 47 (1.8) | 0 (0) | 31 (22.3) | 44 (31.7) | 64 (46) | |||
| Surgical category, n (%) | <0.001 | <0.001 | ||||||||||
| Cardiac | 14,029 (99.5) | 65 (0.5) | 0 (0) | 13,819 (99.4) | 78 (0.6) | 0 (0) | 89 (28) | 87 (27.4) | 142 (44.7) | |||
| Trauma | 3,616 (97.5) | 91 (2.5) | 3 (0.1) | 3,256 (94.4) | 189 (5.5) | 4 (0.1) | 55 (15.2) | 61 (16.8) | 247 (68) | |||
| Vascular | 7,448 (98) | 148 (2) | 6 (0.1) | 7,059 (96.5) | 253 (3.5) | 0 (0) | 60 (13.9) | 105 (24.3) | 268 (62) | |||
| General surgery | 6,940 (96.1) | 276 (3.8) | 3 (0.1) | 6,328 (92.3) | 522 (7.6) | 4 (0.06) | 69 (9.9) | 190 (27.4) | 435 (62.7) | |||
| Endocrine | 263 (99.6) | 1 (0.4) | 0 (0) | 262 (100) | 0 (0) | 0 (0) | 0 (0) | 2 (33.3) | 4 (66.7) | |||
| Surgical oncology | 2,044 (98.1) | 39 (1.9) | 0 (0) | 1,958 (96.3) | 76 (3.7) | 0 (0) | 19 (16.2) | 29 (24.8) | 69 (59) | |||
| Transplant | 817 (99.5) | 3 (0.4) | 1 (0.1) | 810 (99.8) | 76 (3.7) | 0 (0) | 7 (41.2) | 5 (29.4) | 5 (29.4) | |||
| ENT | 1,050 (97.9) | 23 (2.1) | 0 (0) | 1,038 (97.4) | 28 (2.6) | 0 (0) | 3 (13) | 7 (30.4) | 13 (56.5) | |||
| OB/GYN | 767 (99.9) | 1 (0.1) | 0 (0) | 759 (99.1) | 6 (0.8) | 1 (0.1) | 2 (18.2) | 3 (27.3) | 6 (54.6) | |||
| Neurosurgery | 8,461 (98.5) | 131 (1.5) | 2 (0) | 8,115 (96.4) | 304 (3.6) | 2 (0.02) | 16 (4.9) | 59 (18.2) | 249 (76.9) | |||
| Thoracic | 2,784 (98.7) | 36 (1.3) | 0 (0) | 2,697 (97.8) | 62 (2.3) | 0 (0) | 20 (16.4) | 36 (29.5) | 66 (54.1) | |||
| Urology | 2,140 (96.5) | 77 (3.5) | 1 (0) | 2,056 (94.6) | 118 (5.4) | 0 (0) | 14 (15.2) | 26 (28.3) | 52 (56.5) | |||
| Orthopedics | 857 (96.5) | 57 (6.2) | 0 (0) | 815 (92.7) | 64 (7.3) | 0 (0) | 11 (19.6) | 18 (32.1) | 27 (48.2) | |||
| Plastics | 217 (100) | 0 (0) | 0 (0) | 214 (99.1) | 2 (0.9) | 0 (0) | 0 (0) | 1 (100) | 0 (0) | |||
| Other | 977 (97.8) | 22 (2.2) | 0 (0) | 949 (96.8) | 31 (3.2) | 0 (0) | 4 (13.8) | 6 (20.7) | 19 (65.5) | |||
| Modified Charlson Comorbidity Index, μ ± SD | 1.3 ± 1.8 | 1.4 ± 1.9 | 1.7 ± 1.4 | 0.009 | 1.3 ± 1.8 | 1.4 ± 1.9 | 1.1 ± 2.2 | 0.2 | 1.2 ± 1.7 | 1.5 ± 2 | 1.3 ± 1.7 | 0.6 |
| APACHE III Score, μ ± SD | 47.1 ± 21.3 | 62.8 ± 26.4 | 92.1 ± 25.2 | <0.001 | 45.5 ± 19.3 | 64.6 ± 23.1 | 52.5 ± 23.8 | <0.001 | 80.8 ± 36.5 | 82.7 ± 33.6 | 79.4 ± 32.3 | 0.006 |
| ICU LOS (days), median (IQR) | 3 (2–4) | 3 (2–4) | 1 (1–2) | <0.001 | 3 (2–4) | 3 (2–4) | 6 (4–11) | <0.001 | 3 (2–6) | 4 (2–8) | 5 (2–9) | 0.009 |
| Insurance, n (%) | <0.001 | <0.001 | <0.001 | |||||||||
| None | 2,551 (99.3) | 17 (0.7) | 0 (0) | 2,406 (99.1) | 14 (0.6) | 4 (0.2) | 39 (27.1) | 28 (19.4) | 77 (53.5) | |||
| Private | 9,092 (99.3) | 66 (0.7) | 1 (0.01) | 8,816 (99.1) | 72 (0.8) | 12 (0.1) | 46 (17.8) | 65 (25.1) | 148 (57.1) | |||
| Government | 38,726 (97.8) | 878 (2.2) | 13 (0.03) | 36,237 (96.6) | 1,131 (3) | 128 (0.3) | 266 (12.5) | 529 (24.9) | 1,326 (62.5) | |||
| Other | 831 (99.5) | 4 (0.5) | 0 (0) | 797 (99.1) | 6 (0.8) | 1 (0.1) | 7 (22.6) | 5 (16.1) | 19 (61.3) | |||
OB/GYN, obstetrics and gynecology.
In the logistic regression model for those who died during their hospitalization, increasing age (odds ratio [OR] 1.03, 95% CI: 1.02–1.03, P < 0.001) and being a woman (OR 1.39, 95% CI: 1.09–1.79, P = 0.009) were most associated with changing code status from full code to DNR/comfort care. Blacks (OR 0.46, 95% CI: 0.33–0.64, P < 0.001) and the other minority cohort (OR 0.54, 95% CI: 0.34–0.85, P = 0.01) were less likely to change their code status from full code to DNR/comfort care. Patients who underwent neurosurgical (OR 8.90, 95% CI: 4.99–15.86, P < 0.001), trauma surgery (OR 3.87, 95% CI: 2.46–6.08, P < 0.001), and general surgery (OR 3.34, 95% CI: 2.31–4.85, P < 0.001) procedures were most associated with changing code status from full code to DNR/comfort care. APACHE III score was not associated with a change in code status from full code to DNR/comfort care. Increased ICU LOS was associated with changing code status from full code to DNR/comfort care (OR 1.06, 95% CI: 1.03–1.08, P < 0.001; Table 4).
Table 4.
Logistic Regression of Factors Associated with Change in Code Status to DNR or Comfort Care for Those Who Died during Their Hospitalization
| OR | 95% CI | P Value | |
|---|---|---|---|
| Age | 1.03 | 1.02–1.03 | <0.001 |
| Gender | |||
| Male | Ref | *** | *** |
| Female | 1.39 | 1.09–1.79 | 0.009 |
| Race | |||
| White | Ref | *** | *** |
| Black | 0.46 | 0.33–0.64 | <0.001 |
| Other | 0.54 | 0.34–0.85 | 0.01 |
| Surgical category | |||
| Cardiac | Ref | *** | *** |
| Trauma | 3.87 | 2.46–6.08 | <0.001 |
| Vascular | 2.29 | 1.55–3.38 | <0.001 |
| General | 3.34 | 2.31–4.85 | <0.001 |
| Surgical Oncology | 2.32 | 1.32–4.11 | 0.004 |
| Transplant | 0.83 | 0.28–2.42 | 0.7 |
| ENT | 3.52 | 0.97–12.75 | 0.06 |
| OB/GYN | 2.47 | 0.49–13.25 | 0.3 |
| Neurosurgery | 8.90 | 4.99–15.86 | <0.001 |
| Thoracic | 2.20 | 1.23–3.91 | 0.007 |
| Urology | 2.21 | 1.16–4.19 | 0.02 |
| Orthopedics | 1.18 | 0.56–2.52 | 0.7 |
| Other | 2.57 | 0.85–7.82 | 0.1 |
| APACHE III score | 1.00 | 1.00–1.00 | 0.6 |
| ICU LOS (days) | 1.06 | 1.03–1.08 | <0.001 |
C-statistic: 0.733, P = 0.05.
OB/GYN, obstetrics and gynecology.
In the logistic regression model for those who survived hospitalization, increasing age (OR 1.07, 95% CI: 1.06–1.07, P < 0.001) and being female (OR 1.27, 95% CI: 1.10–1.48, P = 0.001) were associated with change from full code to DNR/comfort care. Blacks (OR 0.56, 95% CI: 0.40–0.79, P < 0.001) and the other minority cohort (OR 0.56, 95% CI: 0.36–0.87, P = 0.01) were less likely to change their code status from full code to DNR/comfort care. Patients who were admitted to the ICU and underwent surgical procedures by trauma surgery (OR 13.03, 95% CI: 8.83–19.24, P < 0.001), plastic surgery (OR 13.69, 95% CI: 3.20–58.49, P < 0.001), and neurosurgery (OR 12.61, 95% CI: 8.82–18.03, P < 0.001) when compared with cardiac surgery were most associated with a change code status from full code to DNR/comfort care. APACHE III score was associated with a change in code status from full code to DNR/comfort care for patients who survived hospitalization (OR 1.03, 95% CI: 1.02–1.03, P < 0.001; Table 5).
Table 5.
Logistic Regression of Factors Associated with Change in Code Status to DNR or Comfort Care from ICU Admission to Discharge for Those Who Survived Hospitalization
| OR | 95% CI | P Value | |
|---|---|---|---|
| Age | 1.07 | 1.06–1.07 | <0.001 |
| Gender | |||
| Male | Ref | *** | *** |
| Female | 1.27 | 1.10–1.48 | 0.001 |
| Race | |||
| White | Ref | *** | *** |
| Black | 0.56 | 0.40–0.79 | 0.001 |
| Other | 0.56 | 0.36–0.87 | 0.01 |
| Surgical category | |||
| Cardiac | Ref | *** | *** |
| Trauma | 13.03 | 8.83–19.24 | <0.001 |
| Vascular | 6.57 | 4.57–9.44 | <0.001 |
| General | 11.46 | 8.17–16.08 | <0.001 |
| Surgical oncology | 6.93 | 4.33–11.07 | <0.001 |
| Transplant | 0.83 | 0.11–6.32 | 0.9 |
| ENT | 6.15 | 2.94–12.84 | <0.001 |
| OB/GYN | 5.70 | 2.37–13.72 | <0.001 |
| Neurosurgery | 12.61 | 8.82–18.03 | <0.001 |
| Thoracic | 6.12 | 3.80–9.86 | <0.001 |
| Urology | 9.05 | 5.91–13.87 | <0.001 |
| Orthopedics | 10.16 | 0.56–2.52 | <0.001 |
| Plastics | 13.69 | 3.20–58.49 | <0.001 |
| Other | 9.53 | 0.85–7.82 | <0.001 |
| APACHE III score | 1.03 | 1.02–1.03 | <0.001 |
| ICU LOS (days) | 1.07 | 1.06–1.08 | <0.001 |
C-statistic: 0.862, P = 0.8.
OB/GYN, obstetrics and gynecology.
In multivariate analysis of patients who did not survive hospitalization, black men (vs white men) were less likely to change from full code to DNR/comfort care (OR 0.35, 95% CI: 0.23–0.55, P = 0.02). There is no statistically significant difference in change in code status between other minority men versus white men (P = 0.6). Black women (OR 0.34, 95% CI: 0.22–0.54, P < 0.001) and other minority women (OR 0.4, 95% CI: 0.26–0.89, P = 0.02) were less likely to change their code status from full code to DNR/comfort care than white women.
Discussion
In this study, we have shown critically ill black and other minority surgical patients are less likely to change their code status from full code to DNR/comfort care within an ICU setting than whites. Women have 39 per cent increase in odds of changing their code status from full code than men in an ICU setting. Furthermore, patients admitted to the ICU after transplant and orthopedic procedures had decreased odds of undergoing a change in code status during their ICU admission before death than cardiac surgery patients. By contrast, patients admitted for neurosurgical, general, and vascular surgery had higher odds of changing from full code to DNR/comfort care than cardiac surgical patients.
In this study of surgical patients, the vast majority of patients died with some limitations of LSTs in place. The rate of limitations of LSTs in our study was higher than most of the studies included in a 2019 review of 36 studies on end-of-life care in ICUs, which ranged from 29 to 85 per cent.9 Our findings of decreased odds of critically ill black patients changing from full code to DNR/comfort cares are consistent with other studies in the literature. In a cardiac ICU in North Carolina, blacks had a 1.91 (95% CI: 1.39–2.63–1.39, P < 0.0001) increase in odds of being full code status than whites after controlling for LOS in the ICU, age, and diagnosis.10 A study examining patient’s end-of-life desires after a life-threatening diagnosis showed 30 per cent of white patients in contrast to 19 per cent of nonwhite patients did not want cardiopulmonary resuscitation (relative risk 1.62; 95% CI: 1.3–2.1).11 The recently published systematic review of LSTs in the ICU similarly found white race associated with more limitation of LSTs.9
Racial and ethnic disparities in healthcare access and delivery are well established and multifactorial.12 This disparity persists in end-of-life care, with minorities using more healthcare resources in the last six months of life than their white counterparts in Medicare data.13 The source of this disparity is not clear, but an underlying element of mistrust in poor and minority populations persists in health care. The perception of mistrust from the black community is largely caused by their previous experiences with the healthcare system, in addition to the historical legacy of racial prejudice from the medical community and the history of medical experimentation.14, 15 Furthermore, many blacks hold strong spiritual beliefs which revere enduring of pain and suffering for survival.15–17 In addition, blacks are more likely to report poor-quality communication, and discussions with providers are less likely to lead to care which is aligned with their preferences.18, 19
Although not as well documented as race, female gender has also been associated with an increased likelihood of limitation of LSTs in two systematic reviews.9, 20 By contrast, a study of end-of-life decision-making in surgical patients showed men had increased odds of limiting LSTs than women. However, this study was limited because it did not control for race.21
Our study shows women have higher odds of changing their code status from full code to DNR/comfort care than men in an ICU setting even after controlling for critical illness severity. This may be related to the fact that women are more often widowed in the late phase of their life. Informal care, mostly given by the spouse, is not available to them.22 In addition, female patients may view autonomy in a more contextual and relational manner than their male counterparts and may prefer to make important end-of-life decisions together with other family members.23 Interestingly, a recent study of critically ill patients older than 80 years show men are more likely to opt for withdrawal of life-sustaining therapy than women.4
A notable finding of this study is the differences between admitting surgical specialty, even after adjusting for critical illness severity. These findings may also be attributable to associated peculiarities of some surgical specialties.24, 25 Transplant patients have lower odds of changing from full code to restricted code status because they are undergoing major, life transformative surgery to improve their survival. In addition, transplant surgery programs are judged on their one-year survival postliver transplant, so extraordinary measures may be performed to keep patients alive by providers to meet these benchmarks.26
Efforts to improve communication and shared decision-making between patients, families, and physicians may alleviate the differences seen in this study. The role of poor communication between healthcare providers and families regarding end-of-life care has been well established. In one study, less than 40 per cent of patients and surrogates report discussing prognosis and preferences for LSTs with providers.27 The failure to have LST discussions may be due to surgical team’s limited exposure to robust training on end-of-life discussions and shared decision-making.28 Furthermore, unlike critically ill medical patients, the critically ill surgical patient likely has at least two teams, the surgical team and the intensivist team, leading their care, which could lead to questions about who is the most appropriate team to lead any discussions regarding limiting interventions or end-of-life planning. Structured, multidisciplinary family meetings have been shown to improve family satisfaction.29 Implementing these efforts, such as family meetings with surgical resident involvement, in the surgical ICU setting may help create open dialog to establish and clarify family and patient preferences, clinical expectations, reduce differences between cohorts in end-of-life decision-making, and improve surgical training for end-of-life discussions.
This study’s major limitations are because of its retrospective methodology, and as a result, controlling for selection bias and confounding is limited. As with similar large databases, not all desired covariates are included. Specifically, ventilator days is not included in the database used. In addition, understanding the true nature of patient and family’s decision-making around limitation of LSTs is restricted. A physician’s prior training and the resulting end-of-life discussions with patients about end-of-life care are also unknown. Finally, only patients with surgical indications for admission were included; therefore, patients with non-operative diagnosis in surgical specialties were not analyzed.
Conclusions
Predictors of change in end-of-life code status within a surgical ICU include race, advanced age, and gender. Blacks are less likely and women are more likely to change their end-of-life code status from time of admission to death. Surprisingly, critical illness severity as measured by the APACHE III is not a predicator of change in end-of-life code status. Advance care planning and palliative care interventions can improve the quality of end-of-life care by reducing unwanted high intensity care. Improving physician training in shared decision-making and cultural competency about patient’s end-of-life beliefs are necessary to improve patient and provider experience, as well as to address cost.
Funding:
This study was funded by the Department of Surgery, University of North Carolina.
REFERENCES
- 1.Angus DC, Barnato AE, Linde-Zwirble WT, et al. Use of intensive care at the end of life in the United States: an epidemiologic study. Crit Care Med 2004;32:638–43. [DOI] [PubMed] [Google Scholar]
- 2.Lubitz JD, Riley GF. Trends in Medicare payments in the last year of life. N Engl J Med 1993;328:1092–6. [DOI] [PubMed] [Google Scholar]
- 3.Hadorn DC. Setting health care priorities in Oregon. Cost-effectiveness meets the rule of rescue. JAMA 1991;265:2218–25. [PubMed] [Google Scholar]
- 4.Guidet B, Flaatten H, Boumendil A, et al. Withholding or withdrawing of life-sustaining therapy in older adults (≥ 80 years) admitted to the intensive care unit. Intensive Care Med 2018;44:1027–38. [DOI] [PubMed] [Google Scholar]
- 5.Sprung CL, Danis M, Iapichino G, et al. Triage of intensive care patients: identifying agreement and controversy. Intensive Care Med 2013;39:1916–24. [DOI] [PMC free article] [PubMed] [Google Scholar]
- 6.Boumendil A, Angus DC, Guitonneau AL, et al. Variability of intensive care admission decisions for the very elderly. PLoS One 2012;7:e34387. [DOI] [PMC free article] [PubMed] [Google Scholar]
- 7.Knaus WA, Wagner DP, Zimmerman JE, et al. Variations in mortality and length of stay in intensive care units. Ann Intern Med 1993;118:753–61. [DOI] [PubMed] [Google Scholar]
- 8.Cerner. APACHE Outcomes. 2018. Available at: https://apacheoutcomes.cernerworks.com/criticaloutcomes-home/. Accessed October 17, 2019.
- 9.McPherson K, Carlos WG 3rd, Emmett TW, et al. Limitation of life-sustaining care in the critically ill: a systematic review of the literature. J Hosp Med 2019;14:303–10. [DOI] [PMC free article] [PubMed] [Google Scholar]
- 10.Johnson RW, Newby LK, Granger CB, et al. Differences in level of care at the end of life according to race. Am J Crit Care 2010;19:335–43. [DOI] [PMC free article] [PubMed] [Google Scholar]
- 11.Connors AF Jr, Dawson NV, Thomas C, et al. Outcomes following acute exacerbation of severe chronic obstructive lung disease. The SUPPORT investigators (study to understand prognoses and preferences for outcomes and risks of treatments). Am J Respir Crit Care Med 1996;154:959–67. [DOI] [PubMed] [Google Scholar]
- 12.Fiscella K, Franks P, Gold MR, et al. Inequality in quality: addressing socioeconomic, racial, and ethnic disparities in health care. JAMA 2000;283:2579–84. [DOI] [PubMed] [Google Scholar]
- 13.Byhoff E, Harris JA, Langa KM, et al. Racial and ethnic differences in end-of-life Medicare expenditures. J Am Geriatr Soc 2016;64:1789–97. [DOI] [PMC free article] [PubMed] [Google Scholar]
- 14.Kennedy BR, Mathis CC, Woods AK. African Americans and their distrust of the health care system: healthcare for diverse populations. J Cult Divers 2007;14:56–60. [PubMed] [Google Scholar]
- 15.Crawley L, Payne R, Bolden J, et al. Palliative and end-of-life care in the African American community. JAMA 2000;284:2518–21. [DOI] [PubMed] [Google Scholar]
- 16.Nye WP. Amazing grace: religion and identity among elderly black individuals. Int J Aging Hum Dev 1992;36:103–14. [DOI] [PubMed] [Google Scholar]
- 17.Johnson KS, Elbert-Avila KI, Tulsky JA. The influence of spiritual beliefs and practices on the treatment preferences of African Americans: a review of the literature. J Am Geriatr Soc 2005; 53:711–19. [DOI] [PubMed] [Google Scholar]
- 18.Welch LC, Teno JM, Mor V. End-of-life care in black and white: race matters for medical care of dying patients and their families. J Am Geriatr Soc 2005;53:1145–53. [DOI] [PubMed] [Google Scholar]
- 19.Loggers ET, Maciejewski PK, Paulk E, et al. Racial differences in predictors of intensive end-of-life care in patients with advanced cancer. J Clin Oncol 2009;27:5559–64. [DOI] [PMC free article] [PubMed] [Google Scholar]
- 20.Rietjens JA, Deschepper R, Pasman R, et al. Medical end-of-life decisions: does its use differ in vulnerable patient groups? A systematic review and meta-analysis. Soc Sci Med 2012;74:1282–7. [DOI] [PubMed] [Google Scholar]
- 21.Lissauer ME, Naranjo LS, Kirchoffner J, et al. Patient characteristics associated with end-of-life decision making in critically ill surgical patients. J Am Coll Surg 2011;213:766–70. [DOI] [PubMed] [Google Scholar]
- 22.Wachterman MW, Sommers BD. The impact of gender and marital status on end-of-life care: evidence from the national mortality follow-back survey. J Palliat Med 2006;9:343–52. [DOI] [PubMed] [Google Scholar]
- 23.Elderkin-Thompson V, Waitzkin H. Differences in clinical communication by gender. J Gen Intern Med 1999;14:112–21. [DOI] [PubMed] [Google Scholar]
- 24.Pittet D, Thievent B, Wenzel RP, et al. Importance of pre-existing co-morbidities for prognosis of septicemia in critically ill patients. Intensive Care Med 1993;19:265–72. [DOI] [PubMed] [Google Scholar]
- 25.Zampieri FG, Colombari F. The impact of performance status and comorbidities on the short-term prognosis of very elderly patients admitted to the ICU. BMC Anesthesiol 2014;14:59. [DOI] [PMC free article] [PubMed] [Google Scholar]
- 26.Recipients SRoT. Calculating the 5-tier assessments: a guide for pre- and posttransplant metrics 2016. https://www.srtr.org/about-the-data/guide-to-using-the-srtr-website/txguidearticles/5-tier-outcome-assessment/. Accessed June 8, 2019.
- 27.Teno JM, Fisher E, Hamel MB, et al. Decision-making and outcomes of prolonged ICU stays in seriously ill patients. J Am Geriatr Soc 2000;48:S70–4. [DOI] [PubMed] [Google Scholar]
- 28.Cooper Z, Meyers M, Keating NL, et al. Resident education and management of end-of-life care: the resident’s perspective. J Surg Educ 2010;67:79–84. [DOI] [PubMed] [Google Scholar]
- 29.Machare Delgado E, Callahan A, Paganelli G, et al. Multidisciplinary family meetings in the ICU facilitate end-of-life decision making. Am J Hosp Palliat Care 2009;26:295–302. [DOI] [PubMed] [Google Scholar]