

Abstract
COVID-19 has escalated into one of the most serious crises in the 21st Century. Given the rapid spread of SARS-CoV-2 and its high mortality rate, here we investigate the impact and relationship of airborne PM2.5 to COVID-19 mortality. Previous studies have indicated that PM2.5 has a positive relationship with the spread of COVID-19. To gain insights into the delayed effect of PM2.5 concentration (μgm−3) on mortality, we focused on the role of PM2.5 in Wuhan City in China and COVID-19 during the period December 27, 2019 to April 7, 2020. We also considered the possible impact of various meteorological factors such as temperature, precipitation, wind speed, atmospheric pressure and precipitation on pollutant levels. The results from the Pearson's correlation coefficient analyses reveal that the population exposed to higher levels of PM2.5 pollution are susceptible to COVID-19 mortality with a lag time of >18 days. By establishing a generalized additive model, the delayed effect of PM2.5 on the death toll of COVID-19 was verified. A negative correction was identified between temperature and number of COVID-19 deaths, whereas atmospheric pressure exhibits a positive correlation with deaths, both with a significant lag effect. The results from our study suggest that these epidemiological relationships may contribute to the understanding of the COVID-19 pandemic and provide insights for public health strategies.
Keywords: Correlation analysis, COVID-19, Lag time, Mortality, PM2.5
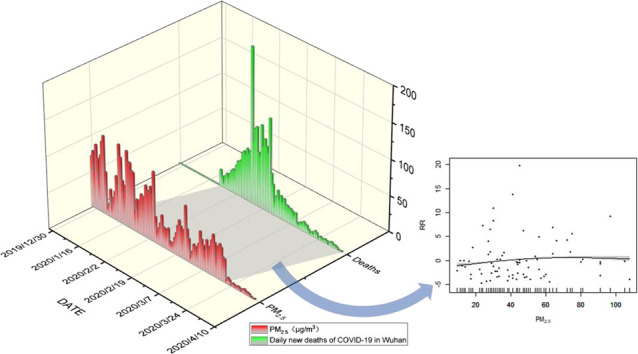
Graphical abstract
1. Introduction
Since December 2019, the coronavirus disease outbreak (COVID-19) has resulted in a global health catastrophe caused by the severe acute respiratory syndrome coronavirus 2 (SARS-CoV-2). COVID-19 was first officially reported in Wuhan, but the source of the virus is unknown (Special Expert Group for Control of the Epidemic of Novel & Pneumonia of the Chinese Preventive Medicine, 2020). The disease spread rapidly with much higher infection levels and speed than comparable epidemics such as Middle East Respiratory Syndrome (MERS) and Severe Acute Respiratory Syndrome (SARS) (Ganesh et al., 2021), disrupting normal lifestyles and social frameworks (Candido et al., 2020). The SARS-CoV-2 variant strains currently prevalent are Alpha, Beta, Gamma, Delta, Epsilon, Theta, Kappa, Lambda, and Mu, making the epidemic more serious (Chen, Wang, & Wei, 2021). The mortality rates of COVID-19 varies in different regions based on the local conditions and medical facilities, with an average of 2.21% as of March 15, 2021 (https://covid19.who.int/). Factors affecting mortality are widely discussed, including air quality, meteorological conditions (Rahman et al., 2021), travel habits (B. Wang et al., 2020) and social distance (Neto et al., 2021). Among them, air quality and meteorological conditions are relatively uncontrollable factors.
PM2.5 is airborne particulate matter with an aerodynamic diameter of <2.5 μm (Chinese Academy of Environmental Sciences and China National Environmental Monitoring Centre, 2012), which can be inhaled into the distal regions of the lung, and has a protagonist role (Mehmood et al., 2021), as well as the ability to carry into the respiratory system hazardous elements and organic and organometallic toxic substances; potentially resulting in lung and cardiovascular diseases (Kesic et al., 2012; Mehmood et al., 2021; Xu et al., 2021). It has been found that SARS-CoV-2 RNA exists in urban environmental PM samples (Kayalar et al., 2021). Chronic exposure to certain air pollutants may lead to more severe and lethal COVID-19 outcomes (Domingo et al., 2020). Numerous studies have now shown that the inhalation of particulate matter pollution has a strong correlation with the prevalence and mortality of COVID-19 (De Angelis et al., 2021; SanJuan-Reyes et al., 2021; Sasidharan et al., 2020), and could even lead to increased susceptibility to the disease (Chakrabarty et al., 2021; Coccia, 2021; Milicevic et al., 2021). In an Italian case study, it was shown that the daily COVID-19 cases were directly related to the mobility habits of a person(s) 21 days prior to infection (Carteni et al., 2020). It was also noted that a small increase in air pollution led to a large increase in COVID-19 infectivity and mortality in England (Travaglio et al., 2021). A study in California found that PM2.5 pollution caused by wildfires was correlated with mortality rates of COVID-19 (Meo et al., 2021). However, most studies have not considered the lag effect of PM2.5 on mortality from COVID-19, particularly in the time interval between exposure to PM2.5 pollution, and physiological responses to this inhalation hazard.
After the outbreak of the COVID-19 epidemic, the Municipal Government of Wuhan City officially reported the daily number of patients and deaths from January 23th, 2020 and implemented strict lockdown measures on the same day. The relationship between fine (i.e., PM2.5) and nanoparticulate (i.e., ultrafine) atmospheric matter and COVID-19 in Wuhan has been widely discussed (Lin et al., 2021). Some studies have observed that the air pollutants, including NO2, PM2.5, PM10, and CO decreased during the epidemic period (J. X. Chen et al., 2021; Sulaymon et al., 2021). Some studies have explored the real-time effect of PM2.5 on the mortality of COVID-19 in Wuhan (Yao et al., 2020). However, since PM2.5 is such a critical factor, further investigations are needed. Wuhan City was closed for 76 days and was re-opened on April 8th, 2020. During this period, the COVID-19 epidemic was affected by decreased routine human behaviors, and the period can be considered as a complete cycle from the beginning to end of the COVID-19 Wuhan epidemic. Thus, this cycle offers an important opportunity for studying the influence of air pollutants and meteorological factors on that epidemic. In addition, due to the mid-way change in testing standards, the number of confirmed COVID-19 has significantly increased. In addition, some asymptomatic cases or patients with very mild symptoms were not able to be tested over this period. Therefore, although the number of actual cases of the disease is uncertain, the number of deaths is clearly documented.
Understanding the correlation of the COVID-19 deaths, PM2.5 and meteorological variables improves our understanding of the incubation period of the SARS-CoV-2 virus contracted by airborne transmission. In this study, we focus on the period from December 27th, 2019 to April 7th, 2020, collated air pollutants and meteorological data during the Wuhan epidemic, and collected information on the case fatality rate of one COVID-19 epidemic cycle in Wuhan from January 23th, 2020 to April 7th, 2020. Based on these data, the cumulative correlation between PM2.5 and COVID-19 mortality were assessed.
2. Methods and data sources
2.1. Methods
All analysis was performed with IBM SPSS Statistics for Windows, Version 25.0 (IBM Corp., Armonk, NY, USA) and OriginPro, Version 2019 (OriginLb Corp., Northampton, MA, USA).
2.1.1. Pearson correlation analysis
Correlation analysis was employed to determine whether there was a relationship between the following two variables: (1) PM2.5 concentration and (2) COVID-19 mortality rate. The Pearson's correlation coefficient was utilised to measure the statistical relationship between these two continuous variables. Correlation coefficients were applied to define the relationship between air pollutants and human disease (Seposo et al., 2020), including COVID-19 (Choi et al., 2010; Daniele and Francesco, 2020). The formula for the correlation coefficient was as follows:
where x i and y i are the i-th sample values of variables X and Y respectively. , are the mean value of variables X and Y correspondingly. R is a dimensionless value with a range [−1, 1]. If the R value is positive the two variables are positively correlated, and negative R values show a negative correlation. The larger the |R| value (the closer to 1 or −1), the stronger the correlation between the two variables. If the R value is +1 or −1, it indicates that the two variables have a strict linear relationship (Choi et al., 2010).
2.1.2. Principal component analysis
PCA (Principal Component Analysis) uses dimensionality reduction to transform multiple indicators into a few Principal components. By simplifying the data structure, the index load and variance contribution rate on the principal components are used to calculate the index weight, so as to achieve comprehensive evaluation (Eder et al., 2014; Groth et al., 2013). PCA is widely used in the study of atmospheric pollutants and meteorological factors (Mor et al., 2021; Nguyen et al., 2021; Xiao et al., 2014). This study first determined the correlation between the number of COVID-19 deaths and variables such as air pollutants and meteorological factors based on Pearson's analysis results. PCA was used to reduce the dimensionality of relevant variables to obtain the synergistic relationship among variables.
The parameters involved in the main factor analysis were determined according to the correlation between individual factors and the number of deaths. Principal components were determined and the load of each principal component was calculated according to the measurement criteria of eigenvalue>1 and variance contribution rate reaching 80%.
2.1.3. Generalized additive model
GAM (Generalized additive model) represents a method of fitting a smooth relationship between two or more variables. GAMs are useful when the relationship between the variables is expected to be of a complex form (Verbeke, 2007). The GAM (Generalized additive model) analysis was performed by the ‘mgcv’ package (v 1.8-31) in R v4.0.3. The main advantage of this model is its flexibility to allow non-parametric fittings with relaxed assumptions on the actual association between response and predictor that provides the potential for better fitting to data than purely parametric models. This model has been widely used in air pollution research and epidemiology (Manoj et al., 2020; Rahman et al., 2021). The GAM is used in this study to analyze the additive relationship between PM2.5 and meteorological factors COVID-19. The core GAM equation is:
where, Y is the dependent variable and X is the independent variable s i(X i), i = 1, 2, ⋯p are smooth functions which are obtained by the backfitting algorithm. In this study, X i was set as PM2.5, temperature, air pressure, FAC1, FAC2 and FAC3 according to the linear correlation.
2.2. Data sources
Wuhan is in the east of Hubei Province, China, at the intersection of the Yangtze River and the Hanshui River (coordinates: 29°58′-31°22′N and 113°41′-115°05′E). Wuhan has a humid climate with four distinct seasons. Winter is cold (December to February 4 °C average) and summer is hot (June to August 29 °C average), with an annual average rainfall of 644.7 mm year (1985–2015; Climate & Weather Averages in Wuhan, Hubei, China; timeanddate.com). The study period (January 23th, 2020, to April 7th, 2020) covers the winter and spring seasons in Wuhan.
The daily COVID-19 death data (i.e., January 23th to April 7th, 2020) in Wuhan was obtained from the website of the China Health Committee (http://www.gov.cn/fuwu/bm/wsjkw/index.htm). The mass concentration data of PM2.5, PM10, SO2, NO2, O3, and CO represents the average value of urban national control points from the Wuhan air quality real-time release system (http://gis.hbj.wuhan.gov.cn:8088/Air/Default.aspx). Meteorological data were obtained from the open data platform (http://hz.zc12369.com/home/). The relevant urban meteorological stations to obtain the required meteorological variables, included temperature (°C), humidity (%), precipitation (mm), wind speed (m/s), and atmospheric pressure (hPa).
3. Results
3.1. Real-time analysis
3.1.1. Daily new death toll of COVID-19
Since January 23th, 2020, Wuhan City has officially counted and released the number of new daily deaths caused by the COVID-19 epidemic. As shown in Fig. 1 , the deaths in Wuhan from January 23th, 2020 to April 7th, 2020, presented a quasi-normal distribution. According to the changing trends, three stages were identified, including (1) the increased period of deaths (January 23th to February 4th) with the average death cases of 27.85, (2) the outbreak peak period (February 5th to February 24th) with the average death cases of 89.45, and (3) the declined period of deaths (February 25th to April 7th) with the average death cases of 12.30. These three stages defined a relatively complete epidemic cycle, and categorized as Stage 1, Stage 2, and Stage 3 in Fig. 1. “The New Coronavirus pneumonia diagnosis and treatment plan” (trial version fifth) has added “clinical diagnosis cases” in the case diagnosis classification of Hubei (NHC-China and SATCM, 2020), so that patients receive standardized treatment as early as possible. On February 12th, 13,436 new confirmed cases were reported in Wuhan, and the corresponding new deaths on February 12th increased to 216.
Fig. 1.

The number of new deaths per day during the COVID-19 epidemic cycle in Wuhan, divided into three stages.
The death data in the figure cover the period from January 23, 2020 to April 7, 2020. The yellow shaded region indicates the increased period of deaths, the red region corresponds to the outbreak peak period, and the green region shows the declined period of deaths.
3.1.2. Meteorological conditions during COVID-19
The dominant wind direction in Wuhan throughout the year is from the north. Fig. 2 shows the variation of several meteorological factors during COVID-19 in Wuhan. Table 1 lists the average values of these meteorological factors in the three stages of the COVID-19 epidemic cycle. In addition, the coefficient of variance (CV) describes the volatility of the data. During the study period, the temperature (T) range was 2.2–19.8 °C, with an average at 10.7 °C. The data show an overall upward trend. The temperature in Stage 2 had an opposite trend in comparison with daily new deaths. The relative humidity (RH) range was 60.0–94.0%, with an average of 78.1%. The range was large with a downward trend. The wind speed (WS) range was 0.3–4.6 m/s, with an average of 1.3 m/s and shows an upward trend in general. The atmospheric pressure (AP) range was 1006.0–1032.0 hPa, (average 1019.4 hPa) and is highest in Stage 1 and Stage 2, with an overall downward trend. The pressure in Stage 2 had a similar trend based on a comparison with daily new deaths. The atmospheric rainfall (AR) range was 0–26.7 mm, with an average 2.7 mm, with less and irregular rainfall during the period under study. According to the comparison of coefficient of variation, among the five meteorological factors, AR has the largest volatility and the other four have smaller volatility.
Fig. 2.

Changes in meteorological factors during COVID-19 in Wuhan.
The figure shows the data of temperature (T), relative humidity (RH), wind speed (WS), atmospheric pressure (AP) and atmospheric rainfall (AR) from January 23, 2020 to April 7, 2020, as well as the corresponding daily death number. The yellow shaded region indicates the increased period of deaths, the red one indicates the outbreak peak period, and the green one shows the declined period of deaths.
Table 1.
Average values of meteorological factors in the three stages.
| Meteorology | Stage 1 | Stage 2 | Stage 3 | Whole stage | Coefficient of variance |
|---|---|---|---|---|---|
| Temperature (°C) | 5.66 | 8.69 | 13.13 | 10.68 | 0.45 |
| Relative humidity (%) | 80.92 | 78.3 | 77.12 | 78.08 | 0.11 |
| Wind speed (m/s) | 1.08 | 1.19 | 1.36 | 1.27 | 0.70 |
| Air pressure (hPa) | 1023.23 | 1023.15 | 1016.47 | 1019.38 | 0.01 |
| Air rainfall (mm) | 1.08 | 3.01 | 3.00 | 2.68 | 2.31 |
3.1.3. Air quality during COVID-19
Although some studies have shown that the level of air pollutants was lower during COVID-19 lockdown compared with the period before the onset of COVID-19 epidemic (Sulaymon et al., 2021), there were positive and negative excursions during the COVID-19 epidemic period in Wuhan (Fig. 3 ).
Fig. 3.

Changes in the concentration of air pollutants during COVID-19 in Wuhan.
The air pollutants data include PM2.5, PM10, NO2, SO2, CO and O3 from January 23, 2020 to April 7, 2020. The yellow shaded region indicates the increased period of deaths, the red one shows the outbreak peak period, and the green one corresponds to the declined period of deaths.
The concentration of PM2.5 varied from 8 to 97 μg/m3 with an average of 38.3 μg/m3 and was higher during the outbreak and increasing periods of the epidemic, with a downward trend in general. The concentration of PM10 varied from 12 to 103 μg/m3 with an average of 51.6 μg/m3. The trend of PM10 was similar to PM2.5, but with a distinct increase during Stage 3. The concentration of NO2 varied from 10 to 43 μg/m3 with an average of 21.9 μg/m3, with a steady trend in Stage 1 and 2, and a sudden increase in the latter part of Stage 3. The concentration of CO varied from 0.5 to 14 μg/m3 with an average of 0.9 mg/m3, reflecting no major change. The O3 concentration ranged from 39 to 157 μg/m3 with an average of 85.3 μg/m3, and SO2 was from 5 to 17 μg/m3 with an average of 8.1 μg/m3. The changes of O3 and SO2 were relatively synchronous, showing an upward trend overall (Table 2 ). According to the comparison of coefficient of variance, among the six pollutants, PM2.5 and O3 have the greatest volatility. Although PM2.5 decreased, the increase in SO2 and NO2 increased the proportion and risk of secondary aerosol PM2.5 (Sun et al., 2020). The formation efficiencies of secondary aerosols were enhanced during the lockdown due to the increase of atmospheric oxidation capacity, as also noted in another recent study (Tian et al., 2021). As shown in Fig. 3, these pollutants do not display significant correlations with the daily death toll.
Table 2.
Average value of pollutants in each stage of the Wuhan epidemic cycle.
| Pollutant | Stage 1 | Stage 2 | Stage 3 | Whole stage | Coefficient of variance |
|---|---|---|---|---|---|
| PM2.5 (μg/m3) | 54.6 | 32.9 | 35.3 | 38.3 | 0.45 |
| PM10 (μg/m3) | 60.2 | 41.1 | 53.2 | 51.6 | 0.38 |
| SO2 (μg/m3) | 7.1 | 7.8 | 8.6 | 8.1 | 0.36 |
| CO (mg/m3) | 0.8 | 0.9 | 0.9 | 0.9 | 0.25 |
| NO2 (μg/m3) | 23.6 | 19.9 | 22.4 | 21.9 | 0.39 |
| O3_8h (μg/m3) | 82.8 | 74.2 | 92.1 | 85.3 | 0.49 |
Table 3 shows the correlation between PM2.5 and meteorological factors such as air temperature, humidity, wind speed, air pressure and rainfall. PM2.5 is affected by several meteorological factors in Stage 1 and Stage 3, but not in Stage 2. From the correlation coefficient of the whole stage, PM2.5, air temperature and air pressure are independent of each other. This also provides a basis for selecting variables in the next “GAM” analysis.
Table 3.
Influence of the correlation coefficient of on the meteorological factors on PM2.5 in each stage.
| PM2.5 in Stage 1 | PM2.5 in Stage 2 | PM2.5 in Stage 3 | PM2.5 in whole stage | |
|---|---|---|---|---|
| Temperature | 0.432 | 0.321 | 0.542** | 0.099 |
| Relative humidity | −0.539 | −0.216 | −0.461** | −0.271* |
| Wind speed | −0.779** | 0.034 | −0.072 | −0.15 |
| Air pressure | −0.684** | −0.18 | −0.097 | −0.004 |
| Air rainfall | −0.564* | −0.161 | −0.258 | −0.253* |
Significance codes: 0.01 ‘**’, 0.05 ‘*’. The related sig. Value (two tails), covariance and standard deviation are in Table S1.
3.1.4. Results of principal factor analysis
The principal component analysis of air pollutants and meteorological factors was carried out, and KMO and Bartlett spherical test were selected to confirm the applicability of the data. KOM is 0.638 and >0.6. The p value of Bartlett's spherical test was 0.00, which was less than the significance test limit of 0.05. Therefore, the input data are suitable for principal component analysis. In this study, the maximum variance method is used to rotate the initial load matrix, and the factor with load value >0.5 is selected as the corresponding principal factor.
Three factors with eigenvalues >1 are selected as the main factors (Fig. 4 ). Component 1 mainly includes PM10, PM2.5, NO2 and CO, accounting for 35.02%. Component 2 mainly includes RH and O3_8h, accounting for 24.22%. Component 3 mainly includes AP, T and SO2, accounting for 23.7%.
Fig. 4.

Scree plot and component diagram in rotated space.
The rotated component matrix is shown in Table S2.
3.2. Lag time analysis
3.2.1. Analysis results of linear correlation for the lag effect of meteorology and PM2.5 on COVID-19 deaths
The study of the lagged correlation of the COVID-19 deaths, PM2.5 and meteorological variables may indicate the incubation period of the SARS-CoV-2 virus caused by airborne transmission. Pearson correlations were used to evaluate the linear correlation in Wuhan during the COVID-19 epidemic. Some studies have attempted to establish a lag correlation between the number of cases per day and pollutants in COVID-19 infection. A study on the possible influence of a pollutant to an infection lag time of 0–14 days found a lag effect for PM2.5 (Wang and Li, 2021). In this study, we increased the potential lag time, by using the SPSS software to adjust PM2.5 over the range of 0 to 28 days with a view to quantify its impact on the number of deaths per day. We observed a cumulative relationship between PM2.5 and death rates from December 27th, 2019, to April 7th, 2020, using 28 correlation analyses, and conducted a two-tailed test. At the same time, we considered the influence of meteorological factors. In Fig. 5 , PM2.5, temperature, humidity, wind speed, atmospheric and pressure precipitation demonstrated the influence of coefficient curves under different lag days.
Fig. 5.

The correlation coefficient of the cumulative impact of PM2.5 and meteorological factors on the number of COVID-19 deaths per day.
The horizontal coordinates are the number of days forward, and the vertical coordinates are the correlation coefficient. The figure shows the correlation between PM2.5 (a), temperature (b), relative humidity (c), wind speed (d), atmospheric pressure (e) and atmospheric rainfall (f) and daily death number with different adjustment days. PM2.5 has a significant lag effect on the number of COVID-19 deaths. The related sig. Value (two tails), covariance and standard deviation are in Table S3.
Our results indicate a significant positive correlation between PM2.5 and the number of deaths per day at the level of 0.05 (two-tailed) on the 14th to 17th day of adjustment, and at the level of 0.01 (two-tailed) on the 18th to 27th day of adjustment; with the highest correlation coefficient on the 18th day (Fig. 5a). The temperature was negatively correlated with the number of deaths (G. Zhu et al., 2021). With the increase of adjustment days, the absolute value of the correlation coefficient between the temperature and the number of deaths reveals an increasing trend, with the highest value on the 26th day (Fig. 5b). A positive correlation was seen between atmospheric pressure and the number of deaths, and the correlation coefficient uncovered a peak on day 3 (Fig. 5e).
Therefore, we conclude that PM2.5 pollution has a greater impact on the mortality rates of COVID-19 after 18 days (Fig. 6 ). Among the meteorological factors, temperature shows a strong negative correlation with the number of deaths, whereas atmospheric pressure displays positive correlation. The influence of PM2.5 has a more obvious delay effect.
Fig. 6.

Comparison of PM2.5 concentration and daily COVID-19 deaths. Note that values of the PM2.5 concentrations are 18 days ahead.
The adjusted time series analysis showed that PM2.5 with a lag time of 18 days is significantly correlated with the daily death toll (Fig. 6), at Stage 1 and the first half of Stage 3, with a significant correspondence between the number of COVID-19 deaths and PM2.5. Overall, the adjusted daily PM2.5 and death toll show a low-high-low trend in these three stages. The corresponding change in pattern was not very clear in Stage 2 when the COVID-19 epidemic was in the early Stage of the outbreak. The number of newly confirmed cases increased sharply, which may be the reason for the observed increase in mortality in Stage 2. At the end of Stage 3, the effect of PM2.5 was not obvious, which could be attributed to the rapid development of the epidemic preventative measures during the epidemic (e.g., masks, hand washing, social distancing and lockdowns). As a result of these public health interventions, the daily death toll gradually approached zero, which curbed the larger-scale spread of COVID-19 in the region. In general, PM2.5 played a greater role at the beginning of the rising and declining stages of COVID-19.
3.2.2. Analysis of generalized additive model for the lag effect of meteorology and PM2.5 on COVID-19 deaths
The generalized additive model is used to study the additive correlation and influence of various factors on the death toll of COVID-19. We used the PM2.5, temperature, and atmospheric pressure of lag 18 days to establish a generalized additive model. The family is set to “quasipoisson”, and the smoothing parameter “k” is set to 3.
The additive relation of PM2.5 on daily COVID-19 deaths and its relationships with PM2.5 concentration, air temperature, air pressure, FAC1, FAC2, and FAC3 are shown in Fig. 7 . The additive positive correlation between PM2.5 and death of COVID-19 is significant, which is consistent with the results of the Pearson correlation analysis. However, it does not increase monotonically, which may be affected by the change of statistical mode in the second stage. There is an opposite relationship between temperature and COVID-19 deaths. Similarly, the temperature changes in the generalized additive model are consistent with the results of the Pearson correlation analysis. The deaths of COVID-19 decrease with the increase of temperature. The degree of freedom (EDF) of AP is 1 (Table 4 ), which means that there is a linear correlation between AP and death toll, but there is no additive relationship. FAC1 related to PM10, PM2.5, NO2 and CO was positively additive correlated with the number of deaths. FAC2 associated with RH and O3_8h had no additive correlation with the number of deaths. FAC3 related to AP, T and SO2 was negatively additive correlated with the number of deaths. We used the subgroup analysis method for sensitivity analysis. The analysis results show that (Table S4), the sensitivity is low and the model is relatively stable.
Fig. 7.

The results of the generalized additive model showing the additive relationships between daily COVID-19 deaths and the PM2.5 concentration, air temperature, air pressure, FAC1 (PM10, PM2.5, NO2 and CO), FAC2 (RH and O3_8h) and FAC3 (AP, T and SO2). The upward trend of the curve indicates that term has a positive effect on the daily death number, and the downward trend of the curve indicates that term has a negative effect on the daily death number.
Table 4.
Approximate significance of smooth terms.
| Terms | EDFa | P-value | Deviance explainedb |
|---|---|---|---|
| PM2.5 | 1.98 | 1.03∗10−5*** | 57.8% |
| Temperature | 1.92 | 2.14∗10−4*** | |
| Air pressure | 1.00 | 0.47 | |
| FAC1 | 1.27 | 6.6∗10−3** | 39.5% |
| FAC2 | 1.64 | 0.19 | |
| FAC3 | 1.00 | 5.7∗10–5*** |
Significance codes: 0 ‘***’, 0.001 ‘**’, 0.01 ‘*’.
EDF represents the estimated degree of freedom. Higher EDF values represent more complex splines.
Deviation explained refers to the degree of interpretation of the model to the data.
4. Discussion
PM2.5 can act as a vehicle or nucleation site to transport harmful substances directly into the respirable regions of the human lung, ultimately resulting in the translocation of pollutants into the systemic circulation. Exposure to ambient PM may also reduce the resistance to infection in the population (Maleki et al., 2021). People exposed to higher levels of PM2.5 pollution are more likely to suffer from cardiopulmonary diseases (Manojkumar and Srimuruganandam, 2021), including IHD (Ischemic Heart Disease) (Nirel et al., 2021), COPD (Chronic Obstructive Pulmonary Disease) (Guo et al., 2021), lung cancer (Hvidtfeldt et al., 2021), and strokes (Niu et al., 2021). The adverse health outcomes are more significant for persons who have these pre-existing diseases (Cheng et al., 2021; Mahmood et al., 2021; W. T. Zhu et al., 2021). A recent study suggested that long-term exposure to poor air quality may aggravate the clinical symptoms of COVID-19 (Al-Kindi et al., 2021).
Airborne particles can act as the possible carriers of the SARS-CoV-2 virus into the human body, resulting in increased morbidity and mortality (Cao et al., 2021; Maleki et al., 2021; Nguyen Thanh et al., 2021; Nor et al., 2021). It has been revealed that the interaction of SARS-CoV-2 with PM is possible in moist environments. After drying, PM can serve as a carrier for transmission of SARS-CoV-2 immobilized on their surface (Borisova and Komisarenko, 2020). The SARS-CoV-2 virus has been detected in hospitals, buses, subways and other environments (Hadei et al., 2021; Moreno et al., 2021; Nor et al., 2021; Yarahmadi et al., 2021).
The increase of secondary aerosols may also lead to an increase in the death toll of COVID-19. Some studies have noted that during the lockdown, O3 in Wuhan has increased by more than two times compared with the values before the lockdown (C. W. Huang et al., 2021; Lian et al., 2020), which can boost atmospheric oxidizing capacity and further enhance the formation of secondary organic aerosols (Huang et al., 2021; Le et al., 2020; Meng et al., 2021). An increase in the formation efficiency of secondary aerosols represented by nitrate and secondary OA was observed in Wuhan and many other areas during the COVID-19 lockdown (Sun et al., 2020; Tian et al., 2021; Wang et al., 2021; Zheng et al., 2020). It has been found that secondary aerosols can carry toxic bacteria (Jiang et al., 2021) and are more harmful to humans than primary aerosols (Lin et al., 2016). Therefore, the increase of secondary aerosol may be an important factor in PM2.5 role in the mortality of COVID-19.
In addition, PM2.5 can upregulate ACE-2 (Du et al., 2020), the receptor of the SARS-CoV-2 virus (Baildya et al., 2021), and increase the chance of viral RNA entering cells (Nguyen Thanh et al., 2021). Thus, the potential role of fine particles in the transmission of COVID-19 is of increased importance. The findings in this study support the urgent need to implement environmental mitigation strategies for reducing airborne particulate pollution. There is a lag time between the inhalation of PM2.5 and the onset of adverse respiratory responses (Dong et al., 2021; X. L. Zhu et al., 2021). A Mexican study, at an individual level, did not find robust evidence for short-term PM2.5 exposure increasing the chances of dying from COVID-19 (Lopez-Feldman et al., 2021). This supports findings that COVID-19 mortality seems to be driven mainly by longer-term (i.e., lagging, chronic or cumulative) rather than the short-term (i.e., acute) factors. Our results also suggest that the COVID-19 epidemic was established in Wuhan before any mobility restrictions were implemented.
The influence of meteorological factors has also been widely studied. The longevity of SARS-CoV-2 outside hosts decreases at high temperature and under sunlight (Yap et al., 2020). Respiratory-related mortality will increase with decreasing temperatures (Dadbakhsh et al., 2017). In a cold environment, the susceptibility of the host may be higher due to slower mucociliary clearance or decreased immune function under these conditions (Ficetola and Rubolini, 2021; Lowen and Steel, 2014). Areas with high atmospheric pressure are generally more moist compared to lower pressure areas, thereby providing more transport potential for active and invasive pathogens (Aidoo et al., 2021). The investigations conducted in India (Kulkarni et al., 2021) and in Italy (Lolli et al., 2020) considered that temperature was negatively correlated with the risk of COVID-19; these findings are consistent with our results. The study conducted in Ghana (Aidoo et al., 2021) had similar conclusions with our study in that there was a positive correlation between air pressure and the risk of contracting COVID-19. However, our results do not agree with studies that suggest that high temperature is conducive to the spread of the virus (Jain et al., 2021), or atmospheric pressure has a negative correlation (Sharma et al., 2021). Researchers have suggested that air humidity is the most important climatic factor in spreading the virus, while temperatures do not have a strong influence (Crema, 2021).
Although the lag time correlation between the COVID-19 mortality and exposure to airborne PM2.5 has been proposed, the limitation of this study still exists. Firstly, we have not considered impacts from personal behaviors like social distancing and personal hygiene (Bang et al., 2021; Magnan et al., 2021). Secondly, the current study only considered the Wuhan city, lack of research in the neighboring regions which might have a trans-regional influence for the COVID-19 transmissions. Finally, the model needs to be tested in other high incidence areas in the world.
5. Conclusion
In conclusion, the concentration of PM2.5 is related to the risk of contracting COVID-19, and its delayed effect on the mortality of COVID-19 is identified to be >18 days. COVID-19 mortality in Wuhan was driven mainly by the longer-term rather than the short-term factors. Relevant administration departments and policy makers should consider that the incubation period of the SARS-CoV-2 is longer than 18 days, which is even longer than the public think of 14 days. The temperature has a strong negative correlation with COVID-19 deaths in Wuhan, while atmospheric pressure has a positive correlation.
Code availability
Source code, with full documentation and examples, are freely available under the GNU General Public License on the WeirauchLab GitHub page: https://github.com/Fossette-x/COVID-19-and-PM2.5-in-Wuhan.git.
CRediT authorship contribution statement
L.Y.S.: funding acquisition, visualization, supervision, review and editing; Y.X.C.: conceptualization, writing original draft, investigation, visualization; T. J.: investigation, review and editing; M.S.: review and editing; L.F.O.S: supplementing argument; S.Y.G.: collecting and arranging the literature; K.D.B.: collecting and arranging the literature; X.L.F.: investigation, data curation; M.Y.Z.: review and editing; K.B.: review and editing.
Declaration of competing interest
The authors declare that they have no known competing financial interests or personal relationships that could have appeared to influence the work reported in this paper.
Acknowledgements
This study is supported by the National Natural Science Foundation of China (Grant No. 42075107), the Projects of International Cooperation and Exchanges NSFC (Grant No. 41571130031) and the Yueqi Scholar fund of China University of Mining and Technology (Beijing).
Editor: Wei Huang
Footnotes
Supplementary data to this article can be found online at https://doi.org/10.1016/j.scitotenv.2021.151286.
Appendix A. Supplementary data
Supplementary tables
References
- Aidoo E.N., Adebanji A.O., Awashie G.E., Appiah S.K. The effects of weather on the spread of COVID-19: evidence from Ghana. Bull. Natl. Res. Centre. 2021;45(1) doi: 10.1186/s42269-021-00484-3. [DOI] [PMC free article] [PubMed] [Google Scholar]
- Al-Kindi S.G., Brook R.D., Bhatt U., Brauer M., Cushman W.C., Hanson H.A., Kostis J., Lash J.P., Paine R., Raphael K.L., Rapp S., Tamariz L., Wright J.T., Rajagopalan S., Sprint Research Group The benefits of intensive versus standard blood pressure treatment according to fine particulate matter air pollution exposure: a post hoc analysis of SPRINT. Hypertension. 2021;77(3):813–822. doi: 10.1161/HYPERTENSIONAHA.120.15923. [DOI] [PMC free article] [PubMed] [Google Scholar]
- Baildya N., Ghosh N.N., Chattopadhyay A.P. Inhibitory capacity of chloroquine against SARS-CoV-2 by effective binding with angiotensin converting enzyme-2 receptor: an insight from molecular docking and MD-simulation studies. J. Mol. Struct. 2021;1230 doi: 10.1016/j.molstruc.2021.129891. [DOI] [PMC free article] [PubMed] [Google Scholar]
- Bang Y.R., Park S.C., Jang O.J., Kim J.H., Kim E.O., Kim S.H., Park J.H. Lifestyle changes that impact personal quality of life in the COVID-19 pandemic in South Korea. Psychiatry Investig. 2021;18(7):701–+. doi: 10.30773/pi.2021.0043. [DOI] [PMC free article] [PubMed] [Google Scholar]
- Borisova T., Komisarenko S. Air pollution particulate matter as a potential carrier of SARS-CoV-2 to the nervous system and/or neurological symptom enhancer: arguments in favor. Sci. Pollut. Res. 2020;28(30):40371–40377. doi: 10.1007/s11356-020-11183-3. [DOI] [PMC free article] [PubMed] [Google Scholar]
- Candido D.S., Claro I.M., de Jesus J.G., Souza W.M., Moreira F.R.R., Dellicour S., Mellan, Thomas A. du Plessis L., Pereira R.H.M., Sales F.C.S., Manuli E.R., Theze J., Almeida L., Menezes M.T., Voloch C.M., Fumagalli M.J., Coletti T.M., Silva C.A.M., Ramundo M.S., Amorim M.R., Hoeltgebaum H.H., Mishra S., Gill M.S., Carvalho L.M., Buss L.F., Prete C.A., Jr., Ashworth J., Nakaya H.I., Peixoto P.S., Brady O.J., Nicholls S.M., Tanuri A., Rossi A.D., Braga C.K.V., Gerber A.L., Guimaraes A.P.D.C., Gaburo N., Jr., Alencar C.S., Lima C.X., Levi J.E., Granato C., Ferreira G.M., Francisco R.S., Jr., Granja F., Jr., Garcia M.T., Jr., Moretti M.L., Jr., Perroud M.W., Jr., Castineiras T.M.P.P., Jr., Lazari C.S., Jr., Hill S.C., Jr., de Souza Santos A.A., Simeoni C.L., Forato J., Sposito A.C., Schreiber A.Z., Santos M.N.N., de Sa C.Z., Souza R.P., Resende-Moreira L.C., Teixeira M.M., Hubner J., Leme P.A.F., Moreira R.G., Nogueira M.L., Ferguson N.M., Costa S.F., Proenca-Modena J.L., Vasconcelos A.T.R., Bhatt S., Lemey P., Wu C.H., Rambaut A., Loman N.J., Aguiar R.S., Pybus O.G., Sabino E.C., Faria N.R., Brazil U.K., Ctr Arbovirus Discovery Evolution and epidemic spread of SARS-CoV-2 in Brazil. Science. 2020;369(6508) doi: 10.1126/science.abd2161. (1255-+) [DOI] [PMC free article] [PubMed] [Google Scholar]
- Cao Y.X., Shao L.Y., Jones T., Oliveira M.L.S., Ge S.Y., Feng X.L., Silva L.F.O., BeruBe K. Multiple relationships between aerosol and COVID-19: a framework for global studies. Gondwana Res. 2021;93:243–251. doi: 10.1016/j.gr.2021.02.002. [DOI] [PMC free article] [PubMed] [Google Scholar]
- Carteni A., Francesco L.D., Martino M. How mobility habits influenced the spread of the COVID-19 pandemic: results from the italian case study. Sci. Total Environ. 2020;741 doi: 10.1016/j.scitotenv.2020.140489. [DOI] [PMC free article] [PubMed] [Google Scholar]
- Chakrabarty R.K., Beeler P., Liu P., Goswami S., Harvey R.D., Pervez S., van Do A., Martin R.V. Ambient PM2.5 exposure and rapid spread of COVID-19 in the United States. Sci. Total Environ. 2021;760 doi: 10.1016/j.scitotenv.2020.143391. [DOI] [PMC free article] [PubMed] [Google Scholar]
- Chen J.H., Wang R., Wei G.W. ArXiv; 2021. Review of the Mechanisms of SARS-CoV-2 Evolution and Transmission. [Google Scholar]
- Chen J.X., Hu H., Wang F.F., Zhang M., Zhou T., Yuan S.C., et al. Air quality characteristics in Wuhan (China) during the 2020 COVID-19 pandemic. Environ. Res. 2021;195 doi: 10.1016/j.envres.2021.110879. [DOI] [PMC free article] [PubMed] [Google Scholar]
- Cheng J., Ho H.C., Webster C., Su H., Pan H.F., Zheng H., Xu Z.W. Lower-than-standard particulate matter air pollution reduced life expectancy in Hong Kong: a time-series analysis of 8.5 million years of life lost. Chemosphere. 2021;272 doi: 10.1016/j.chemosphere.2021.129926. [DOI] [PubMed] [Google Scholar]
- Chinese Academy of Environmental Sciences, China National Environmental Monitoring Centre . PRC standard; 2012. Ambient Air Quality Standards (Vol. GB 3095-2012, pp. 12p:A14) [Google Scholar]
- Choi J., Peters M., Mueller R.O. Correlational analysis of ordinal data: from Pearson's r to bayesian polychoric correlation. Asia Pac. Educ. Rev. 2010;11(4):459–466. [Google Scholar]
- Coccia M. Factors determining the diffusion of COVID-19 and suggested strategy to prevent future accelerated viral infectivity similar to COVID. Sci. Total Environ. 2021;729 doi: 10.1016/j.scitotenv.2020.138474. [DOI] [PMC free article] [PubMed] [Google Scholar]
- Crema E. The SARS-COV-2 outbreak around the Amazon rainforest: the relevance of the airborne transmission. Sci. Total Environ. 2021;759 doi: 10.1016/j.scitotenv.2020.144312. [DOI] [PMC free article] [PubMed] [Google Scholar]
- Dadbakhsh M., Khanjani N., Bahrampour A., Haghighi P.S. Death from respiratory diseases and temperature in shiraz, Iran (2006–2011) Int. J. Biometeorol. 2017;61(2):239–246. doi: 10.1007/s00484-016-1206-z. [DOI] [PubMed] [Google Scholar]
- Daniele F., Francesco R. Role of the chronic air pollution levels in the COVID-19 outbreak risk in Italy. Environ. Pollut. 2020;264 doi: 10.1016/j.envpol.2020.114732. [DOI] [PMC free article] [PubMed] [Google Scholar]
- De Angelis E., Renzetti S., Volta M., Donato F., Calza S., Placidi D., Lucchini R.G., Rota M. COVID-19 incidence and mortality in Lombardy, Italy: an ecological study on the role of air pollution, meteorological factors, demographic and socioeconomic variables. Environ. Res. 2021;195 doi: 10.1016/j.envres.2021.110777. [DOI] [PMC free article] [PubMed] [Google Scholar]
- Domingo J.L., Marques M., Rovira J. Influence of airborne transmission of SARS-CoV-2 on COVID-19 pandemic. A review. Environ. Res. 2020;188 doi: 10.1016/j.envres.2020.109861. [DOI] [PMC free article] [PubMed] [Google Scholar]
- Dong J.Y., Wang Y.R., Wang J.C., Bao H.R. Association between atmospheric PM2.5 and daily outpatient visits for children’s respiratory diseases in Lanzhou. Int. J. Biometeorol. 2021;65(7):989–999. doi: 10.1007/s00484-021-02080-6. [DOI] [PubMed] [Google Scholar]
- Du X.H., Zeng X.J., Zhang J., Pan K., Song L.Y., Zhou J., Zhou L., Xie Y.Q., Sun Q.H., Ge W.Z., Chen R.J., Zhao J.Z., Kan H.D. Ambient fine particulate matter induced the elevation of blood pressure through ACE2/Ang (1–7) pathway: the evidence from urine metabolites. Ecotoxicol. Environ. Saf. 2020;203 doi: 10.1016/j.ecoenv.2020.111044. [DOI] [PubMed] [Google Scholar]
- Eder B., Bash J., Foley K., Pleim J. Incorporating principal component analysis into air quality model evaluation. Atmos. Environ. 2014;82:307–315. [Google Scholar]
- Ficetola G.F., Rubolini D. Containment measures limit environmental effects on COVID-19 early outbreak dynamics. Sci. Total Environ. 2021;761 doi: 10.1016/j.scitotenv.2020.144432. [DOI] [PMC free article] [PubMed] [Google Scholar]
- Ganesh B., Rajakumar T., Malathi M., Manikandan N., Nagaraj J., Santhakumar A., Elangovan A., Malik Y.S. Epidemiology and pathobiology of SARS-CoV-2 (COVID-19) in comparison with SARS, MERS: an updated overview of current knowledge and future perspectives. Clin. Epidemiol. Glob. Health. 2021;10 doi: 10.1016/j.cegh.2020.100694. [DOI] [PMC free article] [PubMed] [Google Scholar]
- Groth D., Hartmann S., Klie S., Selbig J. Principal components analysis. Methods Mol. Biol. 2013;930:527–547. doi: 10.1007/978-1-62703-059-5_22. [DOI] [PubMed] [Google Scholar]
- Guo B., Wang Y., Pei L., Yu Y., Liu F., Zhang D.H., Zhang B., Guo H.J. Determining the effects of socioeconomic and environmental determinants on chronic obstructive pulmonary disease (COPD) mortality using geographically and temporally weighted regression model across Xi’an during 2014–2016. Sci. Total Environ. 2021;756 doi: 10.1016/j.scitotenv.2020.143869. [DOI] [PubMed] [Google Scholar]
- Hadei M., Mohebbi S.R., Hopke P.K., Shahsavani A., Bazzazpour S., Alipour M., Jafari A.J., Bandpey A.M., Zali A., Yarahmadi M., Farhadi M., Rahmatinia M., Hasanzadeh V., Nazari S.S.H., Asadzadeh-Aghdaei H., Tanhaei M., Zali M.R., Kermani M., Vaziri M.H., Chobineh H. Presence of SARS-CoV-2 in the air of public places and transportation. Atmos. Pollut. Res. 2021;12(3):302–306. doi: 10.1016/j.apr.2020.12.016. [DOI] [PMC free article] [PubMed] [Google Scholar]
- Huang X., Ding A.J., Gao J., Zheng B., Zhou D.R., Qi X.M., Tang R., Wang J.P., Ren C.H., Nie W., Chi X.G., Xu Z., Chen L.D., Li Y.Y., Che F., Pang N.N., Wang H.K., Tong D., Qin W., Cheng W., Liu W.J., Fu Q.Y., Liu B.X., Chai F.H., Davis S.J., Zhang Q., He K.B. Enhanced secondary pollution offset reduction of primary emissions during COVID-19 lockdown in China. Natl. Sci. Rev. 2021;8(2) doi: 10.1093/nsr/nwaa137. [DOI] [PMC free article] [PubMed] [Google Scholar]
- Huang C.W., Wang T.J., Niu T., Li M.M., Liu H.L., Ma C.Q. Study on the variation of air pollutant concentration and its formation mechanism during the COVID-19 period in Wuhan. Atmos. Environ. (Oxford, England : 1994) 2021;251 doi: 10.1016/j.atmosenv.2021.118276. [DOI] [PMC free article] [PubMed] [Google Scholar]
- Hvidtfeldt U.A., Chen J., Andersen Z.J., Atkinson R., Bauwelinck M., Bellander T., Brandt J., Brunekreef B., Cesaroni G., Concin H., Fecht D., Forastiere F., Gils C.H.V., Gulliver J., Hertel O., Hoek G., Hoffmann B., Janssen N., Jorgensen J.T., Katsouyanni K., Joeckel K.H., Ketzel M., Klompmaker J.O., Lang A., Leander K., Liu S., Ljungman P.L.S., Magnusson P.K.E., Mehta A.J., Nagel G., Oftedal B., Pershagen G., Peter R.S., Peters A., Renzi M., Rizzuto D., Rodopoulou S., Samoli E., Schwarze P.E., Severi G., Sigsgaard T., Stafoggia M., Strak M., Vienneau D., Weinmayr G., Wolf K., Raaschou-Nielsen O., Hoogh K.D. Long-term exposure to fine particle elemental components and lung cancer incidence in the ELAPSE pooled cohort. Environ. Res. 2021;193 doi: 10.1016/j.envres.2020.110568. [DOI] [PubMed] [Google Scholar]
- Jain M., Sharma G.D., Goyal M., Kaushal R., Sethi M. Econometric analysis of COVID-19 cases, deaths, and meteorological factors in South Asia. Sci. Pollut. Res. 2021;28(22):28518–28534. doi: 10.1007/s11356-021-12613-6. [DOI] [PMC free article] [PubMed] [Google Scholar]
- Jiang B., Xia D., Liu X. Theoretical analysis for bacteria participating in atmospheric nucleation. Atmos. Res. 2021;250 doi: 10.1016/j.atmosres.2020.105400. [DOI] [Google Scholar]
- Kayalar O., Ari A., Babuccu G., Konyalilar N., Dogan O., Can F., Sahin U.A., Gaga E.O., Kuzu S.L., Ari P.E., Odabasi M., Tasdemir Y., Cindoruk S.S., Esen F., Sakin E., Caliskan B., Tecer L.H., Ficici M., Altin A., Onat B., Ayvaz C., Uzun B., Saral A., Dogeroglu T., Malkoc S., Uzmez O.O., Kunt F., Aydin S., Kara M., Yaman B., Dogan G., Olgun B., Dokumaci E.N., Gullu G., Uzunpinar E.S., Bayram H. Existence of SARS-CoV-2 RNA on ambient particulate matter samples: a nationwide study in Turkey. Sci. Total Environ. 2021;789 doi: 10.1016/j.scitotenv.2021.147976. [DOI] [PMC free article] [PubMed] [Google Scholar]
- Kesic M.J., Meyer M., Bauer R., Jaspers I. Exposure to ozone modulates human airway protease/antiprotease balance contributing to increased influenza an infection. PLoS One. 2012;7(4) doi: 10.1371/journal.pone.0035108. [DOI] [PMC free article] [PubMed] [Google Scholar]
- Kulkarni H., Khandait H., Narlawar U.W., Rathod P., Mamtani M. Independent association of meteorological characteristics with initial spread of COVID-19 in India. Sci. Total Environ. 2021;764 doi: 10.1016/j.scitotenv.2020.142801. [DOI] [PMC free article] [PubMed] [Google Scholar]
- Le T.H., Wang Y., Liu L., Yang J.N., Yung Y.L., Li G.H., Seinfeld J.H. Unexpected air pollution with marked emission reductions during the COVID-19 outbreak in China. Science. 2020;369(6504):702–+. doi: 10.1126/science.abb7431. 702-+ [DOI] [PMC free article] [PubMed] [Google Scholar]
- Lian X.B., Huang J.P., Huang R.J., Liu C.W., Wang L.N., Zhang T.H. Impact of city lockdown on the air quality of COVID-19-hit of Wuhan city. Sci. Total Environ. 2020;742 doi: 10.1016/j.scitotenv.2020.140556. [DOI] [PMC free article] [PubMed] [Google Scholar]
- Lin Y.C., Hsu S.C., Chou C.C.K., Zhang R.J., Wu Y.F., Kao S.J., Luo L., Huang C.H., Lin S.H., Huang Y.T. Wintertime haze deterioration in Beijing by industrial pollution deduced from trace metal fingerprints and enhanced health risk by heavy metals. Environ. Pollut. 2016;208:284–293. doi: 10.1016/j.envpol.2015.07.044. [DOI] [PubMed] [Google Scholar]
- Lin Y.C., Zhang Y.L., Xie F., Fan M.Y., Liu X.Y. Substantial decreases of light absorption, concentrations and relative contributions of fossil fuel to light-absorbing carbonaceous aerosols attributed to the COVID-19 lockdown in East China. Environ. Pollut. 2021;275 doi: 10.1016/j.envpol.2021.116615. [DOI] [PMC free article] [PubMed] [Google Scholar]
- Lolli S., Chen Y.C., Wang S.H., Vivone G. Impact of meteorological conditions and air pollution on COVID-19 pandemic transmission in Italy. Sci. Rep.-UK. 2020;10(1) doi: 10.1038/s41598-020-73197-8. [DOI] [PMC free article] [PubMed] [Google Scholar]
- Lopez-Feldman A., Heres D., Marquez-Padilla F. Air pollution exposure and COVID-19: a look at mortality in Mexico City using individual-level data. Sci. Total Environ. 2021;756 doi: 10.1016/j.scitotenv.2020.143929. [DOI] [PMC free article] [PubMed] [Google Scholar]
- Lowen A.C., Steel J. Roles of humidity and temperature in shaping influenza seasonality. J. Virol. 2014;88(14):7692–7695. doi: 10.1128/JVI.03544-13. [DOI] [PMC free article] [PubMed] [Google Scholar]
- Magnan R.E., Gibson L.P., Bryan A.D. Cognitive and affective risk beliefs and their association with protective health behavior in response to the novel health threat of COVID-19. J. Behav. Med. 2021;44(3):285–295. doi: 10.1007/s10865-021-00202-4. [DOI] [PMC free article] [PubMed] [Google Scholar]
- Mahmood T.B., Chowdhury A.S., Hossain M.U., Hasan M., Mizan S., Aakil M.M.U.I., Hossan M.I. Evaluation of the susceptibility and fatality of lung cancer patients towards the COVID-19 infection: a systemic approach through analyzing the ACE2, CXCL10 and their co-expressed genes. Curr. Res. Microb. Sci. 2021;2:100022. doi: 10.1016/j.crmicr.2021.100022. [DOI] [PMC free article] [PubMed] [Google Scholar]
- Maleki M., Anvari E., Hopke P.K., Noorimotlagh Z., Mirzaee S.A. An updated systematic review on the association between atmospheric particulate matter pollution and prevalence of SARS-CoV-2. Environ. Res. 2021;195 doi: 10.1016/j.envres.2021.110898. [DOI] [PMC free article] [PubMed] [Google Scholar]
- Manoj M.G., Satheesh Kumar M.K., Valsaraj K.T., Sivan C., Vijayan S.K. Potential link between compromised air quality and transmission of the novel corona virus (SARS-CoV-2) in affected areas. Environ. Res. 2020;190 doi: 10.1016/j.envres.2020.110001. [DOI] [PMC free article] [PubMed] [Google Scholar]
- Manojkumar N., Srimuruganandam B. Health benefits of achieving fine particulate matter standards in India - a nationwide assessment. Sci. Total Environ. 2021;763 doi: 10.1016/j.scitotenv.2020.142999. [DOI] [PubMed] [Google Scholar]
- Mehmood K., Bao Y.S., Abrar M.M., Petropoulos G.P., Saifullah, Soban A., Saud S., Khan Z.A., Khan S.M., Fahad S. Spatiotemporal variability of COVID-19 pandemic in relation to air pollution, climate and socioeconomic factors in Pakistan. Chemosphere. 2021;271 doi: 10.1016/j.chemosphere.2021.129584. [DOI] [PMC free article] [PubMed] [Google Scholar]
- Meng J.J., Li Z., Zhou R.W., Chen M., Li Y.Y., Yi Y.A., Ding Z.J., Li H.J., Yan L., Hou Z.F., Wang G.H. Enhanced photochemical formation of secondary organic aerosols during the COVID-19 lockdown in northern China. Sci. Total Environ. 2021;758 doi: 10.1016/j.scitotenv.2020.143709. [DOI] [PMC free article] [PubMed] [Google Scholar]
- Meo S.A., Abukhalaf A.A., Alomar A.A., Alessa O.M., Sami W., Klonoff D.C. Effect of environmental pollutants PM2.5, carbon monoxide, and ozone on the incidence and mortality of SARS-COV-2 infection in ten wildfire affected counties in California. Sci. Total Environ. 2021;757 doi: 10.1016/j.scitotenv.2020.143948. [DOI] [PMC free article] [PubMed] [Google Scholar]
- Milicevic O., Salom I., Rodic A., Markovic S., Tumbas M., Zigic D., Djordjevic M., Djordjevic M. PM2.5 as a major predictor of COVID-19 basic reproduction number in the USA. Environ. Res. 2021;201 doi: 10.1016/j.envres.2021.111526. [DOI] [PMC free article] [PubMed] [Google Scholar]
- Mor S., Kumar S., Singh T., Dogra S., Pandey V., Ravindra K. Impact of COVID-19 lockdown on air quality in Chandigarh, India: understanding the emission sources during controlled anthropogenic activities. Chemosphere. 2021;263 doi: 10.1016/j.chemosphere.2020.127978. [DOI] [PMC free article] [PubMed] [Google Scholar]
- Moreno T., Maria Pinto R., Bosch A., Moreno N., Alastuey A., Cruz Minguillon M., Anfruns-Estrada E., Guix S., Fuentes C., Buonanno G., Stabile L., Morawska L., Querol X. Tracing surface and airborne SARS-CoV-2 RNA inside public buses and subway trains. Environ. Int. 2021;147 doi: 10.1016/j.envint.2020.106326. [DOI] [PMC free article] [PubMed] [Google Scholar]
- NHC-China (National Health Commission of the People’s Republic of China), SATCM (State Administration of Traditional Chinese Medicine) The New Coronavirus pneumonia diagnosis and treatment plan (trial version fifth) Chin. J. Integr. Tradit. West. Med. 2020;40(02):136–138. [Google Scholar]
- Neto O.P., Kennedy D.M., Reis J.C., Wang Y., Brisola Brizzi A.C., Zambrano G.J., de Souza J.M., Pedroso W., de Mello Pedreiro R.C., Brizzi B.D.M., Abinader E.O., Zangaro R.A. Mathematical model of COVID-19 intervention scenarios for SAo Paulo-Brazil. Nat. Commun. 2021;12(1) doi: 10.1038/s41467-020-20687-y. [DOI] [PMC free article] [PubMed] [Google Scholar]
- Nguyen Thanh T., Cheng P.C., Chi K.H., Hsiao T.C., Jones T., BeruBe K., Ho K.F., Chuang H.C. Particulate matter and SARS-CoV-2: a possible model of COVID-19 transmission. Sci. Total Environ. 2021;750 doi: 10.1016/j.scitotenv.2020.141532. [DOI] [PMC free article] [PubMed] [Google Scholar]
- Nguyen T.P.M., Bui T.H., Nguyen M.K., Nguyen T.H., Vu V.T., Pham H.L. Impact of COVID-19 partial lockdown on PM2.5, SO2, NO2, O3, and trace elements in PM2.5 in Hanoi, Vietnam. Environ. Sci. Pollut. Res. 2021 doi: 10.1007/s11356-021-13792-y. [DOI] [PMC free article] [PubMed] [Google Scholar]
- Nirel R., Levy I., Adar S.D., Vakulenko-Lagun B., Peretz A., Golovner M., Dayan U. Concentration-response relationships between hourly particulate matter and ischemic events: a case-crossover analysis of effect modification by season and air-mass origin. Sci. Total Environ. 2021;760 doi: 10.1016/j.scitotenv.2020.143407. [DOI] [PubMed] [Google Scholar]
- Niu Z., Liu F., Yu H., Wu S., Xiang H. Association between exposure to ambient air pollution and hospital admission, incidence, and mortality of stroke: an updated systematic review and meta-analysis of more than 23 million participants. Environ. Health Prev. Med. 2021;26(1) doi: 10.1186/s12199-021-00937-1. [DOI] [PMC free article] [PubMed] [Google Scholar]
- Nor N.S.M., Yip C.W., Ibrahim N., Jaafar M.H., Rashid Z.Z., Mustafa N., Abd Hamid H.H., Chandru K., Latif M.T., Saw P.E., Lin C.Y., Alhasa K.M., Hashim J.H., Nadzir M.S.M. Particulate matter (PM2.5) as a potential SARS-CoV-2 carrier. Sci. Rep. 2021;11(1) doi: 10.1038/s41598-021-81935-9. [DOI] [PMC free article] [PubMed] [Google Scholar]
- Rahman M.S., Azad M.A.K., Hasanuzzaman M., Salam R., Islam A.R.M.T., Rahman M.M., Hoque M.M.M. How air quality and COVID-19 transmission change under different lockdown scenarios? A case from Dhaka city, Bangladesh. Sci. Total Environ. 2021;762 doi: 10.1016/j.scitotenv.2020.143161. [DOI] [PMC free article] [PubMed] [Google Scholar]
- SanJuan-Reyes S., Gomez-Olivan L.M., Islas-Flores H. COVID-19 in the environment. Chemosphere. 2021;263 doi: 10.1016/j.chemosphere.2020.127973. [DOI] [PMC free article] [PubMed] [Google Scholar]
- Sasidharan M., Singh A., Torbaghan M.E., Parlikad A.K. A vulnerability-based approach to human-mobility reduction for countering COVID-19 transmission in London while considering local air quality. Sci. Total Environ. 2020;741 doi: 10.1016/j.scitotenv.2020.140515. [DOI] [PMC free article] [PubMed] [Google Scholar]
- Seposo X., Ueda K., Sugata S., Yoshino A., Takami A. Short-term effects of air pollution on daily single- and co-morbidity cardiorespiratory outpatient visits. Sci. Total Environ. 2020;729 doi: 10.1016/j.scitotenv.2020.138934. [DOI] [PubMed] [Google Scholar]
- Sharma G.D., Bansal S., Yadav A., Jain M., Garg I. Meteorological factors, COVID-19 cases, and deaths in top 10 most affected countries: an econometric investigation. Sci. Pollut. Res. Int. 2021;28(22):28624–28639. doi: 10.1007/s11356-021-12668-5. [DOI] [PMC free article] [PubMed] [Google Scholar]
- Special Expert Group for Control of the Epidemic of Novel C, Pneumonia of the Chinese Preventive Medicine A An update on the epidemiological characteristics of novel coronavirus pneumonia (COVID-19) Chin. J. Epidemiol. 2020;41(2):139–144. doi: 10.3760/cma.j.issn.0254-6450.2020.02.002. [DOI] [PubMed] [Google Scholar]
- Sulaymon I.D., Zhang Y., Hopke P.K., Zhang Y., Hua J., Mei X. COVID-19 pandemic in Wuhan: ambient air quality and the relationships between criteria air pollutants and meteorological variables before, during, and after lockdown. Atmos. Res. 2021;250 doi: 10.1016/j.atmosres.2020.105362. [DOI] [PMC free article] [PubMed] [Google Scholar]
- Sun Y.L., Lei L., Zhou W., Chen C., He Y., Sun J.X., Li Z.J., Wang Q.Q., Ji D.S., Fu P.Q., Wang Z.F., Worsnop D.R. A chemical cocktail during the COVID-19 outbreak in Beijing, China: insights from six-year aerosol particle composition measurements during the chinese new year holiday. Sci. Total Environ. 2020;742 doi: 10.1016/j.scitotenv.2020.140739. [DOI] [PMC free article] [PubMed] [Google Scholar]
- Tian J., Wang Q.Y., Zhang Y., Yan M.Y., Liu H.K., Zhang N.N., Ran W.K., Cao J.J. Impacts of primary emissions and secondary aerosol formation on air pollution in an urban area of China during the COVID-19 lockdown. Environ. Int. 2021;150 doi: 10.1016/j.envint.2021.106426. [DOI] [PMC free article] [PubMed] [Google Scholar]
- Travaglio M., Yu Y., Popovic R., Selley L., Leal N.S., Martins L.M. Links between air pollution and COVID-19 in England. Environ. Pollut. 2021;268 doi: 10.1016/j.envpol.2020.115859. [DOI] [PMC free article] [PubMed] [Google Scholar]
- Verbeke T. Generalized additive models: an introduction with R. J. R. Stat. Soc. A. Stat. Soc. 2007;170:262. doi: 10.1111/j.1467-985X.2006.00455_15.x. [DOI] [Google Scholar]
- Wang Q., Li S.Y. Nonlinear impact of COVID-19 on pollutions - evidence from Wuhan, New York, Milan, Madrid, bandra, London, Tokyo and Mexico City. Sustain. Cities Soc. 2021;65 doi: 10.1016/j.scs.2020.102629. [DOI] [PMC free article] [PubMed] [Google Scholar]
- Wang B., Liu J.T., Li Y.L., Fu S.H., Xu X.C., Li L.Y., Zhou J., Liu X.R., He X.T., Yan J., Shi Y.J., Niu J.P., Yang Y., Li Y.Y., Luo B., Zhang K. Airborne particulate matter, population mobility and COVID-19: a multi-city study in China. BMC Public Health. 2020;20(1) doi: 10.1186/s12889-020-09669-3. [DOI] [PMC free article] [PubMed] [Google Scholar]
- Wang Z.L., Huang X., Ding K., Ren C.H., Cao L., Zhou D.R., Gao J., Ding A.J. Weakened aerosol-PBL interaction during COVID-19 lockdown in northern China. Geophys. Res. Lett. 2021;48(3) doi: 10.1029/2020GL090542. [DOI] [PMC free article] [PubMed] [Google Scholar]
- Xiao Y.H., Liu S.R., Tong F.C., Kuang Y.W., Chen B.F., Guo Y.D. Characteristics and sources of metals in TSP and PM2.5 in an urban Forest Park at Guangzhou. Atmosphere. 2014;5(4):775–787. [Google Scholar]
- Xu C.H., Chen J.M., Wang Z.K., Chen H., Feng H., Wang L.J., Xie Y.N., Wang Z.Z., Ye X.G., Kan H.D., Zhao Z.H., Mellouki A. Diverse bacterial populations of PM2.5 in urban and suburb Shanghai, China. Front. Environ. Sci. Eng. 2021;15(3) doi: 10.1007/s11783-020-1329-7. [DOI] [Google Scholar]
- Yao Y., Pan J., Wang W., Liu Z., Kan H., Qiu Y., Meng X., Wang W.B. Association of particulate matter pollution and case fatality rate of COVID-19 in 49 chinese cities. Sci. Total Environ. 2020;741 doi: 10.1016/j.scitotenv.2020.140396. [DOI] [PMC free article] [PubMed] [Google Scholar]
- Yap T.F., Liu Z., Shveda R.A., Preston D.J. A predictive model of the temperature-dependent inactivation of coronaviruses. Appl. Phys. Lett. 2020;117(6) doi: 10.1063/5.0020782. [DOI] [PMC free article] [PubMed] [Google Scholar]
- Yarahmadi R., Bokharaei-Salim F., Soleimani-Alyar S., Moridi P., Moradi-Moghaddam O., Niakan-Lahiji M., Darvishi M.M., Golmahammadi S., Mousavi S.A.J., Ebrahimi H., Ashtarinezad A., Farshad A.A., Jonidi-Jafari A., Kiani S.J., Garshasbi S., Mehrzadi S. Occupational exposure of health care personnel to SARS-CoV-2 particles in the intensive care unit of Tehran hospital. Int. J. Environ. Sci. Technol. 2021;18(12):3739–3746. doi: 10.1007/s13762-020-03095-z. [DOI] [PMC free article] [PubMed] [Google Scholar]
- Zheng H., Kong S.F., Chen N., Yan Y.Y., Liu D.T., Zhu B., Xu K., Cao W.X., Ding Q.Q., Lan B., Zhang Z.X., Zheng M.M., Fan Z.W., Cheng Y., Zheng S.R., Yao L.Q., Bai Y.Q., Zhao T.L., Qi S.H. Significant changes in the chemical compositions and sources of PM2.5 Wuhan since the city lockdown as COVID-19. Sci. Total Environ. 2020;739 doi: 10.1016/j.scitotenv.2020.140000. [DOI] [PMC free article] [PubMed] [Google Scholar]
- Zhu G.P., Zhu Y.H., Wang Z.L., Meng W.J., Wang X.X., Feng J.N., Li J., Xiao Y.F., Shi F.Y., Wang S.Z. The association between ambient temperature and mortality of the coronavirus disease 2019 (COVID-19) in Wuhan, China: a time-series analysis. BMC Public Health. 2021;21(1) doi: 10.1186/s12889-020-10131-7. [DOI] [PMC free article] [PubMed] [Google Scholar]
- Zhu W.T., Cai J.J., Hu Y.C., Zhang H.D., Han X., Zheng H.Q., Wu J. Long-term exposure to fine particulate matter relates with incident myocardial infarction (MI) risks and post-MI mortality: a metaanalysis. Chemosphere. 2021;267 doi: 10.1016/j.chemosphere.2020.128903. [DOI] [PubMed] [Google Scholar]
- Zhu X.L., Chen C., Zhang B., Ge Y.H., Wang W.D., Cai J., Kan H.D. Acute effects of personal exposure to fine particulate matter on salivary and urinary biomarkers of inflammation and oxidative stress in healthy adults. Chemosphere. 2021;272 doi: 10.1016/j.chemosphere.2021.129906. [DOI] [PubMed] [Google Scholar]
Associated Data
This section collects any data citations, data availability statements, or supplementary materials included in this article.
Supplementary Materials
Supplementary tables