

Abstract
The heat capacity, Cp, of synthetic hydroxyapatite [Ca5(PO4)3OH–OH-Ap], as well as of ten compositions along the OH-Ap-chlorapatite (Cl-Ap) join and 12 compositions along the OH-Ap-fluorapatite (F-Ap) join have been measured using relaxation calorimetry (heat capacity option of the Physical Properties Measurement System—PPMS) and differential scanning calorimetry (DSC) in the temperature range of 5–764 K. Apatites along the Cl-OH and F-OH joins were synthesized at 1100 °C and 300 MPa in an internally heated gas pressure vessel via an exchange process between synthetic fluorapatite or chlorapatite crystals (200–500 μm size) and a series of Ca(OH)2-H2O solutions with specific compositions and amounts relative to the starting apatite. The standard third-law entropy of OH-Ap, derived from the low-temperature heat capacity measurements, is S° = 386.3 ± 2.5 J mol−1 K−1, which is ~ 1% lower than that resulting from low-temperature adiabatic calorimetry data on OH-Ap from the 1950’s. The heat capacity of OH-Ap above 298.15 K shows a hump-shaped anomaly centred around 442 K. Based on published structural and calorimetric work, this feature is interpreted to result from a monoclinic to hexagonal phase transition. Super ambient Cp up to this transition can be represented by the polynomial: . The DSC data above this transition were combined with heat capacities computed using density functional theory and can be given by the Cp polynomial: . Positive excess heat capacities of mixing, ∆Cpex, in the order of 1–2 J mol−1 K−1, occur in both solid solutions at around 70 K. They are significant at these conditions exceeding the 2σ-uncertainty of the data. This positive ∆Cpex is compensated by a negative ∆Cpex of the same order at around 250 K in both binaries. At higher temperatures (up to 1200 K), ∆Cpex is zero within error for all solid solution members. As a consequence, the calorimetric entropies, Scal, show no deviation from ideal mixing behaviour within a 2σ-uncertainty for both joins. Excess entropies of mixing, ∆Sex, are thus zero for the OH-Ap–F-Ap, as well as for the OH-Ap–Cl-Ap join. The Cp–T behaviour of the OH-Ap endmember is discussed in relation to that of the F- and Cl-endmembers.
Supplementary Information
The online version contains supplementary material available at 10.1007/s00269-021-01167-1.
Keywords: Heat capacity, Excess entropy, Hydroxyapatite-fluorapatite binary, Hydroxyapatite-chlorapatite binary, Mixing properties, Standard third-law entropy
Introduction
Apatite [Ca10(PO4)6(F,Cl,OH)2] is the most common and widespread phosphate mineral in the Earth’s crust and lithospheric mantle. In its most common form as fluorapatite [Ca10(PO4)6F2], it also is a major mineralogical sink for F and to a lesser extent Cl. As a member of the apatite supergroup, apatite can incorporate a wide range of elements into its structure, some of the more important being C (as CO3), Na, S (as SO4), Si, Fe, Pb, REE, Th, and U (Hughes and Rakovan 2015). As a major host for F, Cl, and OH, apatite in equilibrium with another major halogen carrier, biotite, can be used as a halogen exchange thermometer (Zhu and Sverjensky 1992; Sallet 2000). It can also be used as a F, Cl, and OH barometer in equilibrium with a fluid (Zhu and Sverjensky 1991). Hence, there is an underlying importance in understanding the thermodynamics of F, Cl, and OH mixing on the halogen site in apatite. To this end an earlier study measuring the Cp with regard to F-Cl mixing on the halogen site over a broad temperature range has been done by Dachs et al. (2010a). These authors found that F-Cl mixing does not deviate significantly from ideality within a 2σ uncertainty (calorimetric work extant on fluorapatite and chlorapatite endmembers is discussed in that paper and will not be repeated here). This current study continues and completes this earlier study by measuring Cp with the aim to constrain F-OH and Cl-OH mixing on the halogen site. While no heat capacity data exist for these joins so far, Cp of synthetic hydroxyapatite has been measured by Egan et al. (1951a) below room temperature down to 13 K, and by Palkin et al. (1991) in the range 55–300 K. Above ambient T, Egan et al. (1950) provided heat-content data for this endmember up to 1500 K and Suda et al. (1995) measured Cp of OH-Ap between 440 and 500 K using DSC techniques. The latter authors demonstrated calorimetrically that there is a structural monoclinic to hexagonal phase transition at around 480 K in this phase as already proposed by van Rees et al. (1973) from birefringence measurements on heated synthetic single OH-Ap crystals.
Experimental method
Sample synthesis and characterization
Synthesis of apatites along the F-OH and Cl-OH joins was carried out using synthetic endmember fluorapatite and chlorapatite crystals in the 200–500 micron size range. The fluorapatite and chlorapatite crystals were synthesized according to the technique laid out in Schettler et al. (2010).
The synthesis technique used here consisted of placing 400 mg of either fluorapatite or chlorapatite crystals plus varying amounts of Ca(OH)2 + H2O in a 5 mm diameter, 4 cm long Pt tube. Once loaded, the Pt tube was arc-welded shut, left up over night in a 100 °C oven to check the seals, and then taken up to 1000 or 1100 °C and 400 MPa in an internally heated gas pressure vessel using Ar as the pressure medium. The synthesis runs were left up from 3 to 6 days. The temperature was measured with 3 S-type thermocouples and calibrated based on measurements of the melting points of NaCl at 843 °C/200 MPa and 904 °C/500 MPa (Akella et al. 1969). The accuracy of the temperature is about ± 5 °C at 200 MPa and ± 20 °C at 500 MPa. Maximum thermal gradients along the capsules were ± 10 °C. Pressure measurement was done with a strain gauge and is accurate to ± 7 MPa for experiments up to 500 MPa. During the experiment, pressure was controlled automatically within ± 5 MPa using the hydraulic system of the intensifier and a programmable control unit. The samples were heated isobarically with a rate of 30 °C min− 1 and quenched isobarically with quench rates of 150–200 °C min− 1.
During the experimental run the following exchange reactions (not balanced) took place between the fluorapatite or chlorapatite crystals and the Ca(OH)2-H2O solution via a coupled dissolution-reprecipitation reaction (see Putnis 2009):
and
After quench, the Pt capsule was opened and the contents washed 3 or 4 times in nano-pure distilled H2O to remove any excess Ca(OH)2 or resulting HCl, HF, CaCl2, or CaF2. The composition of the resulting F-OH apatite or Cl-OH apatite was determined via single crystal XRD of several randomly selected crystals from each of the synthesis runs (cf. Hughes et al. 2016, 2018). Since OH cannot be directly measured by electron microprobe analysis but rather must be calculated via charge balance based on relatively approximate electron microprobe analytical measurements of F or Cl on the halogen site, single crystal XRD was considered the most accurate way of determining the OH vs. F or OH vs. Cl content for each of the apatite syntheses. Wet chemical analysis was also not considered due to the limited amount of each synthesis produced (< 400 mg) and the fact that other portions of each synthesis were being utilized for other purposes such that there was not enough material left over for an accurate wet chemical analysis.
The hydroxylapatite (APS-88) was synthesized by placing 400 mg of commercial hydroxylapatite (SIGMA calcium phosphate tribasic, Batch # 012K1603) plus 100 mg H2O in a 5 mm diameter, 4 cm long Pt tube, which was arc-welded shut, and then taken up to 1100 °C and 400 MPa for 72 h in the internally heated gas pressure apparatus utilizing the same technique as outlined above.
Powder-XRD patterns on OH-Ap were measured with a Bruker D8 Advance X-ray diffractometer and used to derive the lattice parameters of synthetic OH-Ap with the programme UnitCell (Holland and Redfern 1997).
Calorimetric methods
Low-temperature heat capacities were measured with a commercially designed relaxation calorimeter (heat capacity option of the Physical Properties Measurement System (PPMS), constructed by Quantum Design®) at Salzburg University. The data were collected three times at 60 different temperatures between 5 and 300 K on samples weighing between 10 and 15 mg (the mean of the three measurements per temperature step is given in supplementary Table S1). For measurement, the sample powders were wrapped in thin Al-foil and pressed to a flat pellet that was then placed on the sample-platform of the calorimeter. A measure of the quality of the thermal conductance between the sample and the sample-platform during a PPMS measurement is the so called sample-coupling. The closer this value is to 100%, the more reliable is the measured heat capacity value. Bad sample couplings, on the other hand, may indicate underestimated Cp’s (see e.g., Dachs and Bertoldi 2005, or Dachs et al. 2010a, for more details. More details on the calorimetric technique, as well on its precision and accuracy can be found in Lashley et al. (2003), Dachs and Bertoldi (2005), or Dachs and Benisek (2011) and will not be repeated here.
Heat capacities between T = 282 and 764 K were collected with a Perkin Elmer Diamond differential scanning calorimeter® (DSC). The measurements were performed under a flow of Ar gas and with the calorimeter block kept at T = 243.3 K using a Perkin Elmer Intracooler. The heat flow data were collected in temperature intervals of 50 K. Each interval consisted of a temperature scan using a heating rate of 10 K min− 1 and isothermal periods 2 min before and after the temperature scan. Each complete measurement included three runs: a blank run, a reference run, and a sample run. Before each sample run, the DSC was calibrated with a reference run using a synthetic single crystal of corundum whose heat capacities were taken from the National Bureau of Standards Certificate (Ditmars et al. 1982). DSC measurements were repeated 3–4 times. The resulting mean and standard deviation of Cp for a sample are given in Supplementary Table S1. More details on the DSC method applied can be found in Dachs and Benisek (2011).
Evaluation of the calorimetric data
We have adopted the fitting equation of Boerio-Goates et al. (2002) to fit the PPMS Cp data of OH-Ap (corresponding Mathematica code is available upon request from the first author):
| 1 |
where D(ΘD), E(ΘE), and S(ΘS) are Debye, Einstein, and Schottky functions, respectively, defined as:
| 2 |
| 3 |
| 4 |
and m, n, s, ΘD, ΘE, and ΘS are adjustable parameters (ΘD, ΘE, and ΘS are the Debye, Einstein and Schottky temperatures, respectively; m, n, and s are weighting factors that also model the Cp − Cv difference). An optimal representation of the CP-T data occurred when the data were split into a low and high-temperature segment. Accordingly, two sets of fitting coefficients were obtained using the software Mathematica® (Table 1). The high-temperature CP data of OH-Ap were fitted to a polynomial of the form:
| 5 |
as proposed by Berman and Brown (1985).
Table 1.
Parameters of Eq. (1), used to calculate smoothed values of the heat capacities of OH-, Cl- and F-apatite endmembers at temperatures between 0 and 298.15 K
| Apatite endmember | T range [K] | θD [K] | M [mol] | θE [K] | n [mol] | θS [K] | s [mol] |
|---|---|---|---|---|---|---|---|
| OH-Ap | < 38.86 | 521.511 | 23.541 | 172.731 | 1.113 | 102.137 | 0.443 |
| 38.86–298.15 | 482.187 | 13.814 | 1046.084 | 7.517 | 167.088 | 2.675 | |
| Cl-Ap | < 35.44 | 293.848 | 7.219 | 104.261 | 0.561 | 24.677 | 0.004 |
| 35.44–298.15 | 430.910 | 13.230 | 1012.226 | 7.067 | 142.943 | 2.250 | |
| F-Ap | < 37.98 | 352.180 | 8.701 | 132.378 | 0.872 | 64.644 | 0.076 |
| 37.98–298.15 | 490.207 | 14.252 | 1209.184 | 7.214 | 163.487 | 2.764 |
The parameter values for OH-Ap are from this study, those for Cl- and F-Ap from Dachs et al. (2010a)
Compared to the endmember OH-Ap, the PPMS and DSC data measured on the solid solution apatites were treated differently, using the Mathematica function® Interpolation to represent their heat capacities as function of temperature.
The calorimetric molar entropies at 298.15 K, S298, were calculated by solving the integral in Eq. (6) using the Mathematica® function NIntegrate (assuming ST=0 K = 0) and either Eq. (1), in the case of OH-Ap, or Interpolation for calculating CP:
| 6 |
Scal corresponds to the standard-state (third-law) entropy, So, in the case of endmember OH-Ap. Errors in Scal were estimated according to Dachs and Benisek (2011). Due to the low absolute values of Cp below 5 K, the entropy increment from 0 to 5 K is < 0.02 J mol−1 K−1 and could be neglected in the determination of Scal.
Computational methods using density functional theory (DFT)
Quantum–mechanical calculations were based on the DFT plane-wave pseudopotential approach implemented in the CASTEP code (Clark et al. 2005) included in the Materials Studio software from Biovia®. The calculations used the local density approximation (LDA) for the exchange–correlation functional (Ceperley and Alder 1980). To describe the core-valence interactions, norm-conserving pseudopotentials were used with the 1s1, 2s22p4, 3s23p3, and 3s23p64s2 electrons explicitly treated as valence electrons for H, O, P, and Ca, respectively. The k-point sampling used a Monkhorst–Pack grid (Monkhorst and Pack 1976) with a spacing of 0.06 Å−1. The structural relaxation was calculated by applying the BFGS algorithm (Pfrommer et al. 1997), where the maximum force on the atom was within 0.01 eV/Å. On such relaxed structures, lattice dynamical calculations were performed using the linear response approximation. The transformation of CASTEP heat capacities at constant volume into heat capacities at constant pressure was done as outlined in Benisek and Dachs (2018).
Constructing a structural model for OH apatite for the quantum–mechanical calculation is not straightforward because of the disorder of the OH group. The F atom in apatite is positioned at the special crystallographic position (0, 0, ¼). However this is not the case with the OH group. In the real crystal, OH is disordered above and below this special position (Hughes et al. 1989). Strictly speaking, the mirror plane at ¼ is destroyed. Phonon calculations of a cell, which reflects such disorder, are highly time consuming and were not performed here. For the sake of simplicity, we put the centre of the oxygen and hydrogen at (0, 0, ¼) having a distance of ca. 1 Å between them and let the geometry relaxation find their end-positions. Such a model does not reflect reality and may cause errors in the calculated heat capacities, especially at low temperatures. However, we used the calculated heat capacities only for extrapolation purposes at high temperatures, where such details should not cause significant errors. CASTEP input and output files for our DFT calculation on OH-Ap are available upon request.
Results
The sample couplings in the PPMS measurements ranged between 99.0–99.4% around room temperature, increased with falling temperature to a maximum between 99.5% and 99.8% around 150 K, and then decreased to values between 95 and 98% at the lowest temperatures. These sample-coupling values indicate good Cp determinations via the PPMS.
The agreements between PPMS-measured and DSC-measured heat capacity at room temperature were better than ± 0.6% in most cases (with one exception where the difference was 1.2%).
Heat capacity and standard entropy of hydroxyapatite
The XRD pattern obtained on OH-Ap (sample APS-88) showed only reflections that could be attributed to this phase, no extra peaks steming from possible impurities were detected. Using a hexagonal cell, the lattice constants are ao = 9.4195(4) Å and co = 6.8865(6) and the cell volume is 529.16(6) Å3. This agrees reasonably well with the values determined e.g. by Suda et al. (1995), i.e., ao = 9.4187(5) Å and co = 6.8805(2) Å, or lattice parameters cited in Tacker and Stormer (1989) for OH-Ap, i.e., ao = 9.422 Å and co = 6.883 Å.
The PPMS- and DSC-measured heat capacities of OH-Ap are shown in Fig. 1 as a function of temperature. The PPMS data from the range 100–300 K are continuously ~ 1% smaller than the Cp data reported by Egan et al. (1951a) (Fig. 2), measured on 62 g synthetic hydroxyapatite using low-temperature adiabatic calorimetry (low-TAC). Below 100 K deviations are larger by up to ~ 6% in positive and negative direction, indicating some scatter in these low-temperature literature data (Fig. 2). Compared to the low-TAC Cp data of Palkin et al. (1991), there is good agreement to the PPMS data in the range 60 to ~ 200 K. At higher T’s up to room temperature, these data tend to be 1–2% smaller than PPMS-measured ones. The red dots in Fig. 1 are the heat capacity values at constant volume, Cv, computed with CASTEP. The heat capacity difference Cv − Cp, normalised to Cp is shown in Fig. 3. As expected, the difference Cp − Cv gets larger with rising temperature (Fig. 1), whereas (Cp − Cv)/Cp approaches a linear relationship above ca. 200 K given by:
| 7 |
Fig. 1.
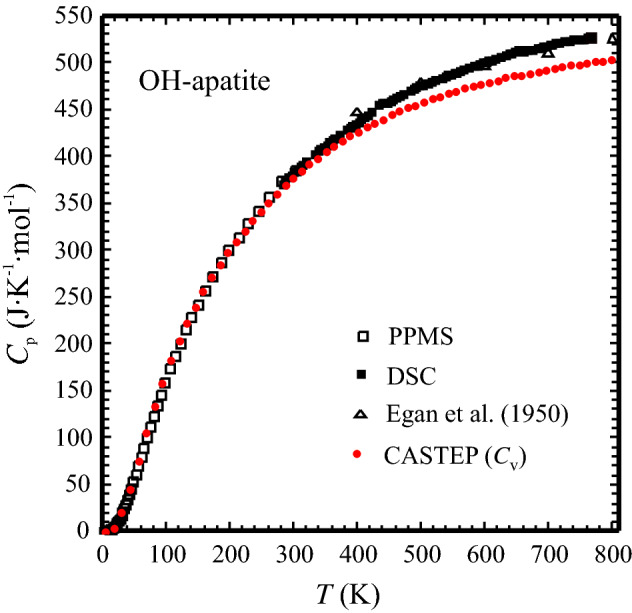
Heat capacity of synthetic hydroxyapatite as function of temperature. Open squares: PPMS data, filled squares: DSC data. The drop-(solution) calorimetry data of Egan et al. (1950) are shown as open triangles. The low-TAC data of Egan et al. (1951a) and Palkin et al. (1991) are not plotted to avoid symbol overlap, but their deviation to the PPMS data is shown in Fig. 2. Red dots are heat capacities at constant volume, Cv, of hydroxyapatite, computed with density functional methods (CASTEP). Error bars are smaller than the symbol size
Fig. 2.

Deviation of the low-TAC data of Egan et al. (1951a, open squares) and Palkin et al. (1991, filled squares) from the PPMS data of OH-Ap from this study. Deviation is computed as 100 (Cpliterature—CpPPMS)/CpPPMS
Fig. 3.

Plot of the normalised difference (Cp − Cv)/Cp for OH-Ap as function of temperature. Above ca. 200 K there is a linear relationsship (Eq. 7), that was used to extrapolate heat capacities beyond 760 K (dashed line)
Following Benisek and Dachs (2018), we have used Eq. (7) to extrapolate heat capacities beyond the experimental range (760 K) based on Cv that was computed up to nearly 1300 K. This set of data, our DSC data, as well as literature Cp data are shown in Fig. 4a. The range of the structural phase transition related to OH ordering/disordering in OH-Ap is enlarged in Fig. 4b. A broad hump-shaped heat capacity anomaly in our DSC data, centred at around 442 K, is visible in this plot as a likely result of this transition. Suda et al. (1995) observed a sharper Cp peak at a higher temperature of ~ 485 K (Fig. 4b) and estimated transition enthalpy and entropy values of 630 ± 25 J mol−1 and 1.30 ± 0.05 J mol−1 K−1, respectively. Due to this Cp anomaly, we split our DSC data into two segments cutting out the region of the transition before fitting. The low-T segment (298–442 K) is given by:
| 8 |
the high-T segment (T > 442 K) by:
| 9 |
Fig. 4.

High-temperature heat capacity of OH-Ap in the temperature range a 300–1500 K and b 390–520 K. Open squares: DSC data, Filled triangles: Extrapolated Cp, based on CASTEP-computed Cv and normalised (Cp − Cv)/Cp as given by Eq. (7). Open triangles: Egan et al. (1951a), blue dots: Suda et al. (1995). Red curve is the Cp polynomial of Eqs. (8 and 9). Error bars are smaller than the symbol size
Equations (8, 9) reproduce the experimental (and computed) Cp data of OH-Ap to within a mean deviation of 0.21 ± 0.16% (Fig. 4a, b, red curve). The value of Cp for OH-Ap, as derived by Egan et al. (1950) from heat-content measurements, is larger by 1–2% at room temperature up to ca. 550 K. Above that temperature, the Egan’s et al. Cp data are lower by 1.5% at maximum compared to that from this study (Fig. 4b, open triangles). Above ~ 1100 K, Eq. (9) predicts heat capacities that agree to better than 0.5% with the data of Egan et al. (1950).
Fitting the PPMS-measured Cp data on OH-Ap to Eq. (1), gives the parameters summarised in Table 1 (those for the Cl- and F-apatite endmembers are also given, as derived by Dachs et al. (2010a). Using Eq. (6), So of OH-Ap is then computed as So = 386.3 ± 2.5 J mol−1 K−1.
Excess heat capacity and entropy of mixing along the hydroxyapatite-chlorapatite and the hydroxyapatite-fluorapatite joins
The excess heat capacity of mixing, ∆Cpex, was computed according to:
| 10 |
in the case of the OH-Ap–Cl-Ap binary join and
| 11 |
for the OH-Ap–F-Ap binary join. ∆Cpex, as function of temperature, is plotted in Fig. 5a, b for one representative member of each join. Similar to the Cl-Ap–F-Ap join (Dachs et al. 2010a), positive excess heat capacities related to OH-Cl and OH-F mixing in apatite occur at around 70 K in both binaries studied herein. Taking a 2σ-uncertainty into account, these are significant and larger for OH-Cl apatites amounting to 1.5–2.0 J mol−1 K−1 compared to ~ 1.0 J mol−1 K−1 for OH-F apatites. This feature of a positive ∆Cpex at ~ 70 K is common in all samples and may be preceded by a small region of negative ∆Cpex at 50 K in some samples (e.g., Fig. 5b). In the temperature range around 250 K, excess heat capacities tend to be generally somewhat negative (2–3 J mol−1 K−1), thus compensating for the positive ones at 70 K. At all other temperatures (including those above room temperature up to highest ones), ∆Cpex is zero within a 2σ-uncertainty. Figure 6 shows ∆Cpex as function of composition at temperature sections of 70 and 250 K, illustrating the ∆Cpex behaviour as discussed above.
Fig. 5.
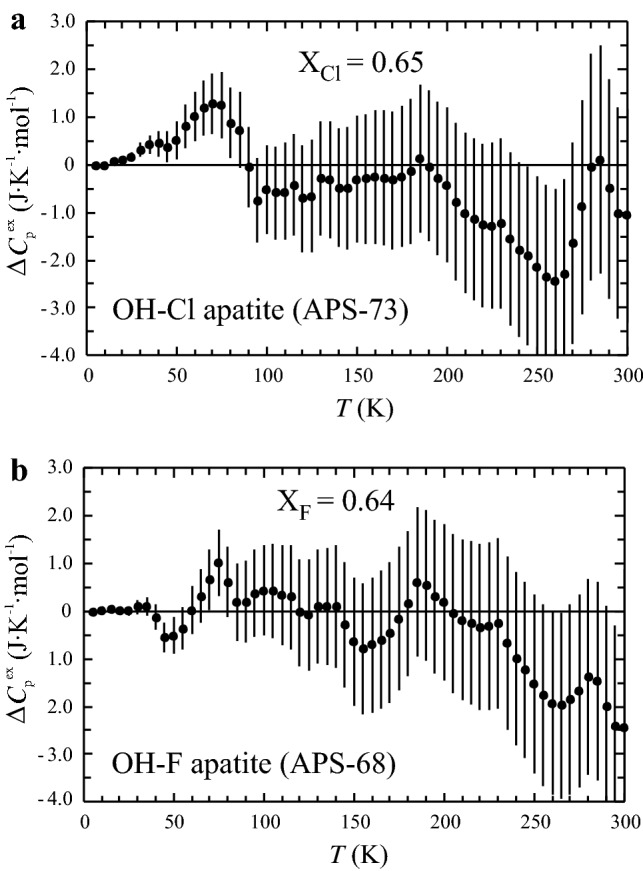
Excess heat capacity of mixing, ∆Cpex, as function of temperature for a APS-73 (XCl = 0.65) and b APS-68 (XF = 0.67). Error bars represent ± 2σ
Fig. 6.

Excess heat capacity of mixing, ∆Cpex, for a OH-Cl apatites and b OH-F apatites at temperature sections of 70 and 250 K. Error bars represent ± 2σ
A plot of Scal at 298.15 K for OH-Cl and OH-F apatites (Table 2), as a function of composition, indicates linear behaviour within error (Fig. 7). There are thus no excess entropies of mixing in these solid solution apatites.
Table 2.
Calorimetric entropy, Scal, at 298.15 K of members of the OH-F and OH-Cl apatite binaries
| OH-F apatite | XF | Scal J mol−1 K−1 | OH-Cl apatite | XCl | Scal J mol−1 K−1 |
|---|---|---|---|---|---|
| OH–Ap | 0.000 | 386.3 | OH-Ap | 0.000 | 386.3 |
| APS92 | 0.298 | 384.0 | APS94 | 0.150 | 390.4 |
| APS91 | 0.390 | 384.8 | APS93 | 0.185 | 390.8 |
| APS77 | 0.400 | 384.0 | APS80 | 0.352 | 391.9 |
| APS70 | 0.440 | 383.6 | APS71 | 0.497 | 393.4 |
| APS85 | 0.440 | 385.7 | APS74 | 0.538 | 394.3 |
| APS69 | 0.470 | 383.8 | APS73 | 0.645 | 395.5 |
| APS84 | 0.570 | 383.3 | APS72 | 0.735 | 396.1 |
| APS86 | 0.610 | 384.1 | APS78 | 0.817 | 399.6 |
| APS68 | 0.639 | 383.9 | APS82 | 0.814 | 399.9 |
| APS87 | 0.670 | 384.2 | APS83 | 0.871 | 399.0 |
| APS95 | 0.718 | 384.2 | |||
| APS96 | 0.759 | 384.6 | |||
| F-Ap | 0.999 | 383.2 | Cl-Ap | 0.998 | 400.6 |
XF and XCl are calculated as F/(F + OH) and Cl/(Cl + OH), respectively. Data are plotted in Fig. 7. The 1σ-uncertainty of the Scal data is ± 2.5 J mol−1 K−1
Fig. 7.
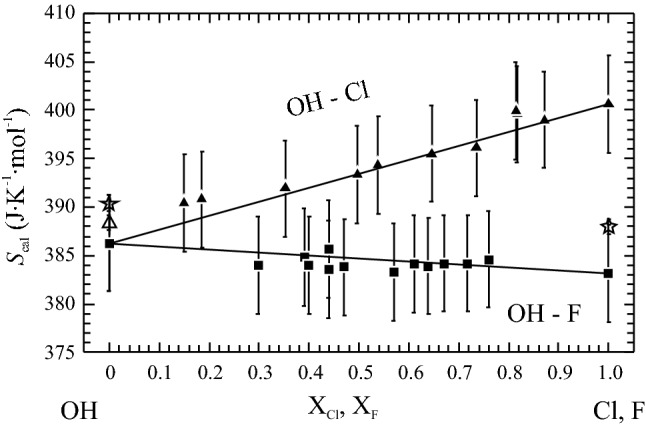
Calorimetric entropies, Scal, at T = 298.15 K as function of composition for the OH-Ap–Cl-Ap binary (filled triangles) and the OH-Ap–F-Ap binary (filled squares). Data are from Table 2. Straight lines indicate ideal mixing behaviour. Open stars are So of the OH- and F-Ap endmembers according to Egan et al. (1951a; b), open triangle is So of OH-Ap reported in Palkin et al. (1991). Error bars represent ± 2σ
Discussion
Surprisingly, even though OH-Ap is probably the most important apatite end member (at least in the biosciences), there are only the two studies from Egan et al. (1951a) and Palkin et al. (1991) that provide low-T heat capacity data on OH-Ap. From our PPMS data we derived So = 386.3 ± 2.5 J mol−1 K−1 for this phase, whereas Egan et al. (1951a) computed So = 390.4 ± 0.4 J mol−1 K−1 from their low-TAC data. The PPMS-derived So for OH-Ap in this study, in combination with Scal along the OH-Cl and OH-F apatite binaries (Table 2) and So for Cl- and F apatite from Dachs et al. (2010a), gives a consistent picture of an ideal OH-Cl and an ideal OH-F mixing behaviour for these binaries as was the case for the Cl-F binary. This may be taken as an indication that the value SoOH-Ap = 386.3 ± 2.5 J mol−1 K−1 from this study should be reliable. Egan et al. (1951a) used 62 g from two samples in their low-TAC measurements that were synthesized using an acidimetric precipitation method. In one sample (Hy-43) two weak lines corresponding to the two strongest lines of Cl-Ap were found in the XRD pattern of this OH-Ap. In the synthesis routine of the other sample (XP-12), a Cl-bearing substance, namely ammonium chloride was definitely added to promote crystal growth. The ~ 1% larger entropy value of OH-Ap reported by Egan et al. (1951a) could thus be explained by supposing that some Cl might have replaced OH in their ‘OH-apatite’. Based on Fig. 7, ~ 20% Cl substituting for OH would suffice to increase the entropy of such an OH-Cl apatite to the value measured by Egan et al. (1951a). Palkin et al. (1991), on the other hand, report a So of 388.4 ± 1.6 J mol−1 K−1 for OH-Ap which agrees within error with that from this study (Fig. 7).
We interpret the hump-shaped heat capacity anomaly that we observe in our DSC data of OH-Ap (APS-88) around 442 K to be caused by the monoclinic to hexagonal phase transition related to OH ordering/disordering (van Rees et al. 1973; Suda et al. 1995). Suda et al. reported a sharper Cp anomaly at a higher temperature of ~ 485 K. The reason for this discrepancy is not clear but may have to do with the concentration of vacancies on hydroxyl sites in the OH-Ap. Kijima and Tsutsumi (1979) sintered solution grown crystals of hydroxyapatite at temperatures between 1050 °C and 1450 °C to dense polycrystalline bodies. They used a Laser flash method to measure heat capacity, thermal diffusivity and conductivity of these aggregates, but did not observe any Cp anomalies. As they note, the sintering process is accompanied by the formation of vacancies due to thermal dehydration so that their samples were oxyhydroxyapatites lacking OH-groups in their structure. Because the OH-Ap studied herein (APS-88) was crystallised in excess of H2O at 400 MPa/1000 °C (72 h) in a sealed Pt capsule, hydroxyl-site vacancies should play an only minor role if any in the OH-Ap from this study. We have, however, no reasonable explanation why the Cp anomaly measured in our hydroxapatite occurs at a lower temperature and is not as sharp as observed by Suda et al. (1995) in their synthetic OH-Ap sample.
The heat capacity behaviour of the three apatite endmembers, OH-Ap, Cl-Ap and F-Ap is shown from 0 to 1000 K in Fig. 8. As a function of temperature, the Cp curves of Cl- and F-Ap run continuously subparallel. The lattice vibrational behaviour of these two endmembers is thus quite similar and the 5–10 J mol−1 K−1 larger heat capacity of Cl-Ap is simply a mass effect, with the atomic mass of Cl being roughly double that of F. In contrast, the Cp curve of OH-Ap, is the lowest at T < 100 K, intersects both other curves between ca. 100 and 200 K, and then remains the highest curve with increasing temperature. At T = 1000 K, the difference to the Cp curves of the two other endmembers is 25–30 J mol−1 K−1. As discussed in Dachs et al. (2010b), similar heat capacity behaviours, i.e., CpOH−endmember < CpF−endmember at low T and vice versa at high T, with a crossover between 50 and 180 K, were observed for OH/F-pargasite, OH/F-phlogopite, and Mg(OH)2/MgF2. These authors gave the following lattice dynamic interpretation for that. Namely, since the bonds of the octahedral cations with oxygen are stronger than the corresponding ones with F, the frequencies of the cation-O vibrations in the OH-endmember will be higher than in the F or Cl counterpart, causing the observed heat capacity behaviour at low temperatures (lower Cp of the OH-endmember compared to the F- or Cl-endmember). The OH group, however, has additional vibrational degrees of freedom (e.g., OH-liberation modes in the range 600–800 cm−1, Freund and Knobel 1977; Rintoul et al. 2007), that become increasingly excited with rising T, providing a contribution to Cp of the OH-endmember that is missing in the F- or Cl-endmember. As a result, CpOH−endmember becomes larger at some intermediate temperature than CpF(or Cl−)endmember.
Fig. 8.
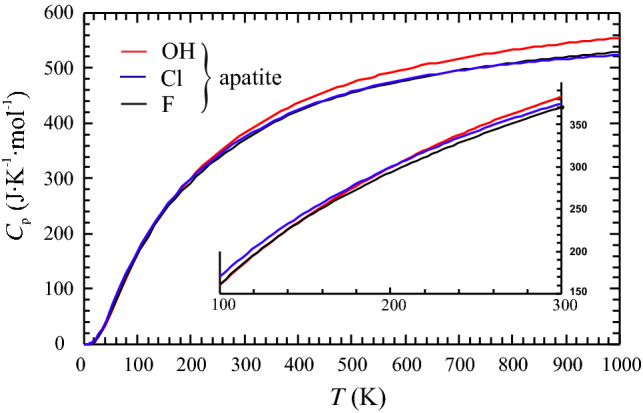
Heat capacity of the OH-, Cl- and F-endmembers as function of temperature between 0 and 1000 K. Cp of OH-Ap (red) was computed according to this study (Table 1, Eqs. 8, 9), Cp of Cl- and F-Ap (blue and black curves) following Dachs et al. (2010a). See text for further discussion
The extrapolation of the heat capacity from OH-Ap, beyond the experimental range (760 K) based on the CASTEP-computed Cv and linear extrapolation of the normalised difference (Cp − Cv)/Cp, as given in Eq. (7), yields values that are in good agreement with the Cp derived by Egan et al. (1950) from heat-content measurements above 1000 K (Fig. 4). This confirms that the Cp polynomial for OH-Ap in this study (Eq. 9) can be used reliably up to 1500 K to compute the heat capacity of OH-Ap.
In both apatite joins studied herein, there are small but significant positive excess heat capacities of mixing at low T around 70 K. These are compensated by slightly negative ones at around 250 K, so that, similar to the situation found for the Cl-F apatites (Dachs et al. 2010a), there is ideal entropic OH-Cl and OH-F mixing behaviour in apatite at 298.15 K.
Supplementary Information
Below is the link to the electronic supplementary material.
Acknowledgements
This work was financed by the Austrian Science Fund project number P28724, which is gratefully acknowledged. We thank J.C. Ayers and an anonymous reviewer for their comments on the paper.
Funding
Open access funding provided by Paris Lodron University of Salzburg. This work was financed by the Austrian Science Fund project number P28724.
Availability of data and material
All calorimetric data are given in Supplementary Table 1, other data in Tables 1 and 2.
Code availability
Not applicable.
Declarations
Conflict of interest
Not applicable.
Footnotes
Publisher's Note
Springer Nature remains neutral with regard to jurisdictional claims in published maps and institutional affiliations.
References
- Akella J, Vaidya SN, Kennedy GC. Melting of sodium chloride at pressures to 65 kbar. Phys Rev. 1969;185:1135–1140. doi: 10.1103/PhysRev.185.1135. [DOI] [Google Scholar]
- Benisek A, Dachs E. The accuracy of standard enthalpies and entropies for phases of petrological interest derived from density-functional calculations. Contrib Mineral Petrol. 2018;173:90. doi: 10.1007/s00410-018-1514-x. [DOI] [PMC free article] [PubMed] [Google Scholar]
- Berman RG, Brown TH. Heat capacity of minerals in the system Na2O-K2O-CaO-MgO-FeO-Fe2O3-Al2O3-SiO2-TiO2-H2O-CO2: representation, estimation, and high temperature extrapolation. Contrib Mineral Petrol. 1985;89:168–183. doi: 10.1007/BF00379451. [DOI] [Google Scholar]
- Boerio-Goates J, Stevens R, Hom BK, Woodfield BF, Piccione PM, Davis ME, Navrotsky A. Heat capacities, third-law entropies and thermodynamic functions of SiO2 molecular sieves from T = 0 K to 400 K. J Chem Therm. 2002;34:205–227. doi: 10.1006/jcht.2001.0900. [DOI] [Google Scholar]
- Ceperley DM, Alder BJ. Ground state of the electron gas by a stochastic method. Phys Rev Lett. 1980;45:566–569. doi: 10.1103/PhysRevLett.45.566. [DOI] [Google Scholar]
- Clark SJ, Segall MD, Pickard CJ, Hasnip PJ, Probert MIJ, Refson K, Payne MC. First principles methods using CASTEP. Z Kristallogr. 2005;220:567–570. doi: 10.1524/zkri.220.5.567.65075. [DOI] [Google Scholar]
- Dachs E, Benisek A. A sample-saving method for heat capacity measurements on powders using relaxation calorimetry. Cryogenics. 2011;51:460–464. doi: 10.1016/j.cryogenics.2011.04.011. [DOI] [PMC free article] [PubMed] [Google Scholar]
- Dachs E, Bertoldi C. Precision and accuracy of the heat-pulse calorimetric technique: low-temperature heat capacities of milligram-sized synthetic mineral samples. Eur J Mineral. 2005;17:251–261. doi: 10.1127/0935-1221/2005/0017-0251. [DOI] [Google Scholar]
- Dachs E, Harlov D, Benisek A. Excess heat capacity and entropy of mixing along the chlorapatite-fluorapatite binary join. Phys Chem Minerals. 2010;37:665–676. doi: 10.1007/s00269-010-0366-3. [DOI] [PMC free article] [PubMed] [Google Scholar]
- Dachs E, Baumgartner IA, Bertoldi C, Benisek A, Tippelt G, Maresch W. Heat capacity and third-law entropy of kaersutite, pargasite, fluoropargasite, tremolite and fluorotremolite. Eur J Mineral. 2010;22:319–331. doi: 10.1127/0935-1221/2010/0022-2016. [DOI] [Google Scholar]
- Ditmars DA, Ishihara S, Chang SS, Bernstein G, West ED. Measurements of the relative enthalpy of pure α-Al2O3 (NBS heat capacity and enthalpy standard reference material no. 720) from 10 to 1,950 K. J Res Nat Bur Stand. 1982;87:5–9. doi: 10.6028/jres.087.012. [DOI] [PMC free article] [PubMed] [Google Scholar]
- Egan EP, Wakefield ZT, Elmore KL. High-temperature heat content of hydroxyapatite. J Am Chem Soc. 1950;72:2418–2421. doi: 10.1021/ja01162a019. [DOI] [Google Scholar]
- Egan EP, Wakefield ZT, Elmore KL. Low-temperature heat capacity and entropy of hydroxyapatite. J Am Chem Soc. 1951;73:5579–5580. doi: 10.1021/ja01156a021. [DOI] [Google Scholar]
- Egan EP, Wakefield ZT, Elmore KL. Thermodynamic properties of fluorapatite, 15 to 1600°K. J Am Chem Soc. 1951;73:5581–5582. doi: 10.1021/ja01156a022. [DOI] [Google Scholar]
- Freund F, Knobel RM. Distribution of fluorine in hydroxyapatite studied by infrared spectroscopy. J Chem Soc Dalton Trans. 1977 doi: 10.1039/DT9770001136. [DOI] [Google Scholar]
- Holland TJB, Redfern SAT. Unit cell refinement from powder diffraction data: the use of regression diagnostics. Mineral Mag. 1997;61:65–77. doi: 10.1180/minmag.1997.061.404.07. [DOI] [Google Scholar]
- Hughes JM, Rakovan JF. Structurally robust, chemically diverse: apatite and apatite supergroup minerals. Elements. 2015;11:165–170. doi: 10.2113/gselements.11.3.165. [DOI] [Google Scholar]
- Hughes JM, Cameron M, Crowley KD. Structural variations in natural F, OH and Cl apatites. Am Mineral. 1989;74:870–876. [Google Scholar]
- Hughes JM, Harlov D, Kelly SR, Rakovan J, Wilke M. Solid solution in the apatite OH-Cl binary system: Compositional dependence of solid-solution mechanisms in calcium phosphate apatites along the Cl-OH binary. Am Mineral. 2016;101:1783–1791. doi: 10.2138/am-2016-5674. [DOI] [Google Scholar]
- Hughes JM, Harlov D, Rakovan JF. Structural variations along the apatite F-OH join. Am Mineral. 2018;103:1981–1987. doi: 10.2138/am-2018-6608. [DOI] [Google Scholar]
- Kijima T, Tsutsumi M. Preparation and thermal properties of dense polycrystalline oxyhydroxyapatite. J Am Ceram Soc. 1979;62:455–460. doi: 10.1111/j.1151-2916.1979.tb19104.x. [DOI] [Google Scholar]
- Lashley JC, Hundley MF, Migliori A, Sarrao JL, Pagliuso PG, Darling TW, Jaime M, Cooley JC, Hults WL, Morales L, Thoma DJ, Smith JL, Boerio-Goates J, Woodfield BF, Stewart GR, Fisher RA, Phillips NE. Critical examination of heat capacity measurements made on a Quantum Design physical property measurement system. Cryogenics. 2003;43:369–378. doi: 10.1016/S0011-2275(03)00092-4. [DOI] [Google Scholar]
- Monkhorst HJ, Pack JD. Special points for Brillouin-zone integrations. Phys Rev B. 1976;13:5188–5192. doi: 10.1103/PhysRevB.13.5188. [DOI] [Google Scholar]
- Palkin VA, Kuzina TA, Orlovskii VP, Ezhova ZhA, Rodicheva GV, Sukhanova GE. The thermodynamic properties of Ca10(PO4)6(OH)2. Russ J Inorg Chem. 1991;36:1718–1720. [Google Scholar]
- Pfrommer BG, Côté M, Louie SG, Cohen ML. Relaxation of crystals with the quasi-newton method. J Comput Phys. 1997;131:233–240. doi: 10.1006/jcph.1996.5612. [DOI] [Google Scholar]
- Putnis A. Mineral replacement reactions. In: Oelkers EH, Schott J, editors. Thermodynamics and kinetics of water-rock interaction. Reviews in mineralogy and geochemistry. Chantilly: Mineralogical Society of America; 2009. pp. 87–124. [Google Scholar]
- Rintoul L, Wentrup-Byrne E, Suzuki S, Grøndahl L. FT-IR spectroscopy of fluoro-substituted hydroxyapatite: strengths and limitations. J Mater Sci Mater Med. 2007;18:1701–1709. doi: 10.1007/s10856-007-3052-3. [DOI] [PubMed] [Google Scholar]
- Sallet R. Fluorine as a tool in the petrogenesis of quartz-bearing magmatic associations: applications of an improved F-OH biotite-apatite thermometer grid. Lithos. 2000;50:241–253. doi: 10.1016/S0024-4937(99)00036-5. [DOI] [Google Scholar]
- Schettler G, Gottschalk M, Harlov D. A new semi-micro wet chemical method for apatite analysis and its application to the crystal chemistry of fluorapatite-chlorapatite solid solutions. Am Min. 2010;96:138–152. doi: 10.2138/am.2011.3509. [DOI] [Google Scholar]
- Suda H, Yashima M, Kakihana M, Yoshimura M. Monoclinic ↔ hexagonal phase transition in hydroxyapatite studied by X-ray powder diffraction and differential scanning calorimeter techniques. J Phys Chem. 1995;99:6752–6754. doi: 10.1021/j100017a068. [DOI] [Google Scholar]
- Tacker RC, Stormer JC. A thermodynamic model for apatite solid solutions, applicable to high-temperature geological problems. Am Min. 1989;74:877–888. [Google Scholar]
- van Rees HB, Mengeot M, Kostiner E. Monoclinic-hexagonal transition in hydroxyapatite and deuterohydroxyapatite. Mat Res Bull. 1973;8:1307–1320. doi: 10.1016/0025-5408(73)90144-X. [DOI] [Google Scholar]
- Zhu C, Sverjensky DA. Partitioning of F-Cl-OH between minerals and hydrothermal fluids. Geochim Cosmochim Acta. 1991;55:1837–1858. doi: 10.1016/0016-7037(91)90028-4. [DOI] [Google Scholar]
- Zhu C, Sverjensky DA. F-Cl-OH partitioning between biotite and apatite. Geochem Cosmochim Acta. 1992;56:3435–3467. doi: 10.1016/0016-7037(92)90390-5. [DOI] [Google Scholar]
Associated Data
This section collects any data citations, data availability statements, or supplementary materials included in this article.
Supplementary Materials
Data Availability Statement
All calorimetric data are given in Supplementary Table 1, other data in Tables 1 and 2.
Not applicable.