Abstract
The gut bacterium Prevotella copri (P. copri) has been shown to lower blood glucose levels in mice as well as in healthy humans, and is a promising candidate for a next generation probiotic aiming at prevention or treatment of obesity and type 2 diabetes. In this study the hypoglycemic effect of live P. copri was confirmed in mice and pasteurization of P. copri was shown to further enhance its capacity to improve glucose tolerance. The safety of live and pasteurized P. copri was evaluated by a 29-day oral toxicity study in mice. P. copri did not induce any adverse effects on body growth. General examination of the mice, gross pathological and histological analysis showed no abnormalities of the vital organs. Though relative liver weights were lower in the pasteurized (4.574 g ± 0.096) and live (4.347 g ± 0.197) P. copri fed groups than in the control mice (5.005 g ± 0.103) (p = 0.0441 and p = 0.0147 respectively), no liver biochemical marker aberrations were detected. Creatinine serum levels were significantly lower in mice fed with live (p = 0.001) but not pasteurized (p = 0.163) P. copri compared to those of control mice. Haematological parameter analysis and low plasma Lipopolysaccharide Binding Protein (LBP) levels ruled out systemic infection and inflammation. Immunomodulation capacity by P. copri as determined by blood plasma cytokine analysis was limited and gut colonisation occurred in only one of the 10 mice tested. Taken together, no major adverse effects were detected in P. copri treated groups compared to controls.
Subject terms: Health care, Metabolic disorders, Bacteria, Bacterial host response, Applied microbiology
Introduction
The prevalence of prediabetes, a condition characterised by blood glucose levels between normal and diabetic levels, is estimated between 15.8% and 36.0% (depending on the diagnostic criteria used) worldwide and is rapidly increasing. Of the individuals with prediabetes as many as 70% will eventually develop diabetes1. Metabolic diseases such as type 2 diabetes and obesity are major causes of death and disability worldwide. According to the International Diabetes Federation nearly 9.3% of the global population is affected by diabetes and the number is rising2. This causes a huge financial burden on the health care system globally and indicates the urgent need for interventions to prevent, delay and treat these diseases and their progression to debilitating complications (i.e. stroke, acute myocardial infarction, amputation or death from hyperglycaemic crisis).
Probiotics—originally introduced to improve intestinal health, are increasingly being considered also as preventative agents or therapeutics for type 2 diabetes and obesity3. Emerging evidence points to a central role for gut microbiota in host metabolism, for example blood glucose homeostasis and appetite regulation4,5. Profound differences in gut microbiota composition have been observed between obese and lean subjects and between healthy and type 2 diabetes (T2D) subjects, and animal experiments have shown a causal relationship between gut microbiota and disease6. In human metabolic syndrome subjects, furthermore, faecal transplantation with lean donor faeces has been shown to improve insulin sensitivity which was associated with changes in intestinal microbiota7.
A recent study in healthy humans showed a beneficial effect of barley kernel-based bread on glucose metabolism and this was linked to the composition of the gut microbiota. 16S rRNA gene sequencing and metagenomic analysis revealed that the gut microbiota in the subjects that responded to the barley kernel diet with improved glucose tolerance was enriched in P. copri. Germ free and normal wild type mice gavaged with P. copri showed an improved glucose tolerance pointing to a causal role8. This can possibly be attributed to P. copri’s ability to enhance hepatic glycogen storage8 and to produce succinate, a tricarboxylic acid (TCA) cycle intermediate, by bacterial fermentation of the barley dietary fibers. Succinate is responsible for glucose homeostasis through modulating intestinal gluconeogenesis9. Enrichment of Prevotella copri after intake of barley kernels was also linked to an increase in the gut hormone GLP-1 and lower hunger sensations10. In line with these findings P. copri has been identified as a potential candidate for a next generation probiotic to prevent and treat metabolic diseases11.
P. copri, a commensal obligate anaerobic gram-negative bacterium (for general characteristics see Table 1), is one of the most prevalent bacteria in the human gastrointestinal tract12. In 10–25% of healthy Americans and European individuals, the relative abundance of Prevotella in the stool is > 10%13 and of the 5 Prevotella species reported in the human intestine P. copri is the most abundant14. Prevotella is a biomarker of diet, lifestyle and health status15 and P. copri abundance has been linked to vegetable and fiber-rich low protein diets16–18 which are more commonly consumed by non-Western subjects18,19. Decreased levels of P. copri were observed in obese African women20 and Prevotella abundance can be used as a predictor of weight loss success in healthy, overweight adults consuming a whole-grain diet21. While increased levels of P. copri were reported in patients with newly onset untreated rheumatoid arthritis22 and irritable bowel syndrome23, decreased levels of P. copri were detected in patients with neurodegenerative diseases24 and childhood dermatitis25.
Table 1.
General characteristics of P. copri.
| Phylum | Class | Order | Family | Genus | Species |
|---|---|---|---|---|---|
| Bacteroidetes | Bacteroidia | Bacteroidales | Prevotellaceae | Prevotella | Prevotella copri |
| Type strain | DSM 18205 (CB7) | ||||
| Biosafety level | 1 | ||||
| Origin | Faecal sample from a healthy adult volunteer | ||||
| Characteristics | Gram negative, rod-shaped, anaerobic and non-spore forming bacteria | ||||
| Growth conditions | Medium | Schaedler Agar with horse blood | |||
| Temperature | 37 °C | ||||
| Atmosphere | 5% H2, 10% CO2, 85% N2 | ||||
Taken together, P. copri shows potential as next generation probiotic to prevent or treat metabolic related diseases, and appears to affect also other pathologies. To justify human consumption, however, its safety needs to be validated, especially considering its ambiguous association with health status26. In this study, therefore, the effects of P. copri administration were evaluated in mice. Mice were gavaged daily with P. copri for 29 consecutive days. Potential pathological effects were studied by analysis of weight, and evaluation of haematological, histological and biochemical parameters. Immunomodulation, translocation and colonisation by the bacteria were also determined.
Results
Oral glucose tolerance test in C57BL/6J mice gavaged with P. copri
Both the group of mice treated with pasteurized and the group treated with live P. copri showed improved glucose tolerance compared to the control (PBS/glycerol only) group, with a more pronounced effect following gavage with the pasteurized bacteria than the live bacteria (Fig. 1a) (area under the curve (p = 0.0594 for control versus pasteurized P. copri; Fig. 1b).
Figure 1.
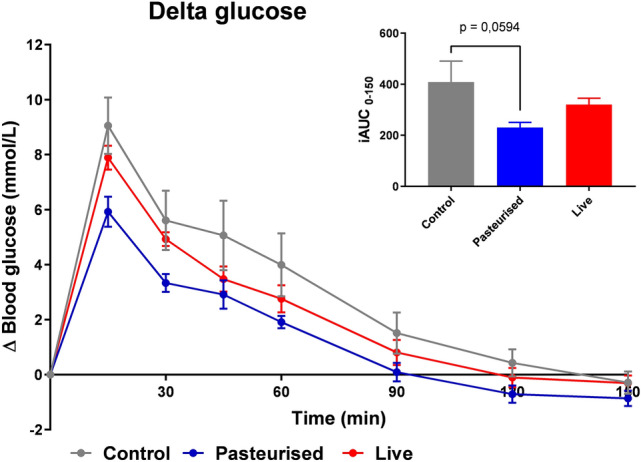
Beneficial Effects of P. copri on Glucose Metabolism in Mice. C57BL/6J mice were gavaged with 5 × 10⁶ live P. copri daily for 7 consecutive days. An oral glucose tolerance test (OGTT) was performed on day 7 showing that both live and pasteurized P. copri improve glucose tolerance (n = 10).
General health status and body weight changes after P. copri administration
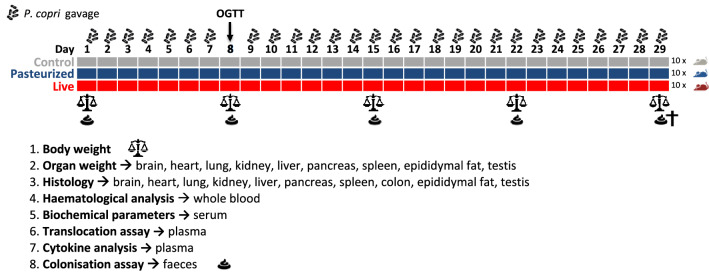
No death or treatment-related signs of toxicity were observed in any of the animals during the 29 days. General appearance and behavior of the animals were similar for all groups throughout the study. The skin appeared normal (no ruffled fur or skin lesions) and no diarrhea was observed. All mice were active and curious (open-field activity), exhibited normal grooming activity and no abnormal locomotion, hyperactivity or lethargy (sluggish behavior, hunched posture) was noted. Bodyweight was measured five times during the experiment (before the gavaging started, after week 1, 2 and 3 and on the day of sacrifice) (Fig. 2). All groups gained weight at similar rates and none of the treatment groups showed abnormal bodyweight gain/loss (Fig. 3).
Figure 2.
Experimental setup of the mouse study. This figure has been created using Excel office 365 (office.com). The icons were obtained from the following sources: ‘https://pngimage.net/poop-icon-png-3/’ by perfectly posh and ‘https://www.iconsdb.com/black-icons/scales-icon.html’ by Icons8.com, Creative Commons Attribution-NoDerivs 3.0.
Figure 3.
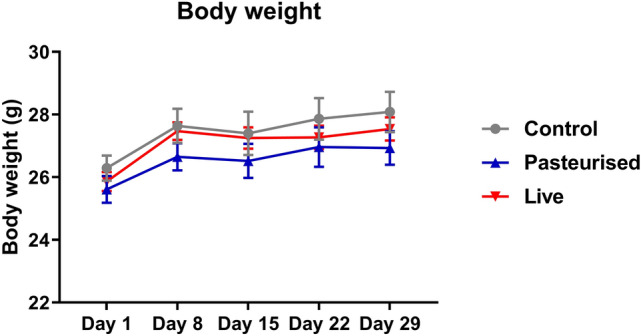
Body weights before the start of gavaging (day 1) and at day 8, 15, 22 and 29 (n = 10).
Macroscopic and histopathological examination
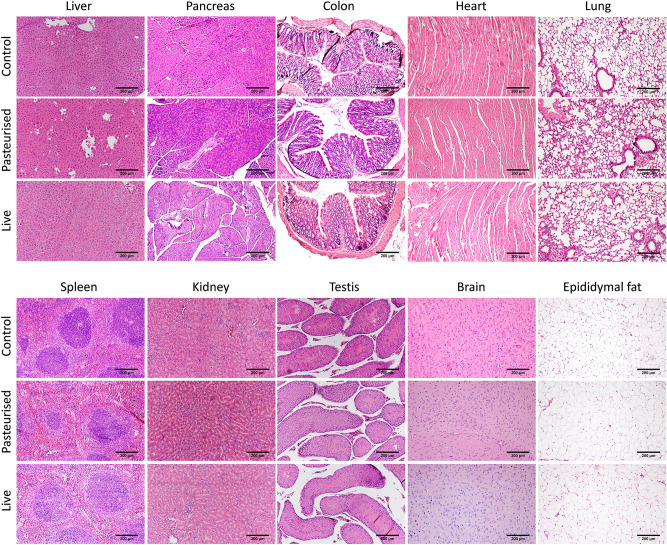
No significant difference in organ weight relative to body weight between control and P. copri (pasteurized or live) fed mice was observed for pancreas, heart, lung, brain, spleen, epididymal fat, kidneys or testis weight relative to body weight (Table 2). The liver weight of mice which received pasteurized (4.574 g ± 0.096) and live P. copri (4.347 g ± 0.197) was lower than the relative liver weight of the control mice (5.005 g ± 0.103), p = 0.0441 and p = 0.0147 respectively. Gross pathological and histopathological examination revealed no signs of inflammation, degeneration or necrosis of liver, pancreas, colon, heart, lung, spleen, kidney, testis, brain or epididymal fat (Fig. 4).
Table 2.
Relative organ weights after oral administration of P. copri for 29 days.
| Organ weight | Control | Pasteurized | Live |
|---|---|---|---|
| Pancreas/BW (%) | 0.823 ± 0.057 | 0.847 ± 0.063 | 0.955 ± 0.045 |
| Heart/BW (%) | 0.536 ± 0.011 | 0.534 ± 0.018 | 0.573 ± 0.028 |
| Lung/BW (%) | 0.531 ± 0.024 | 0.633 ± 0.036 | 0.619 ± 0.033 |
| Spleen/BW (%) | 0.246 ± 0.012 | 0.268 ± 0.013 | 0.276 ± 0.010 |
| Kidneys/BW (%) | 1.206 ± 0.034 | 1.237 ± 0.029 | 1.266 ± 0.031 |
| Liver/BW (%) | 5.005 ± 0.103 | 4.574 ± 0.096* | 4.347 ± 0.197* |
| Testes + epididymes/BW (%) | 0.928 ± 0.032 | 0.888 ± 0.039 | 0.922 ± 0.019 |
| Epididymal fat/BW (%) | 1.178 ± 0.078 | 1.177 ± 0.081 | 1.150 ± 0.082 |
| Brain/BW (%) | 1.222 ± 0.055 | 1.192 ± 0.025 | 1.169 ± 0.013 |
Values are presented as mean ± SEM of 10 replicates.
BW body weight.
*Mean values were significantly different from the control group (p-value < 0.05).
Figure 4.
Representative histological haematoxylin–eosin stained sections of murine organs of control mice (top) and after administration of pasteurized (middle) or live (bottom) P. copri (liver, pancreas, colon, heart, lung, spleen, kidney, testis, brain and epipidymal fat). Scale bar = 200 μm.
Haematological analysis and serum biochemistry profile
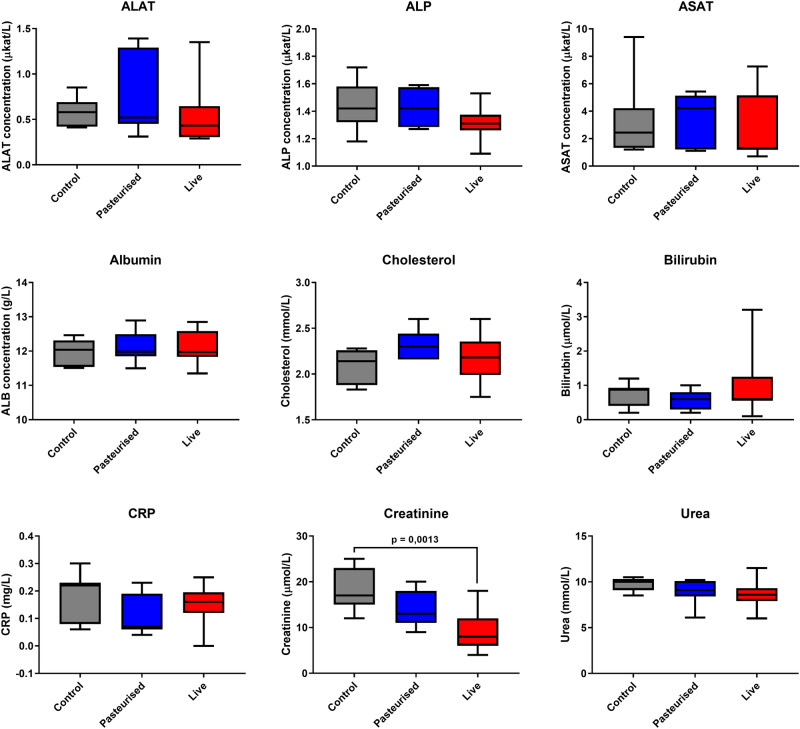
Haematological parameters show the total count of white blood cells and their sub-types (lymphocytes, monocytes, neutrophils). No significant alterations were observed using one-way ANOVA for total blood count of white blood cells (p = 0.663), neutrophils (p = 0.171), monocytes (p = 0.937) or lymphocytes (p = 0.381) between the control and the P. copri-fed mice. Platelet counts were also not significantly different between the treatments (p = 0.638, one-way ANOVA) (Table 3). Repeated-dose oral administration of P. copri did not result in any significant changes in the serum biochemistry parameters aspartate amino transferase (AST), alanine amino transferase (ALT), alkaline phosphatase (ALP), albumin (ALB), cholesterol, bilirubin, C-reactive protein (CRP) and blood urea nitrogen (BUN), compared with the control group. Creatinine serum levels however, were significantly lower in mice fed with live (p = 0.001) but not pasteurized (p = 0.163) P. copri compared to those of control mice (Fig. 5).
Table 3.
Haematological parameters after oral administration of P. copri for 29 days.
| Blood cell parameter | Control | Pasteurized | Live |
|---|---|---|---|
| WBC (109/L) | 4.098 ± 0.596 | 4.497 ± 0.494 | 4.880 ± 0.666 |
| LYM (109/L) | 3.301 ± 0,543 | 3.762 ± 0.410 | 4.373 ± 0.603 |
| MON (109/L) | 0.313 ± 0.080 | 0.330 ± 0.067 | 0.294 ± 0.063 |
| NEU (109/L) | 0.483 ± 0.127 | 0.403 ± 0.091 | 0.214 ± 0.073 |
| MCH (pg) | 14.280 ± 0.315 | 14.250 ± 0.119 | 14.480 ± 0.111 |
| MCHC (g/dL) | 32.500 ± 0.764 | 33.510 ± 0.254 | 33.410 ± 0.206 |
| RDWs (fl) | 33.290 ± 0.522 | 32.040 ± 0.302 | 32.590 ± 0.502 |
| RDWc % (%) | 17.420 ± 0.214 | 17.370 ± 0.157 | 17.360 ± 0.200 |
| PLT (109/L) | 429.100 ± 26.429 | 447.900 ± 57.510 | 486.800 ± 40.908 |
| PCT % (%) | 0.233 ± 0.016 | 0.245 ± 0.033 | 0.263 ± 0.022 |
| MPV (fl) | 5.450 ± 0.083 | 5.460 ± 0.070 | 5.390 ± 0.069 |
| PDWs (fl) | 5.650 ± 0.099 | 5.830 ± 0.176 | 5.820 ± 0.184 |
| PDWc % (%) | 27.800 ± 0.257 | 28.230 ± 0.404 | 28.180 ± 0.419 |
Values are presented as mean ± SEM (n = 10).
No mean values were significantly different from the control group (p < 0.05).
WBC white blood cell count, LYM lymphocytes, MON monocytes, NEU neutrophils, MCH mean corpuscular haemoglobin, MCHC mean corpuscular haemoglobin concentration, RDWs red cell distribution width—SD, RDWc red cell distribution width—CV, PLT platelet count, PCT thrombocrit, MPV mean platelet volume, PDWs platelet distribution width—SV, PDWc platelet distribution width—CV.
Figure 5.
Serum biochemical markers after oral administration of P. copri for 29 days. ALAT, alanine aminotransferase; ASAT, aspartate aminotransferase; ALP, alkaline phosphatase; ALB, Albumin; CRP, C-reactive protein. Samples which showed signs of haemolysis were not included in the analysis. Control and pasteurized P. copri n = 7, live P. copri n = 9.
Lipopolysaccharide-binding protein (LBP)
Plasma LBP levels were not significantly different between the controls and P. copri fed groups (control vs pasteurized p = 0.889; control vs live p = 0.920) (Fig. 6).
Figure 6.
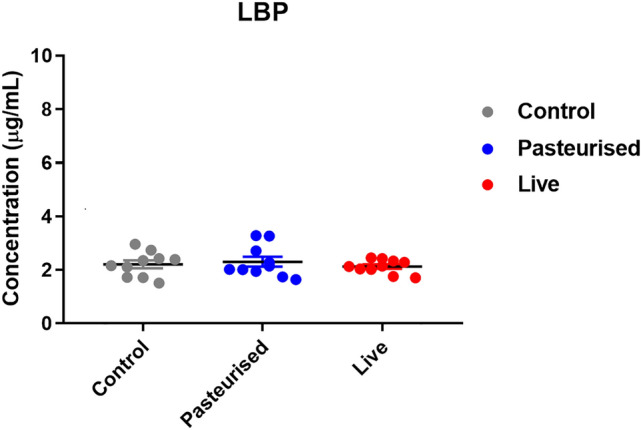
LBP levels in plasma after 29 days of P. copri gavage (n = 10).
Cytokine analysis
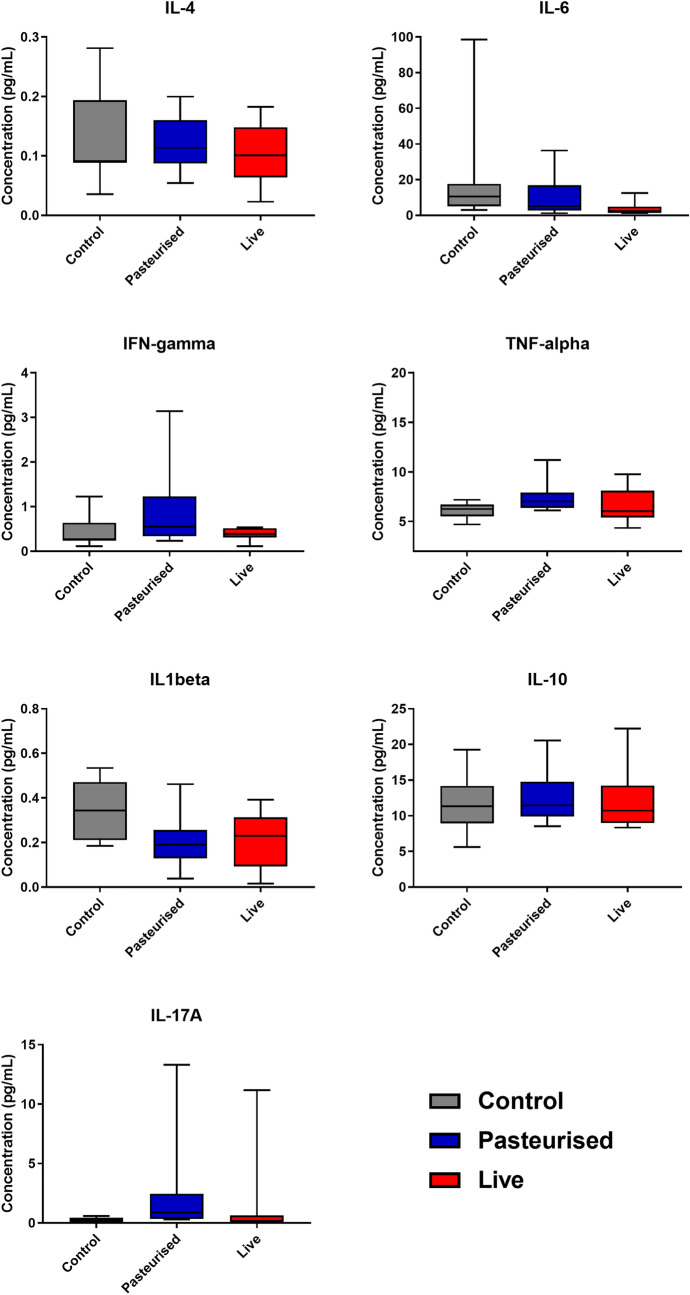
No significant differences between controls and P. copri fed mice were detected in blood plasma for IL-4, IL-6, IFN-γ, TNF-α, IL1β, IL-10 or IL-17A (p > 0.05 for all) (Fig. 7).
Figure 7.
Cytokine levels in plasma after 29 days of P. copri gavage (n = 10).
Genomic analysis of P. copri in stool samples
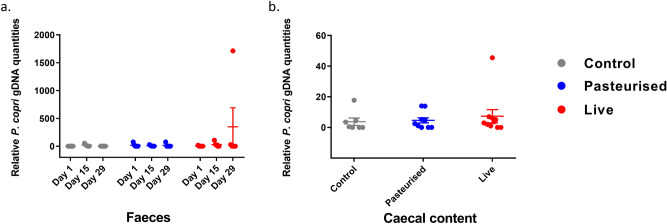
Faeces were collected and pooled at day 1, day 15 and day 29. Levels of P. copri were determined by 16S rRNA gene specific quantitative PCR. P. copri gDNA analysis showed a relative increase of the P. copri gDNA amounts in the faeces pooled from one cage containing two live P. copri fed mice compared to the faeces of the control mice. This elevation in P. copri gDNA in the faeces corresponded to the detection of P. copri also in the caecal content in one of these 2 mice, indicating the presence of P. copri in the intestines of one out of 10 mice (Fig. 8).
Figure 8.
Colonisation assays. Relative genomic DNA content of P. copri in caecal content (left) and faeces (right) samples for three treatment groups. Pooled per cage of 2 mice for faeces (n = 5), for faecal content: n = 10.
Discussion
The gut bacterium P. copri improves glycemic control and has thus been suggested as next generation probiotic8,11. For human use, however, its safety needs to be evaluated. In this study the oral toxicity of live and inactivated (pasteurized) P. copri was assessed in mice according to the OECD guidelines for the ‘repeated dose 28-day oral toxicity studies’ in rodents27, with the setup presented in Fig. 2. Mice were chosen as an experimental model as they are commonly used in human gut microbiota research and their physiology closely resembles that of humans28. Pasteurized bacteria as well as live bacteria were tested in the subsequent safety studies as our results showed that pasteurisation enhances P. copri’s capacity to improve glucose tolerance (Fig. 1). Inactivation of other probiotics by pasteurization for 30 min at 70 degrees Celsius (a less extreme treatment that in contrast to autoclaving limits denaturation of cellular components) has been shown to partly or fully retain beneficial effects on parameters such as glucose metabolism29–31. One hypothesis is that pasteurisation increases access of bacterial ligands to the host receptors. Advantages of using heat inactivated rather than live bacteria include the circumvention of oxygen sensitivity of this anaerobic strain, increased stability and shelf life and elimination of the risks of microbial translocation and infection of the consumer32.
Body weights increased at similar rates for all groups indicating no growth abnormalities (Fig. 3). Weight of pancreas, epididymal fat, heart, lung, brain, spleen, kidney or testis relative to body weight was similar in controls and mice treated with P. copri, suggesting no adverse effects to these organs. Liver weight relative to bodyweight of mice treated with pasteurized and live P. copri however, was lower than that of the controls. To investigate whether the observed decreased liver mass has any functional implications, serum biochemical parameters relevant to liver function and damage were measured. The levels of the liver enzymes AST, ALT and ALP were similar for all groups indicating no liver damage. These enzymes are normally present in liver cells, and to some extent circulating in the blood stream. Upon inflammation or damage of the liver however, the damaged liver cells release elevated levels of these enzymes into the blood stream. Bilirubin, another liver disease marker in the blood stream, is produced from the breakdown of red blood cells. Bilirubin levels were also similar in all groups indicating that P. copri administration has no influence on the ability of the liver to remove bilirubin from the blood stream. No significant differences could be observed between the groups for albumin, cholesterol, C-reactive protein (acute-phase protein synthesised by the liver) and urea (a metabolite of amino acids produced in the liver) ruling out hepatoxicity. Creatinine levels however, were significantly lower in the blood of mice fed with live P. copri but not pasteurized P. copri compared to the controls (Fig. 5). As a by-product of muscle metabolism that is excreted unchanged by the kidneys, serum creatinine is an important indicator of renal function. Lower creatinine levels in the P. copri fed groups indicate well-functioning kidneys.
No gross anatomical abnormalities were observed in liver, pancreas, epididymal fat, heart, lung, brain, spleen, kidney, testis, stomach or intestines. Histological analysis of liver, pancreas, colon, heart, lung, spleen, kidney, testis, brain and epididymal fat furthermore showed no microscopic abnormalities (Fig. 4). The epididymal fat cells in the control and pasteurized and live P. copri treated groups are all of similar size and do not suggest any fat loss in epididymal tissue. Histology showed no intestinal pathology such as ulcerations of the mucosa or intestinal inflammation that could cause or contribute to augmented intestinal permeability (Fig. 4). Further assessment of bacterial translocation (i.e. the passage of intestinal bacteria or their associated endotoxins from the gut lumen into the circulation that can cause systemic inflammation and distant organ injury) confirmed these histological findings at a molecular level by LBP analysis33. There was no significant difference in the LBP levels between the control and P. copri fed groups, ruling out gut leakage of lipopolysaccharide (LPS) and metabolic endotoxemia (Fig. 6). LBP is a soluble acute-phase protein mainly produced by the liver that binds to the lipid A portion of bacterial LPS, present on the outer cell wall of gram negative bacteria. It presents LPS to the cell surface LPS receptor complex (CD14, TLR4, MD-2) on immune cells to elicit an acute-phase immunologic response. LBP levels detected were in the normal range for all groups (in the µg/ml range34, around 6 µg/ml according to Hycult, the manufacturers of the kit used in this study) and were not indicative of acute phase responses.
To further rule out systemic infection and inflammation, haematological parameters and cytokines were measured in the blood. No significant alterations in blood cell count were observed for total white blood cell count, neutrophils, monocytes or lymphocytes, nor were any significant differences detected in platelet counts (p = 0.638) between the treatments (Table 3). Immunomodulation by P. copri determined by cytokine analysis was found to be very limited. Controls and P. copri fed mice showed similar blood plasma levels for IL-4, IL-6, IFN-γ, TNF-α, IL1β, IL-10 or IL-17A. Notably, P. copri has co-evolved with the human immune system for millennia, confirmed by its presence in archeological gut contents of the 5300 year old European copper age mummy Ötzi and in Mexican coprolite material dating from AD 673 to 76835. It has thus evolved presumably harmless strategies to modulate the immune system activities enabling the co-existence of P. copri with the human immune system. Interestingly, previous in vitro studies showed that P. copri was superior in inducing the Th17 driving cytokines such as IL-6 of bone-marrow-derived dendritic cells (BMDC) compared to other commensal bacteria. These P. copri stimulated BMDCs were able to prime native Th cells to produce up to fivefold increased IL-17 levels36. In this study however, no significant alterations of IL-17A or IL-6 levels were observed in the plasma of the P. copri fed mice (Fig. 7).
A colonisation assay was performed to investigate colonisation potential of P. copri in the intestines of the mice. Faeces were collected and pooled per cage before (day 1), in the middle (day 15) and at the end (day 29) of the experiment and caecal content was collected after sacrificing the mice. Levels of P. copri were determined by 16S rRNA gene specific quantitative PCR. P. copri gDNA was only detected in the faeces collected from one of the live P. copri cages (Fig. 8a). The presence of P. copri gDNA was narrowed down to one mouse by qPCR of the individual caecal content (Fig. 8b). The absence of detection of P. copri in the group that received pasteurized P. copri and in 9 out of 10 mice that received live P. copri points to degradation of the DNA and/or low quantity of P. copri. Notably, the transit time is only 4–6 h in mice (37; see Supplementary Fig. S1 for transit time of P. copri in particular) while faeces were harvested 24 h after the last gavage in this mouse study. P. copri has been reported to colonise the gut of germ-free mice8. Given that germ-free mice were not used in this study, it is likely that all niches for P. copri were already occupied by other microbes, which could explain the low to absent levels of P. copri detected in the faeces.
Since P. copri was only discovered in 2007, it has no history of use in the food industry before 1997, and must thus be treated according to the Novel Food Regulation (European Commission, 1997). Further in vitro studies are required to validate the use of P. copri as a next generation probiotic. P. copri should be screened for the potential presence of genes associated with antibiotic resistance and the minimum inhibitory concentration (MIC)—the lowest concentration of an antimicrobial (like an antifungal, antibiotic or bacteriostatic) drug that will inhibit the visible growth of a microorganism after overnight incubation—should be experimentally determined.
In conclusion, P. copri did not induce any adverse effects on growth, cellular blood components, serum biochemical parameters or vital organs of the treated animals. No major immune modulatory effects were observed. No signal of genomic content was observed during the supplementation period with the only exception of one cage with two mice which could be due to the continuous "genomic load" during the supplementation period. Taken together, these findings show potential of P. copri strain DSM18205 to achieve GRAS status. The results from this safety study in mice are promising and provide the basis for more long-term animal safety studies (chronic toxicity studies), and ultimately clinical trials in humans to investigate P. copri as a therapeutic tool in the prevention and cure of the metabolic syndrome.
Materials and methods
To assess the probiotic effect and safety of P. copri administration, mice were gavaged with live or pasteurized P. copri for 29 consecutive days. The experimental design of the study is depicted in Fig. 2.
Culture and treatment of P. copri
Preparation of P. copri for oral gavage
50 ml Peptone Yeast Glucose (PYG) medium was placed in 100 ml serum bottles, sealed with a butyl-rubber stopper, the headspace (the gas phase) gassed with N2 gas and bottles autoclaved to achieve sterile anaerobic conditions. The bacteria (P.copri strain DSM18205) were grown at 37 °C without agitation. The bacteria were spun down in the logarithmic phase, washed by resuspending in 0.9% NaCl and centrifuged at 3000 rpm for 30 min. The bacterial cell pellet was resuspended in PBS with 10% (vol/vol) glycerol and split equally into 2 tubes for different treatments. Half of the P. copri cells were directly aliquoted and frozen at -80 °C for storage, while the other half were pasteurized at 65 °C for 30 min before storing at -80 °C. A representative glycerol stock was thawed and diluted with PBS to determine CFU/ml by plate counting using Schaedler agar plates.
Bacterial identification
To assess bacterial contamination and to examine morphological features of the bacteria, gram staining (Sigma-Aldrich) was performed according to the manufacturer’s protocol. Bacteria were identified by quantitative PCR using P. copri 16S rRNA gene and universal 16S rRNA gene primers (Table 4)38,22.
Table 4.
Primers used in the qPCR studies.
Mouse procedures
Mice
30 male 12 week old C57BL/6J mice (Janvier) were housed in controlled conditions (12 h day/night cycle at 22 °C) in a specific pathogen free animal facility. Before the study started the mice were acclimatized for 1 week and split into 15 cages containing 2 mice each. The mice had free access to tap water and standard chow diet. This study was approved by the local Malmö-Lund Ethical Review Committee for Animal Experimentation and conducted in accordance with the European Community regulation concerning the protection of experimental animals (2010/63/EU) and in compliance with the ARRIVE guidelines.
Oral gavage
The mice were split into three groups of 10 mice (control, pasteurized and live). The control group received 0.1 ml of a 10% glycerol in PBS solution while the other groups received a dose of 0.1 ml containing 5 × 10⁶ CFU/mL live or pasteurized P. copri in 10% glycerol in PBS via intragastric gavaging in the morning for 29 consecutive days.
Weighing
Mice were weighed at five time points during the experiment: at baseline, after week 1, 2 and 3 and finally after week 4 on the day of sacrifice (Fig. 2).
Faeces, blood and organ collection
Faeces was collected and pooled per cage on day 1, 8, 15, 22 and 29. At sacrifice, the mice were anesthetized with isoflurane and blood collection was performed immediately. Approximately 0.8 ml blood per mouse was collected by cardiac puncture. One part was collected into an EDTA coated tube (Becton Dickinson) (for heamatological analysis), another part was collected into another EDTA coated tube, spun down with supernatant taken off and frozen (for cytokine analysis and LBP ELISA) while a third part was collected in a serum tube (Becton Dickinson), spun down, supernatant taken off and frozen (for biochemical marker analysis). After sacrificing the mice, organs (liver, pancreas, epididymal fat, heart, lung, brain, spleen, kidney and testis) were dissected and relative organ weight was calculated as shown in Eq. 1.
| 1 |
Equation 1: Calculation of relative weights of organs to bodyweight.
Oral glucose tolerance test (OGTT)
An oral glucose tolerance test was performed after 7 days of gavaging live or pasteurized bacteria. The mice were fasted for 6 h and 3 g glucose/kg bodyweight was orally administered. Blood glucose content was measured from the tail vein blood before and 15, 30, 45, 60, 90, 120 and 150 min after glucose administration using a HemoCue-glucose analyzer.
Haematological analysis
EDTA anti-coagulated blood samples were analysed within 7 h with an Abacus Vet5 Hematology analyzer AV5 according to the manufacturer’s instructions.
Histology
Liver, pancreas, colon, heart, lung, spleen, liver, testis, brain and epididymal fat were dissected, fixed in formaldehyde for 24 h and then stored in 70% ethanol at 4 °C. The organs were embedded into paraffin wax, sectioned 5 µm thick with an Accu-Cut SRM 200 Rotary Microtome, and stained with haematoxylin and eosin. Slides were examined under an Olympus BX60 light microscope.
Biochemical marker analysis
Serum samples were analyzed using the Cobas 8000 automated platform (Roche) according to the manufacturer's instructions. The following markers were tested: aspartate amino transferase (AST), alanine amino transferase (ALT), alkaline phosphatase (ALP), albumin (ALB), cholesterol, bilirubin, C-reactive protein (CRP), creatinine and blood urea nitrogen (BUN). Samples which showed signs of haemolysis were not included in the analysis.
Lipopolysaccharide Binding Protein (LBP) ELISA
Mouse plasma was diluted 1:500 and LPS Binding Protein levels were measured with a mouse LBP ELISA kit (Hycult Biotech, The Netherlands) according to the manufacturer’s instructions.
Cytokine analysis
The cytokines IL-17A (belonging to the mouse Th17 panel 1), IFN-γ, IL-1β, IL-4, IL-6, IL-10 and TNF-α (belonging to the mouse proinflammatory panel 1) (Custom Mouse Cytokine V-Plex kit; cat. No. K152A0H-1) were measured using the Mesoscale Diagnostics (MSD) multi-spot assay system as follows. The standards were reconstituted in the assay diluent provided. The wells were washed three times using 200 μl PBS + 0.05% Tween20, each time soaked for 30 s and then emptied using an Asys Atlantis microplate washer. Standards and samples (diluted ¼ for proinflammatory panel plate, ½ for Th17 panel 1 plate) were added at 50 μl per well, the plates were sealed and incubated for 2 h at room temperature on an orbital shaker (700 rpm, Thermo Scientific). 25 μl per well of the detection antibody was added, the plate sealed and incubated for 1 h at room temperature on an orbital shaker. The plates were washed three times as before. 150 μl of the 2 × MSD Read Buffer T was added to each well and the MSD plates were measured by the Meso QuickPlex SQ 120. The raw data were measured as electro-chemiluminescence signal (light) detected by photodetectors and analysed using the Discovery Workbench 3.0 software (MSD). A 4-parameter logistic fit curve was generated for each analyte using the standards and the concentration of each unknown sample was calculated.
Quantitative PCR (qPCR)
Total bacterial DNA from faecal samples and caecal content was extracted using the QIAamp PowerFecal DNA Kit (Qiagen) according to the manufacturer’s protocol. DNA concentrations and purity were determined using a Nanodrop spectrophotometer (Nanodrop Technologies) and qPCR analysis was performed using universal 16S and P. copri 16S rRNA primers (Table 4)38,22. 20 ng of DNA was used in each qPCR amplification, ran in duplicate on the same plate. Detection of the PCR product was carried out by the CFX384 Real-Time PCR system (Biorad) using the DNA-binding dye SYBR Green I (SSo Advanced, Biorad) and the following cycling conditions: 98 °C for 3 min, 40 cycles of 95 °C for 15 s, and 62 °C for 15 s.
Statistical analysis
ANOVA general linear model followed by a Tuckey’s post hoc test was performed using a commercial software package (GraphPad Prism).
Supplementary Information
Acknowledgements
This work has been performed within SWElife (2017-03575; A.N. and F.H.), a strategic innovation program financed by Vinnova, and was also supported by the Royal Physiographic Society of Lund (39893 and 40985; P.V.). We would like to thank Olexandr Fedkiv for technical help and Kristina Andersson for critically reading the manuscript.
Author contributions
P.V., F.H., I.B. and A.N. were involved in the conception or design of the study. P.V., J.B., X.J., F.H. and A.N. were involved in the acquisition, analysis or interpretation of the data. P.V., J.B., I.B. and A.N. were involved in writing of the manuscript. All authors reviewed the manuscript.
Funding
Open access funding provided by Lund University.
Data availability
The data that support the findings of this study are available from the corresponding author upon reasonable request.
Competing interests
A.N., I.B. and F.H. are inventors on a patent related to health effects of Prevotella copri. The other authors declare no competing interests.
Footnotes
Publisher's note
Springer Nature remains neutral with regard to jurisdictional claims in published maps and institutional affiliations.
Contributor Information
Phebe Verbrugghe, Email: vphebe4@yahoo.com.
Anne Nilsson, Email: anne.nilsson@food.lth.se.
Supplementary Information
The online version contains supplementary material available at 10.1038/s41598-021-96161-6.
References
- 1.Hostalek U. Global epidemiology of prediabetes: Present and future perspectives. Clin. Diabetes Endocrinol. 2019;5:5. doi: 10.1186/s40842-019-0080-0. [DOI] [PMC free article] [PubMed] [Google Scholar]
- 2.Saeedi P, et al. Global and regional diabetes prevalence estimates for 2019 and projections for 2030 and 2045: Results from the International Diabetes Federation Diabetes Atlas, 9(th) edition. Diabetes Res. Clin. Pract. 2019;157:107843. doi: 10.1016/j.diabres.2019.107843. [DOI] [PubMed] [Google Scholar]
- 3.Wang L, et al. Evaluation of the hypoglycemic effect of probiotics via directly consuming glucose in intestines of STZ-induced diabetic mice and glucose water-induced diabetic mice. J. Funct. Foods. 2020 doi: 10.1016/j.jff.2019.103614. [DOI] [Google Scholar]
- 4.Utzschneider KM, Kratz M, Damman CJ, Hullar M. Mechanisms linking the gut microbiome and glucose metabolism. J. Clin. Endocrinol. Metab. 2016;101:1445–1454. doi: 10.1210/jc.2015-4251. [DOI] [PMC free article] [PubMed] [Google Scholar]
- 5.Gerard C, Vidal H. Impact of gut microbiota on host glycemic control. Front. Endocrinol. 2019;10:29. doi: 10.3389/fendo.2019.00029. [DOI] [PMC free article] [PubMed] [Google Scholar]
- 6.Wu H, Tremaroli V, Backhed F. Linking microbiota to human diseases: A systems biology perspective. Trends Endocrinol. Metab. 2015;26:758–770. doi: 10.1016/j.tem.2015.09.011. [DOI] [PubMed] [Google Scholar]
- 7.Kootte RS, et al. Improvement of insulin sensitivity after lean donor feces in metabolic syndrome is driven by baseline intestinal microbiota composition. Cell Metab. 2017;26:611–619. doi: 10.1016/j.cmet.2017.09.008. [DOI] [PubMed] [Google Scholar]
- 8.Kovatcheva-Datchary P, et al. Dietary fiber-induced improvement in glucose metabolism is associated with increased abundance of Prevotella. Cell Metab. 2015;22:971–982. doi: 10.1016/j.cmet.2015.10.001. [DOI] [PubMed] [Google Scholar]
- 9.De Vadder F, et al. Microbiota-produced succinate improves glucose homeostasis via intestinal gluconeogenesis. Cell Metab. 2016;24:151–157. doi: 10.1016/j.cmet.2016.06.013. [DOI] [PubMed] [Google Scholar]
- 10.Sandberg J, Kovatcheva-Datchary P, Bjorck I, Backhed F, Nilsson A. Abundance of gut Prevotella at baseline and metabolic response to barley prebiotics. Eur. J. Nutr. 2019;58:2365–2376. doi: 10.1007/s00394-018-1788-9. [DOI] [PMC free article] [PubMed] [Google Scholar]
- 11.Chang CJ, et al. Next generation probiotics in disease amelioration. J. Food Drug Anal. 2019;27:615–622. doi: 10.1016/j.jfda.2018.12.011. [DOI] [PMC free article] [PubMed] [Google Scholar]
- 12.Franke T, Deppenmeier U. Physiology and central carbon metabolism of the gut bacterium Prevotella copri. Mol. Microbiol. 2018;109:528–540. doi: 10.1111/mmi.14058. [DOI] [PubMed] [Google Scholar]
- 13.Koren O, et al. A guide to enterotypes across the human body: Meta-analysis of microbial community structures in human microbiome datasets. PLoS Comput. Biol. 2013;9:e1002863. doi: 10.1371/journal.pcbi.1002863. [DOI] [PMC free article] [PubMed] [Google Scholar]
- 14.Accetto T, Avgustin G. Polysaccharide utilization locus and CAZYme genome repertoires reveal diverse ecological adaptation of Prevotella species. Syst. Appl. Microbiol. 2015;38:453–461. doi: 10.1016/j.syapm.2015.07.007. [DOI] [PubMed] [Google Scholar]
- 15.Gorvitovskaia A, Holmes SP, Huse SM. Interpreting Prevotella and Bacteroides as biomarkers of diet and lifestyle. Microbiome. 2016;4:15. doi: 10.1186/s40168-016-0160-7. [DOI] [PMC free article] [PubMed] [Google Scholar]
- 16.Human Microbiome Project, C Structure, function and diversity of the healthy human microbiome. Nature. 2012;486:207–214. doi: 10.1038/nature11234. [DOI] [PMC free article] [PubMed] [Google Scholar]
- 17.Ley RE. Gut microbiota in 2015: Prevotella in the gut: Choose carefully. Nat. Rev. Gastroenterol. Hepatol. 2016;13:69–70. doi: 10.1038/nrgastro.2016.4. [DOI] [PubMed] [Google Scholar]
- 18.Schnorr SL, et al. Gut microbiome of the Hadza hunter-gatherers. Nat. Commun. 2014;5:3654. doi: 10.1038/ncomms4654. [DOI] [PMC free article] [PubMed] [Google Scholar]
- 19.Vangay P, et al. US immigration westernizes the human gut microbiome. Cell. 2018;175:962–972. doi: 10.1016/j.cell.2018.10.029. [DOI] [PMC free article] [PubMed] [Google Scholar]
- 20.Dugas LR, Bernabé BP, Priyadarshini M, Fei N, Park SJ, Brown L, Plange-Rhule J, Nelson D, Toh EC, Gao X, Dong Q, Sun J, Kliethermes S, Gottel N, Luke A, Gilbert JA, Layden BT. Decreased microbial co-occurrence network stability and SCFA receptor level correlates with obesity in African-origin women. Sci. Rep. 2018 doi: 10.1038/s41598-018-35230-9. [DOI] [PMC free article] [PubMed] [Google Scholar]
- 21.Christensen L, et al. Prevotella abundance predicts weight loss success in healthy, overweight adults consuming a whole-grain diet ad libitum: A post hoc analysis of a 6-wk randomized controlled trial. J. Nutr. 2019;149:2174–2181. doi: 10.1093/jn/nxz198. [DOI] [PubMed] [Google Scholar]
- 22.Scher JU, et al. Expansion of intestinal Prevotella copri correlates with enhanced susceptibility to arthritis. Elife. 2013;2:e01202. doi: 10.7554/eLife.01202. [DOI] [PMC free article] [PubMed] [Google Scholar]
- 23.Su Tingting, Liu Rongbei, Lee Allen, Long Yanqin, Du Lijun, Lai Sanchuan, Chen Xueqin, Wang Lan, Si Jianmin, Owyang Chung, Chen Shujie. Altered intestinal microbiota with increased abundance of prevotella Is associated with high risk of diarrhea-predominant irritable bowel syndrome gastroenterology. Gastroenterol Res Pract. 2018;2018:1–9. doi: 10.1155/2018/6961783. [DOI] [PMC free article] [PubMed] [Google Scholar]
- 24.Gerhardt Sara, Mohajeri M. Changes of Colonic Bacterial Composition in Parkinson’s Disease and Other Neurodegenerative Diseases. Nutrients. 2018;10(6):708. doi: 10.3390/nu10060708. [DOI] [PMC free article] [PubMed] [Google Scholar]
- 25.Mahdavinia M, et al. Effects of diet on the childhood gut microbiome and its implications for atopic dermatitis. J. Allergy Clin. Immunol. 2019;143:1636–1637. doi: 10.1016/j.jaci.2018.11.034. [DOI] [PubMed] [Google Scholar]
- 26.Claus SP. The strange case of Prevotella copri: Dr. Jekyll or Mr. Hyde? Cell Host Microbe. 2019;26:577–578. doi: 10.1016/j.chom.2019.10.020. [DOI] [PubMed] [Google Scholar]
- 27.OECD. Test No. 407: Repeated Dose 28-day Oral Toxicity Study in Rodents. (2008).
- 28.Nguyen TL, Vieira-Silva S, Liston A, Raes J. How informative is the mouse for human gut microbiota research? Dis. Model. Mech. 2015;8:1–16. doi: 10.1242/dmm.017400. [DOI] [PMC free article] [PubMed] [Google Scholar]
- 29.Peng GC, Hsu CH. The efficacy and safety of heat-killed Lactobacillus paracasei for treatment of perennial allergic rhinitis induced by house-dust mite. Pediatr. Allergy Immunol. 2005;16:433–438. doi: 10.1111/j.1399-3038.2005.00284.x. [DOI] [PubMed] [Google Scholar]
- 30.Sakai T, et al. Lactobacillus plantarum OLL2712 regulates glucose metabolism in C57BL/6 mice fed a high-fat diet. J. Nutr. Sci. Vitaminol. 2013;59:144–147. doi: 10.3177/jnsv.59.144. [DOI] [PubMed] [Google Scholar]
- 31.Plovier H, et al. A purified membrane protein from Akkermansia muciniphila or the pasteurized bacterium improves metabolism in obese and diabetic mice. Nat. Med. 2017;23:107–113. doi: 10.1038/nm.4236. [DOI] [PubMed] [Google Scholar]
- 32.Kataria J, Li N, Wynn JL, Neu J. Probiotic microbes: Do they need to be alive to be beneficial? Nutr. Rev. 2009;67:546–550. doi: 10.1111/j.1753-4887.2009.00226.x. [DOI] [PubMed] [Google Scholar]
- 33.Nishizawa K. Low-grade endotoxemia, diet, and gut microbiota: An emphasis on the early events leading to dysfunction of the intestinal epithelial barrier. Biomed. Res. Clin. Pract. 2016 doi: 10.15761/BRCP.1000110. [DOI] [Google Scholar]
- 34.Lamping N, et al. LPS-binding protein protects mice from septic shock caused by LPS or gram-negative bacteria. J. Clin. Invest. 1998;101:2065–2071. doi: 10.1172/JCI2338. [DOI] [PMC free article] [PubMed] [Google Scholar]
- 35.Tett A, et al. The Prevotella copri complex comprises four distinct clades underrepresented in westernized populations. Cell Host Microbe. 2019;26:666–679. doi: 10.1016/j.chom.2019.08.018. [DOI] [PMC free article] [PubMed] [Google Scholar]
- 36.Larsen JM. The immune response to Prevotella bacteria in chronic inflammatory disease. Immunology. 2017;151:363–374. doi: 10.1111/imm.12760. [DOI] [PMC free article] [PubMed] [Google Scholar]
- 37.Padmanabhan P, Grosse J, Asad AB, Radda GK, Golay X. Gastrointestinal transit measurements in mice with 99mTc-DTPA-labeled activated charcoal using NanoSPECT-CT. EJNMMI Res. 2013;3:60. doi: 10.1186/2191-219X-3-60. [DOI] [PMC free article] [PubMed] [Google Scholar]
- 38.Verbrugghe P, Van Aken O, Hallenius F, Nilsson A. Development of a real-time quantitative PCR method for detection and quantification of Prevotella copri. BMC Microbiol. 2021;21:23. doi: 10.1186/s12866-020-02063-4. [DOI] [PMC free article] [PubMed] [Google Scholar]
Associated Data
This section collects any data citations, data availability statements, or supplementary materials included in this article.
Supplementary Materials
Data Availability Statement
The data that support the findings of this study are available from the corresponding author upon reasonable request.


