

Abstract
How ectothermic animals will cope with global warming is a critical determinant of the ecological impacts of climate change. There has been extensive study of upper thermal tolerance limits among fish species but how intraspecific variation in tolerance may be affected by habitat characteristics and evolutionary history has not been considered. Intraspecific variation is a primary determinant of species vulnerability to climate change, with implications for global patterns of impacts of ongoing warming. Using published critical thermal maximum (CTmax) data on 203 fish species, we found that intraspecific variation in upper thermal tolerance varies according to a species’ latitude and evolutionary history. Overall, tropical species show a lower intraspecific variation in thermal tolerance than temperate species. Notably, freshwater tropical species have a lower variation in tolerance than freshwater temperate species, which implies increased vulnerability to impacts of thermal stress. The extent of variation in CTmax among fish species has a strong phylogenetic signal, which may indicate a constraint on evolvability to rising temperatures in tropical fishes. That is, in addition to living closer to their upper thermal limits, tropical species may have higher sensitivity and lower adaptability to global warming compared to temperate counterparts. This is evidence that freshwater tropical fish communities, worldwide, are especially vulnerable to ongoing climate change.
Subject terms: Ecology, Physiology
Introduction
The capacity of ectothermic species to cope with ongoing global warming, especially the increasing frequency, intensity and duration of extreme heatwaves, will be influenced by their upper thermal tolerance limits1–3. Tolerance of acute warming, measured as the critical thermal maximum (CTmax), varies among fish species according to thermal conditions in their habitat4. Tropical species live in warm, relatively thermally stable habitats; they have narrow thermal tolerance ranges but higher CTmax than species at temperate latitudes. Their warm habitat temperatures are also, however, closer to their limits of upper thermal tolerance, so they have a limited thermal safety margin (defined as the difference between upper thermal tolerance limit CTmax of adult life stage and the maximum habitat temperature during summer5) and consequently are considered to be especially vulnerable to global warming6–9. Temperate species have lower absolute thresholds for tolerance of warming, but they have broader tolerance ranges, presumably because they encounter a wide range of habitat temperatures, both seasonally and spatially. This is linked to wider thermal safety margins than in tropical species4,10. These patterns of vulnerability to global warming among species at a geographic scale are major issues in projecting impacts of warming. They have a strong phylogenetic basis, which is believed to reflect local adaptation to common ancestral thermal regimes in related species11.
Studies of broadscale geographic patterns in vulnerability have, to date, focused upon average values for CTmax among fish species. The significance of intraspecific variation in tolerance remains to be explored. The extent of variation in functional traits within species, particularly of physiological tolerances (e.g. CTmax, hypoxia tolerance, pollutant resilience, immune resistance) is expected to have a profound influence on their vulnerability to global change12–15. Possessing a broad range of tolerance phenotypes in populations can reduce sensitivity to impacts of environmental stressors, through various proximate ecological mechanisms12–14. If phenotypic variation is linked to underlying genetic diversity in the species, this can provide scope for adaptability and evolvability, by yielding genotypes for selection in changing environments12–14. When fish species are challenged by thermal stressors, such as increased seasonal temperatures and extreme heatwaves, the population sensitivity and adaptability will be major determinants of their relative vulnerability13–16 (Fig. 1).
Figure 1.
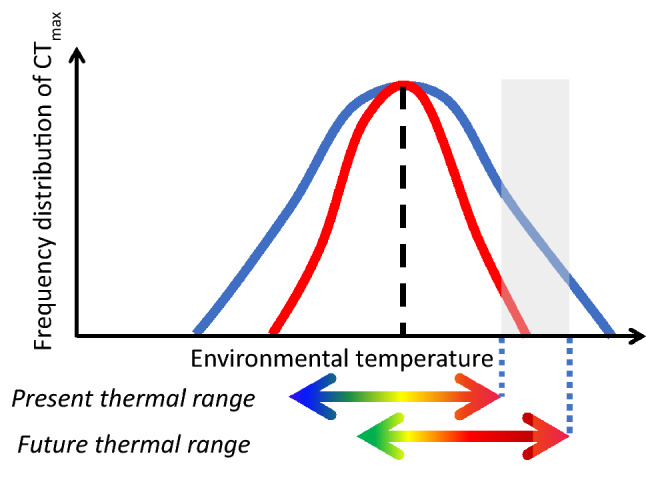
Theoretical representation of different frequency distribution curves of CTmax. The curves of two species have the same mean CTmax (dashed line) but different standard deviations (S.D.). With ongoing climate change, represented by the shift in the thermal range (double-pointed arrows), individuals of the species with the narrower S.D.CTmax (red curve) are less likely to survive compared to individuals of the species with the wider S.D. CTmax (blue curve), since maximum enviromental temperatures will include values (grey area) outside their thermal tolerance range.
Fish species show intraspecific variation in CTmax, which has a component of both phenotypic plasticity and heritable genetic variation15,17–19. The CTmax varies among populations of fish species, due to local adaptation20–22, indicating that the trait evolves in response to prevailing thermal regimes. Given the broader thermal range experienced by temperate fish species, within generations and over evolutionary time, we hypothesized that they would exhibit greater intraspecific variation in their thermal tolerance, measured as CTmax, than tropical species. We predicted that lower variation in CTmax within species might be observed in species with low thermal safety margin, because a small margin might constrain scope to express variation10. We also expected the extent of variation in CTmax to have a phylogenetic basis, indicating that it reflected evolutionary processes of adaptation.
We used published data4 and, after a data selection process (see “Methods”), we estimated the extent of intraspecific variation in CTmax of 203 species of ray-finned (actinopterygian) fish (n = 127 freshwater, n = 76 marine), based on the standard deviation of the mean. We were well aware that the selected studies in the dataset did not have the same protocol procedures. They did not use the same heating rate (0.0017–1 °C/min) and fish size, both of which can influence CTmax and standard deviation of the mean. We choose to not include these variables in our main analysis because of the high variation of heating rate used and for fish size there was insufficient reporting for this data among studies. We performed a supplementary analysis with heating rate in the model on 186 species. In our main analysis we then compared two latitudinal groups, temperate to tropical species, considering the boundary to be 23° latitude. We also evaluated if variation in CTmax depended on whether species were from northern or southern hemisphere or whether species were marine or freshwater and their individual CTmax. Finally, we used the magnitude of the difference between acclimation temperature (Ta) and CTmax, which we denoted delta temperature (ΔT = CTmax − Ta), as an indication of the capacity to increase CTmax depending on the acclimation temperature, and evaluated if it was linked to intraspecific variation in CTmax. All of the results were based on a phylogenetically informed analysis (phylogenetic least squares regression, PGLS, see “Methods”), to establish how patterns in the extent of variation were linked to evolutionary thermal history of the species.
Results
There was an overall significant difference in intraspecific variation in thermal tolerance between tropical versus temperate species (covariate: tropical species: PGLS, t = − 2.844, p = 0.005, Fig. 2). Freshwater tropical species showed lower intraspecific variation in CTmax (log10 S.D. CTmax) than freshwater temperate (covariate: tropical species: PGLS, t = − 2.844, p = 0.005, Fig. 2). Additionally, an overall difference was observed between marine and freshwater species, with marine species having a lower intraspecific variation in CTmax (covariate: marine species PGLS: t = − 0.198, p = 0.008, Fig. 2b). Species from northern hemisphere species and southern hemisphere did not show any difference in log10 S.D. CTmax (covariate: Southern hemisphere: PGLS, t = 0.32, p = 0.75; Fig. 2a). The ΔT had no significant effect on log10 S.D. CTmax (PGLS, t = 1.523, p = 0.13; Fig. 3a). However, there was a significant interaction between latitudinal groups and ΔT on log10 S.D. CTmax. Tropical species with a higher ΔT had a higher variation in log10 S.D.CTmax (PGLS, t = 2.266, p = 0.025, Fig. 3a). Species’ CTmax was negatively linked to intraspecific variation in upper thermal tolerance (PGLS, t = − 2.17, p = 0.031, Fig. 3b). The number of individuals used in the study did not influence the variation in log10 S.D. CTmax (PGLS, t = 0.553, p = 0.581, Suppl. Figure S1a). There was no interaction between latitudinal groups and hemisphere (interaction term: tropical*Southern hemisphere, PGLS, t = 1.58, p = 0.116, Fig. 2a). However tropical marine species had a higher log10 S.D. CTmax than temperate marine species (interaction term: tropical*marine, PGLS, t = 2.116, p = 0.036, Fig. 2b). Phylogenetic relatedness among species contributed strongly to observed variation in log10 S.D. CTmax (PGLS, λ = 0.430, F9,192 = 4.452, p < 0.001, R2 = 17.27; Fig. 4). A supplementary analysis was performed on 186 species by including heating rate in the selected model. High heating rate resulted in higher variation in log10 S.D. CTmax (PGLS, t = 2.433, p = 0.016, Suppl. Figure S1).
Figure 2.

Intraspecific variation in CTmax (log10 transformed standard deviation CTmax) divided into either temperate (148 species) or tropical (55 species). (a) Separated by hemisphere, Northern (132 temperate, 33 tropical species) or Southern (16 temperate and 22 tropical species). (b) Separated into freshwater (106 temperate, 21 tropical species) and marine (42 temperate, 34 tropical species).
Figure 3.

Intraspecific variation in CTmax (log10 transformed standard deviation CTmax) divided into either temperate (148 species) or tropical (55 species). (a) On delta temperature (°C) (b) On CTmax (°C).
Figure 4.

Phylogenetic tree of 203 species and their families, organised according to their intraspecific variation in upper thermal tolerance, estimated as the standard deviation of their CTmax (S.D. for CTmax).
Discussion
Overall, tropical species show a lower intraspecific variation in thermal tolerance than temperate species. Specifically, freshwater tropical species have reduced within-species variation in thermal tolerance compared to freshwater temperate species. Conversely, marine temperate species display lower intraspecific variability in CTmax compared to marine tropical species, although with a lower significant level (p = 0.036) than that found when comparing freshwater temperate vs tropical species (p = 0.005). To better understand the difference in effect direction in marine vs freshwater environments, further investigation is required on the driving factors modulating this difference. Nevertheless, if comparatively low intraspecific variability in CTmax reflect a reduced capacity for phenotypic plasticity, this will increase sensitivity to warming in the short term. If intraspecific variability in CTmax reflects diminished heritable genetic variation, a low value implies decreased adaptability and evolvability to a warmer and more thermally stressful future, over generational timescales.
The lower intraspecific variation in CTmax in freshwater tropical as compared to freshwater temperate species (Fig. 2) renders the former especially vulnerable to future warming, in particular to extreme events23,24 (Fig. 1). This will negatively affect the vulnerability of freshwater tropical species living near their upper thermal limits4,6,7,25. Interspecific variability in thermal tolerance tends to be higher in freshwater than in marine species, particularly in temperate areas of the northern Hemisphere4. This is likely because freshwater species are distributed across limited latitudinal ranges, while marine species have wider latitudinal ranges, giving rise to a relatively invariant thermal tolerances at the faunal level4. This difference in variability of thermal tolerance among species in freshwater vs marine habitats may reflect in a higher variability within species in temperate freshwater species. Therefore, local thermal conditions experienced by species are determinant in setting the natural individual variation within populations.
The fact that variation in thermal tolerance was greater in the northern compared to southern hemisphere could be the result of two phenomena: (1) greater thermal variability in the northern hemisphere4,6; or (2) a relative paucity of data for the southern hemisphere26. Nevertheless, there was no effect of hemisphere on intraspecific variation in CTmax.
We found a significant interaction effect between latitudinal group and ΔT. Tropical species with high ΔT showed a larger intraspecific variation in CTmax. Lower acclimation temperatures allowed to set an extended range of variation in CTmax. We suggest that low acclimation temperatures provided a certain thermal plasticity and allowed scope for thermal variation.
CTmax was negatively linked to S.D. CTmax in fishes. This reveals a ceiling to thermal plasticity capacity in fishes. This might explain why tropical species show lower S.D. CTmax as they have higher CTmax than temperate species. At the highest upper thermal tolerance limits, fishes are not able to express a large range of thermal resilience variation within species15.
In this study, we decided to choose the low or mid-range acclimation temperatures to collect the standard deviation of CTmax. The reason why we did not take the highest acclimation temperatures tested over the studies, is that they can be different according to if the species is temperate or tropical. They can be higher for tropical species and display different results compared to temperate species. We chose not to standardize the SD CTmax values to a common acclimation temperature, because we were more interested in using the real values from the studies.
The strong phylogenetic signal for the extent of intraspecific variation in CTmax is presumably because many families contain species with a relatively common history of thermal adaptation (Fig. 4). That is, they have occupied similar thermal regimes within temperate or tropical habitats. In particular, there is a latitudinal effect on family distributions, with some families only being present in temperate (e.g. Gadidae) or tropical (e.g. Apogonidae) habitats, although some cosmopolitan families have species in both (e.g. Gobiidea, Blennidae) (Figure S2). In addition to the geographic collinearity that may be occurring with some families, the phylogenetically based differences in intraspecific variation among species may cause evolutionary constraints on evolvability in the face of ongoing warming and exposure to extreme events in freshwaters. The extent of such constraints is not clear and would depend on the exact genes affecting thermal tolerance and how these are represented within each family11. Further highlighting how temperature regime may shape evolutionary trajectories within closely related species or those with a common ancestor, with potential consequences for their vulnerability to thermal stress27–30.
This evidence for higher vulnerability of tropical species to climate variability and extreme warming events31 may have numerous ecological implications beyond simple tolerance thresholds. Freshwater tropical species may be obliged to seek thermal refugia in colder areas if these are available, potentially changing community structures9,32; such distribution shifts could have major ecological consequences33,34. Overall, the extent of intraspecific variation in CTmax must be considered in models that project impacts of warming on fishes. Intraspecific variation for tolerance in other environmental conditions such as hypoxia and acidification would be the next step for future research. Further research should focus on the mechanisms that underly latitudinal variation in CTmax and whether these reflect universal principles across all species.
Methods
Dataset and data selection process
We used the data on CTmax in marine, brackish and freshwater fish species (2722 observations unimputed data set) published by4. We performed a three-step selection procedure to identify the species for this study. First, we excluded data where CTmax was measured using death as an endpoint (1256 observations) as these do not correspond to the accepted definition of CTmax (loss of equilibrium but not death)35, so the temperatures recorded will have exceeded the critical threshold. Second, we excluded polar species because of the sample size (n = 5) and discarded brackish water species because no indication was given about the nature of the brackish habitat (e.g. lagoon, estuary or others). Third, several species were tested at different acclimation temperatures resulting in multiple CTmax measures for the same species. We therefore took CTmax values measured at the lowest or mid-point tested acclimation temperature with the largest sample size of individuals used. This data selection procedure produced a dataset of 203 fish species for which we have S.D. of their CTmax (standard deviation).
Calculation of delta temperature
We calculated the ΔT
The ΔT defines the distance from thermal acclimation (Ta) to thermal tolerance limit (TCTmax), providing an index of vulnerability to acute heating10 and of thermal acclimation capacity. In other studies, ΔT is defined as the difference between the highest experienced summer temperature and the CTmax and referred to as thermal safety margins. In our study we use thermal acclimation temperature and decided to define ΔT based on the difference between CTmax and thermal acclimation temperature. This accounts for the fact that acclimation temperature is often asymptotically linked to CTmax15,36.
Data analysis
Analyses and models were made in R (4.0.2, R Foundation for Statistical Computing) using the phylogenetic generalized least squared method37,38 (PGLS) with caper package39. Model selection was completed by AIC values using the AIC function estimating the best model fit with the lowest AIC value (see Suppl. Table 1). The phylogeny of 203 fish species was found and generated from the comprehension tree of life (Fig. 4)40 using the “rotl” package41. A measure of phylogenetic correlation, λ, the degree to which this trait evolution deviates from Brownian motion42, was evaluated by fitting PGLS models with different values of λ to find that which maximized the log-likelihood of the best-fitted model. The level of statistical significance was set at alpha = 0.05.
Phylogenetic analysis
This was performed by PGLS on the 203 species’ specific geographical location, habitat, ΔT, CTmax and number of individuals measured. As fishes’ physiology is dependent on the environmental thermal conditions, hemisphere was incorporated into the model because of the significant differences in thermal variability between the two hemispheres6, with the north having higher thermal variation than the south26. Due to the effects of local thermal variation on fish thermal physiology, we included an interaction term between latitudinal groups (tropical versus temperate) and the ΔT (suppl. Table 2). Two further interaction terms were included in the model between latitudinal groups with hemisphere and habitat type (freshwater versus marine). We also conducted general linear model (GLM) analysis to exclude the effect of phylogeny on the outcome of the observed variation in log10 S.D.CTmax, testing the individual effects of our variables in the model (suppl. Table 3) and comparing the outcoming results to PGLS analysis. As heating rate can also influence the intraspecific variation in CTmax, we ran a supplementary PGLS analysis on 186 species including heating rate in the selected model (suppl. Table 4).
Supplementary Information
Acknowledgements
The authors would like to thank the two anonymous reviewers for their comments and feedbacks which undoubtedly improved the manuscript.
Author contributions
J.J.H.N., M.B.S.S., S.M., S.S.K., J.F.S., D.J.M., P.D. designed the study. J.J.H.N. and S.S.K. performed the statistical analyses. J.J.H.N. wrote the manuscript. J.J.H.N., M.B.S.S., S.M., S.S.K., J.F.S., D.J.M., P. Domenici revised the manuscript.
Funding
Funding was provided by (Aides à la Formation Recherche doctoral grant from the Fonds National de la Recherche Luxembourg [Grant number: 4005263], NERC Advanced Fellowship [Grant number: NE/J019100/1], European Research Council Starting Grant [Grant number: 640004]), European Union’s Horizon 2020 research and innovation program under the grant agreement No. 773713 (PANDORA).
Competing interests
The authors declare no competing interests.
Footnotes
Publisher's note
Springer Nature remains neutral with regard to jurisdictional claims in published maps and institutional affiliations.
Supplementary Information
The online version contains supplementary material available at 10.1038/s41598-021-00695-8.
References
- 1.Frölicher TL, Fischer EM, Gruber N. Marine heatwaves under global warming. Nature. 2018;560:360–364. doi: 10.1038/s41586-018-0383-9. [DOI] [PubMed] [Google Scholar]
- 2.Stillman JH. Heat waves, the new normal: Summertime temperature extremes will impact animals, ecosystems, and human communities. Physiology. 2019;34:86–100. doi: 10.1152/physiol.00040.2018. [DOI] [PubMed] [Google Scholar]
- 3.Williams CM, et al. Biological impacts of thermal extremes: Mechanisms and costs of functional responses matter. Integr. Comp. Biol. 2016;56:73–84. doi: 10.1093/icb/icw013. [DOI] [PubMed] [Google Scholar]
- 4.Comte L, Olden JD. Climatic vulnerability of the world’s freshwater and marine fishes. Nat. Clim. Chang. 2017;7:718–722. doi: 10.1038/nclimate3382. [DOI] [Google Scholar]
- 5.Dahlke FT, Wohlrab S, Butzin M, Pörtner HO. Thermal bottlenecks in the life cycle define climate vulnerability of fish. Science. 2020;369:65–70. doi: 10.1126/science.aaz3658. [DOI] [PubMed] [Google Scholar]
- 6.Sunday JM, Bates AE, Dulvy NK. Global analysis of thermal tolerance and latitude in ectotherms. Proc. R. Soc. B Biol. Sci. 2011;278:1823–1830. doi: 10.1098/rspb.2010.1295. [DOI] [PMC free article] [PubMed] [Google Scholar]
- 7.Rummer JL, et al. Life on the edge: Thermal optima for aerobic scope of equatorial reef fishes are close to current day temperatures. Glob. Chang. Biol. 2014;20:1055–1066. doi: 10.1111/gcb.12455. [DOI] [PMC free article] [PubMed] [Google Scholar]
- 8.Stuart-Smith RD, Edgar GJ, Barrett NS, Kininmonth SJ, Bates AE. Thermal biases and vulnerability to warming in the world's marine fauna. Nature. 2015;528:88–92. doi: 10.1038/nature16144. [DOI] [PubMed] [Google Scholar]
- 9.Pinsky ML, Eikeset AM, McCauley DJ, Payne JL, Sunday JM. Greater vulnerability to warming of marine versus terrestrial ectotherms. Nature. 2019;569:108–111. doi: 10.1038/s41586-019-1132-4. [DOI] [PubMed] [Google Scholar]
- 10.Bennett S, Duarte CM, Marbà N, Wernberg T. Integrating within-species variation in thermal physiology into climate change ecology. Philos. Trans. R. Soc. B Biol. Sci. 2019;374:20180550. doi: 10.1098/rstb.2018.0550. [DOI] [PMC free article] [PubMed] [Google Scholar]
- 11.Comte L, Olden JD. Evolutionary and environmental determinants of freshwater fish thermal tolerance and plasticity. Glob. Chang. Biol. 2017;23:728–736. doi: 10.1111/gcb.13427. [DOI] [PubMed] [Google Scholar]
- 12.Bolnick DI, et al. Why intraspecific trait variation matters in community ecology. Trends Ecol. Evol. 2011;26:183–192. doi: 10.1016/j.tree.2011.01.009. [DOI] [PMC free article] [PubMed] [Google Scholar]
- 13.Pacifici M, et al. Assessing species vulnerability to climate change. Nat. Clim. Chang. 2015;5:215–225. doi: 10.1038/nclimate2448. [DOI] [Google Scholar]
- 14.Moran EV, Hartig F, Bell DM. Intraspecific trait variation across scales: Implications for understanding global change responses. Glob. Change Biol. 2016;22:137–150. doi: 10.1111/gcb.13000. [DOI] [PubMed] [Google Scholar]
- 15.McKenzie DJ, et al. Intraspecific variation in tolerance of warming in fishes. J. Fish Biol. 2020;98:1–20. doi: 10.1111/jfb.14620. [DOI] [PubMed] [Google Scholar]
- 16.Mimura M, et al. Understanding and monitoring the consequences of human impacts on intraspecific variation. Evol. Appl. 2017;10:121–139. doi: 10.1111/eva.12436. [DOI] [PMC free article] [PubMed] [Google Scholar]
- 17.Doyle CM, Leberg PL, Klerks PL. Heritability of heat tolerance in a small livebearing fish, Heterandria formosa. Ecotoxicology. 2011;20:535–542. doi: 10.1007/s10646-011-0624-2. [DOI] [PubMed] [Google Scholar]
- 18.Meffe GK, Weeks SC, Mulvey M, Kandl KL. Genetic differences in thermal tolerance of eastern mosquitofish (Gambusia holbrooki; Poeciliidae) from ambient and thermal ponds. Can. J. Fish. Aquat. Sci. 1995;52:2704–2711. doi: 10.1139/f95-259. [DOI] [Google Scholar]
- 19.Gradil KJ, Garner SR, Wilson CC, Farrell AP, Neff BD. Relationship between cardiac performance and environment across populations of Atlantic salmon (Salmo salar): A common garden experiment implicates local adaptation. Evol. Ecol. 2016;30:877–886. doi: 10.1007/s10682-016-9847-2. [DOI] [Google Scholar]
- 20.Fangue NA, Hofmeister M, Schulte PM. Intraspecific variation in thermal tolerance and heat shock protein gene expression in common killifish, Fundulus heteroclitus. J. Exp. Biol. 2006;209:2859–2872. doi: 10.1242/jeb.02260. [DOI] [PubMed] [Google Scholar]
- 21.Chen Z, Farrell AP, Matala A, Narum SR. Mechanisms of thermal adaptation and evolutionary potential of conspecific populations to changing environments. Mol. Ecol. 2018;27:659–674. doi: 10.1111/mec.14475. [DOI] [PubMed] [Google Scholar]
- 22.Chen Z, Farrell AP, Matala A, Hoffman N, Narum SR. Physiological and genomic signatures of evolutionary thermal adaptation in redband trout from extreme climates. Evol. Appl. 2018;11:1686–1699. doi: 10.1111/eva.12672. [DOI] [PMC free article] [PubMed] [Google Scholar]
- 23.Oliver TH, et al. Biodiversity and resilience of ecosystem functions. Trends Ecol. Evol. 2015;30:673–684. doi: 10.1016/j.tree.2015.08.009. [DOI] [PubMed] [Google Scholar]
- 24.Mori AS, Furukawa T, Sasaki T. Response diversity determines the resilience of ecosystems to environmental change. Biol. Rev. 2013;88:349–364. doi: 10.1111/brv.12004. [DOI] [PubMed] [Google Scholar]
- 25.Rodgers GG, Donelson JM, McCormick MI, Munday PL. In hot water: Sustained ocean warming reduces survival of a low-latitude coral reef fish. Mar. Biol. 2018;165:1–10. doi: 10.1007/s00227-018-3333-z. [DOI] [Google Scholar]
- 26.Seebacher F, White CR, Franklin CE. Physiological plasticity increases resilience of ectothermic animals to climate change. Nat. Clim. Chang. 2015;5:61–66. doi: 10.1038/nclimate2457. [DOI] [Google Scholar]
- 27.Meffe GK, Weeks SC, Mulvey M, Kandl KL. Genetic differences in thermal tolerance of eastern mosquitofish (Gambusia holbrooki; Poeciliidae) from ambient and thermal ponds. Can. J. Fish. Aquat. Sci. 1995;52(12):2704–2711. doi: 10.1139/f95-259. [DOI] [Google Scholar]
- 28.Baer CF, Travis J. Direct and correlated responses to artificial selection on acute thermal stress tolerance in a livebearing fish. Evolution. 2000;54(1):238–244. doi: 10.1111/j.0014-3820.2000.tb00024.x. [DOI] [PubMed] [Google Scholar]
- 29.Klerks PL, Athrey GN, Leberg PL. Response to selection for increased heat tolerance in a small fish species, with the response decreased by a population bottleneck. Front. Ecol. Evol. 2019;7:270. doi: 10.3389/fevo.2019.00270. [DOI] [Google Scholar]
- 30.Morgan R, Finnøen MH, Jensen H, Pélabon C, Jutfelt F. Low potential for evolutionary rescue from climate change in a tropical fish. Proc. R. Soc. B Biol. Sci. 2020;117(52):33365–33372. doi: 10.1073/pnas.2011419117. [DOI] [PMC free article] [PubMed] [Google Scholar]
- 31.Frölicher, T. L. Extreme climatic events in the ocean. In Predicting Future Oceans: Sustainability of Ocean and Human Systems Amidst Global Environmental Change (eds Cisneros-Montemayor A. M. et al.) 53–60 (2019).
- 32.Wernberg T, et al. An extreme climatic event alters marine ecosystem structure in a global biodiversity hotspot. Nat. Clim. Chang. 2013;3(1):78–82. doi: 10.1038/nclimate1627. [DOI] [Google Scholar]
- 33.Burrows MT, et al. Geographical limits to species-range shifts are suggested by climate velocity. Nature. 2014;507(7493):492–495. doi: 10.1038/nature12976. [DOI] [PubMed] [Google Scholar]
- 34.Molinos JG, et al. Climate velocity and the future global redistribution of marine biodiversity. Nat. Clim. Chang. 2016;6(1):83–88. doi: 10.1038/nclimate2769. [DOI] [Google Scholar]
- 35.Cox DK. Effects of three heating rates on the critical thermal maximum of bluegill. In: Gibbons JW, Sharitz RR, editors. Thermal Ecology. National Technical Information Service; 1974. [Google Scholar]
- 36.Currie S, Schulte PM. Thermal stress. In: Evans DH, Claiborne J, Currie S, editors. The Physiology of Fishes. 4. CRC Press; 2014. pp. 257–279. [Google Scholar]
- 37.Grafen A. The phlyogenetic regression. Philos. Trans. R. Soc. Lond. 1989;326:119–157. doi: 10.1098/rstb.1989.0106. [DOI] [PubMed] [Google Scholar]
- 38.Garland T, Jr, Ives AR. Using the past to predict the present: Confidence intervals for regression equations in phylogenetic comparative methods. Am. Nat. 2000;155:346–364. doi: 10.1086/303327. [DOI] [PubMed] [Google Scholar]
- 39.Orme, D. The caper package: comparative analysis of phylogenetics and evolution in R http://cran.r-project.org/web/packages/caper/index.html (2013).
- 40.Hinchliff CE, et al. Synthesis of phylogeny and taxonomy into a comprehensive tree of life. Proc. Natl. Acad. Sci. 2015;112(41):12764–12769. doi: 10.1073/pnas.1423041112. [DOI] [PMC free article] [PubMed] [Google Scholar]
- 41.Michonneau F, Brown JW, Winter DJ. rotl: An R package to interact with the Open Tree of Life data. Methods Ecol. Evol. 2016;7:1476–1481. doi: 10.1111/2041-210X.12593. [DOI] [Google Scholar]
- 42.Freckleton RP. The seven deadly sins of comparative analysis. J. Evol. Biol. 2009;22:1367–1375. doi: 10.1111/j.1420-9101.2009.01757.x. [DOI] [PubMed] [Google Scholar]
Associated Data
This section collects any data citations, data availability statements, or supplementary materials included in this article.