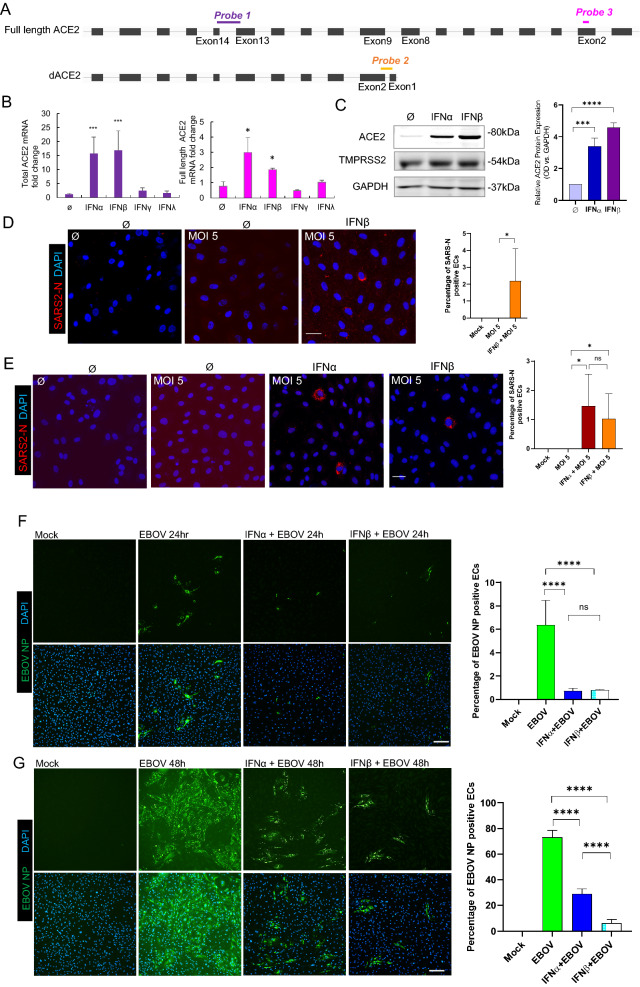
Fig. 6.
SARS-CoV-2 or Ebola virus infection of human primary PAECs after IFNα or β stimulation. A Schematic representation of ACE2 and delta ACE2(dACE2) transcripts and the position of the three PCR probes to generate wildtype ACE2, delta(d)ACE2 and full length ACE2 amplicons. B Expression of total ACE2 (left) and expression of full length ACE2 (right) in three PMECs after treated with IFNα, β, γ, λ for 6 h. C Representative Western blot results of ACE2 and TMPRSS2 protein expression in PAECs treated with IFNα or β for 24 h. 60 μg total protein was loaded in each lane. GAPDH serves as a loading control. Optical Density (OD) quantification of ACE2 protein levels vs GAPDH. Means ± SEM are from three biological replicates. D Immunofluorescence images of viral nucleoprotein (SARS2-N, red) of PAECs infected with SARS-CoV-2 (MOI = 5) at 1 day post infection (200X magnification). Left: Mock; middle: no IFNβ; right: IFNβ 24 h. Bar = 20 µm. E Immunofluorescence images of viral nucleoprotein (SARS2-N, red) of PAECs infected with recombinant SARS-CoV-2-mNeonGreen (MOI = 5) at 1 day post infection (200× magnification). Left: Mock; middle left: no IFN; middle right: IFNα; right: IFNβ 24 h. Bar = 20 µm. F Immunofluorescence images of viral nucleoprotein (EBOV NP, green) of PAECs at 24 h post infection or at 48 h post infection (G). Cells were pretreated with IFNs for 24 h and infected with wildtype Ebola virus (EBOV) (MOI = 5) Left: Mock; middle left: no IFN; middle right: IFNα; right: IFNβ. Bar = 50 µm. Quantification (both D, E, F and G) of the number of positive SARS2-N or EBOV NP (cytoplasmic positive staining along with a nuclear DAPI staining) versus the total number of cells (the number of positive nuclear DAPI staining). Means ± SEM are calculated on six images from random fields with two technical replicates. *p < 0.05, ***p < 0.001 and ****p < 0.0001 compared to its control, unpaired t test

