

Abstract
Background
Myocardial injury after noncardiac surgery (MINS) is associated with increased postoperative mortality, but the relevant perioperative factors that contribute to the mortality of patients with MINS have not been fully evaluated.
Objective
To establish a comprehensive body of knowledge relating to patients with MINS, we researched the best performing predictive model based on machine learning algorithms.
Methods
Using clinical data from 7629 patients with MINS from the clinical data warehouse, we evaluated 8 machine learning algorithms for accuracy, precision, recall, F1 score, area under the receiver operating characteristic (AUROC) curve, and area under the precision-recall curve to investigate the best model for predicting mortality. Feature importance and Shapley Additive Explanations values were analyzed to explain the role of each clinical factor in patients with MINS.
Results
Extreme gradient boosting outperformed the other models. The model showed an AUROC of 0.923 (95% CI 0.916-0.930). The AUROC of the model did not decrease in the test data set (0.894, 95% CI 0.86-0.922; P=.06). Antiplatelet drugs prescription, elevated C-reactive protein level, and beta blocker prescription were associated with reduced 30-day mortality.
Conclusions
Predicting the mortality of patients with MINS was shown to be feasible using machine learning. By analyzing the impact of predictors, markers that should be cautiously monitored by clinicians may be identified.
Keywords: myocardial injury after noncardiac surgery, high-sensitivity cardiac troponin, machine learning, extreme gradient boosting
Introduction
Myocardial injury after noncardiac surgery (MINS) is associated with cardiovascular events and fivefold increased postoperative mortality, affecting up to the first 2 years after surgery [1]. Recently, MINS is accepted as the leading cause of postoperative mortality [2,3]. Along with the increased risk of mortality, the prevalence is also high, reported to be above 20% [2,3]. Many previous studies have reported risk factors for the occurrence of MINS [4-7], but relatively less attention has been given to perioperative factors that are associated with mortality in patients who were diagnosed with MINS. We reported perioperative factors that affect mortality after MINS [8-11]. However, our previous studies evaluated variables independently and not in a comprehensive manner.
In this study, we trained and evaluated machine learning models by leveraging the risk factors of patients with MINS and aimed to find a model with the best performance. Furthermore, we validated the performance of the model with the test data set that was curated by the same method with the training data set. By quantifying and comparing the effect of each variable on the predictive performance of the model, we developed a mobile app that predicts mortality in patients with MINS. Our findings may benefit a comprehensive understanding of patient characteristics related to mortality in patients with MINS.
Methods
The Institutional Review Board at Samsung Medical Center forwent the approval for this study and the necessity to obtain informed consent for access to the Samsung Medical Center Troponin in Noncardiac Operation (SMC-TINCO) registry (SMC 2019-08-048) and the test data set for validation (SMC 2021-03-187), considering that both data sets were curated in deidentified form.
Study Population and Data Curation
Samsung Medical Center is a tertiary referral center with nearly 2000 beds and more than 49,000 cases of surgeries performed every year. Additionally, they provide the clinical data warehouse called “Darwin-C,” which allows any researcher in the institution to automatically extract the deidentified data from this electronic medical record archive system (Multimedia Appendix 1). Using the “Darwin-C” system, we generated the SMC-TINCO registry (KCT0004244) and used it in this study. The SMC-TINCO contains consecutive data of 43,019 patients who had at least one inspection of cTn-I before or within 30 days after noncardiac surgery from January 2010 to June 2019.
The medical history was summarized by reviewing the preoperative assessment sheet, and the names and meanings of 44 features in the data sets are listed in Multimedia Appendix 2. The death state of the clinical data warehouse is consistently validated and updated from the National Population Registry of the Korea National Statistical Office.
The routine cTn-I assay of SMC was institutionally updated to high-sensitivity cTn-T from July 2019. Based on this change, we generated a data set for testing the model. The data set consists of 6246 adult patients who had postoperative high-sensitivity cTn-T measured within 30 days after noncardiac surgery between July 2019 and January 2021.
Definitions and Study End Points
MINS was defined as peak postoperative cTn elevation above the 99th percentile of the normal limit within 30 days after surgery, but those with evidence of nonischemic etiology such as sepsis, pulmonary embolus, atrial fibrillation, cardioversion, or chronic elevation were not regarded as MINS based on the recent diagnostic criteria [12]. High-risk surgery was identified based on the 2014 European Society of Cardiology/Anesthesiology guidelines [13].
The primary end point was the predictability of 30-day mortality of patients with MINS based on perioperative factors. For the secondary outcome, we also evaluated the predictability of 1-year mortality.
Perioperative Management and cTn Measurements
According to the institutional guidelines, postoperative cTn measurement is not an institutional routine practice. It is performed selectively on patients with one or more of the following major cardiovascular risk factors: heart failure, history of ischemic heart disease, stroke including transient ischemic attack, chronic kidney disease, diabetes mellitus on insulin therapy, or high-risk surgery, but symptoms may be determined at the discretion of the clinician [13].
An immunoassay (Advia Centaur XP, Siemens Healthcare Diagnostics, Erlangen, Germany) with high sensitivity was used for cTn-I. The lower detection limit was 6 ng/L, and 40 ng/L of the 99th percentile was the reference upper limit, as reported by the manufacturer [14]. In the test data set, a high-sensitivity assay of cTn-T (Elecsys, Roche, Basel, Switzerland) was analyzed using cobas e801 (Roche). The 99th percentile reference upper limit for hs-cTn-T was 14 ng/L.
Development of Prediction Models
To compare the performance of prediction models, we investigated the eight widely used machine learning algorithms: extreme gradient boosting (XGB), generalized boosted regression model (GBM), random forests (RF), support vector machines (SVM), classification and regression trees (CART), linear discriminant analysis (LDA), lasso/ridge/elastic net (GLMNET), and k-nearest neighbors (kNN). The hyperparameters of each model were optimized based on a grid search using the area under the receiver operating characteristic (AUROC). Fivefold cross-validation was used in the model development. We evaluated each model according to the accuracy, precision, recall, F1 score, AUROC, and area under the precision and recall curve (AUPRC) values (Multimedia Appendix 3). We validated the performance of the trained model using a new test data set.
Feature importance and Shapley Additive Explanations (SHAP) values were used to present the impact of each feature on the performance of the prediction model. SHAP values show the characteristic of deriving a marginal distribution and weighted average by fixing all variables except one and randomly predicting that one to determine its importance [15]. Features are sorted in descending order by which the model contributes to classifying the data. Each patient was represented by one dot on each variable line. The horizontal location of each dot indicated whether the effect of a variable was associated with a higher or lower probability of death. The area on the right indicates the point where SHAP value is greater than zero. Variable-specific SHAP values >0 indicate an increased risk of death.
Statistical Analysis
Differences were compared using t tests and presented as means and SDs in two-group comparisons. Categorical features were presented as numbers with percentages and compared using chi-square or Fisher exact tests. Statistical analyses were performed using R 3.6.3 (R Foundation for Statistical Computing). All tests were two-tailed, and P<.05 was considered to indicate statistical significance.
Results
Patient Characteristics
In accordance with the definition of MINS, patients younger than 18 years were excluded from the data sets. Patients who did not have troponin measured after surgery or had abnormal levels and nonischemic etiology, such as chest compression, were also excluded (Figure 1). The baseline characteristics of the study patients with MINS are presented in Table 1. The age and gender of the patients in the training and test data sets showed a similar distribution (Multimedia Appendix 4), but the distribution of surgical types was slightly different. The number of patients in gynecology and urology in the test data set was increased, and other surgeries such as donor transplantation and bronchial dilation also varied (Multimedia Appendix 5). The type of surgery performed on patients in each data set and their mortality are presented in Multimedia Appendix 6.
Figure 1.
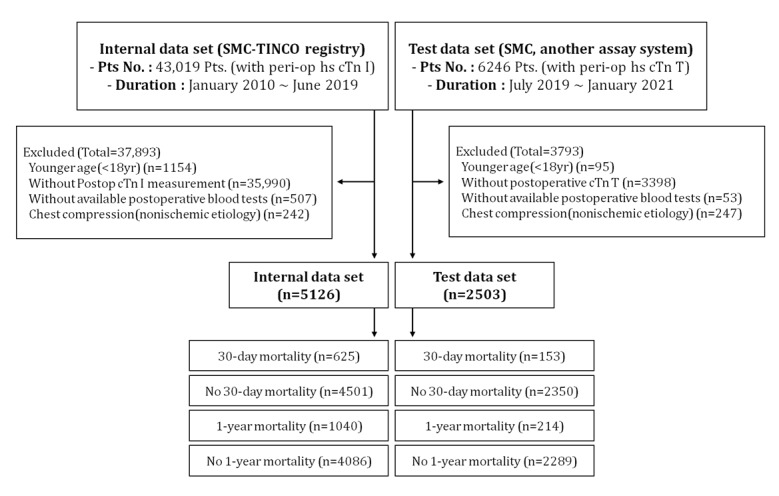
A flowchart of our retrospective study design. peri-op hs cTn I: perioperative high-sensitivity cTn-I; peri-op hs cTn T: perioperative high-sensitivity cTn-T; Pts: patients; SMN-TINCO: Samsung Medical Center Troponin in Noncardiac Operation.
Table 1.
Baseline characteristics of patients with myocardial injury after noncardiac surgery according to 30-day mortality.
|
|
Training data set | Test data set | ||||||
|
|
No 30-day mortality (n=4501) | 30-day mortality (n=625) | P value | No 30-day mortality (n=2350) | 30-day mortality (n=153) | P value | ||
| Peak cardiac troponin level (ng/L), mean (SD) | 2.3 (19.7) | 7.2 (31.7) | <.001 | 0.1 (0.7) | 0.6 (3.4) | .10 | ||
| Male, n (%) | 2673 (59.4) | 394 (63.0) | .09 | 1526 (64.9) | 89 (58.2) | .12 | ||
| Age (years), mean (SD) | 65.7 (13.8) | 63.1 (14.2) | <.001 | 68.2 (12.8) | 63.3 (13.6) | <.001 | ||
| BMI, mean (SD) | 23.7 (3.8) | 22.9 (3.5) | <.001 | 24.0 (3.8) | 22.7 (3.9) | <.001 | ||
| Diabetes, n (%) | 2480 (55.1) | 363 (58.1) | .17 | 752 (32.0) | 34 (22.2) | .02 | ||
| Hypertension, n (%) | 2994 (66.5) | 378 (60.5) | .003 | 1209 (51.4) | 55 (35.9) | <.001 | ||
| Chronic kidney disease, n (%) | 575 (12.8) | 85 (13.6) | .61 | 429 (18.3) | 21 (13.7) | .19 | ||
| Dialysis, n (%) | 231 (5.1) | 47 (7.5) | .02 | 159 (6.8) | 7 (4.6) | .38 | ||
| Current smoking, n (%) | 396 (8.8) | 58 (9.3) | .75 | 157 (6.7) | 16 (10.5) | .11 | ||
| Current alcohol, n (%) | 660 (14.7) | 89 (14.2) | .83 | 260 (11.1) | 15 (9.8) | .73 | ||
| Coronary artery disease, n (%) | 1059 (23.5) | 111 (17.8) | .002 | 430 (18.3) | 11 (7.2) | .001 | ||
| Previous disease | ||||||||
|
|
Old myocardial infarction, n (%) | 388 (8.6) | 60 (9.6) | .46 | 215 (9.1) | 12 (7.8) | .69 | |
|
|
History of coronary intervention, n (%) | 530 (11.8) | 36 (5.8) | <.001 | 304 (12.9) | 10 (6.5) | .03 | |
|
|
History of coronary artery bypass graft, n (%) | 120 (2.7) | 17 (2.7) | >.99 | 66 (2.8) | 4 (2.6) | >.99 | |
|
|
Heart failure, n (%) | 174 (3.9) | 14 (2.2) | .06 | 66 (2.8) | 5 (3.3) | .94 | |
|
|
Stroke, n (%) | 415 (9.2) | 78 (12.5) | .01 | 253 (10.8) | 17 (11.1) | >.99 | |
|
|
Atrial fibrillation, n (%) | 356 (7.9) | 55 (8.8) | .49 | 169 (7.2) | 8 (5.2) | .45 | |
|
|
Arrhythmia, n (%) | 453 (10.1) | 63 (10.1) | >.99 | 229 (9.7) | 12 (7.8) | .53 | |
|
|
Valvular heart disease, n (%) | 95 (2.1) | 8 (1.3) | .22 | 117 (5.0) | 8 (5.2) | >.99 | |
|
|
Aortic disease, n (%) | 136 (3.0) | 14 (2.2) | .34 | 145 (6.2) | 5 (3.3) | .20 | |
|
|
Peripheral arterial disease, n (%) | 146 (3.2) | 11 (1.8) | .06 | 91 (3.9) | 7 (4.6) | .83 | |
|
|
Chronic pulmonary disease, n (%) | 282 (6.3) | 32 (5.1) | .30 | 206 (8.8) | 9 (5.9) | .28 | |
|
|
Active cancer, n (%) | 1751 (38.9) | 262 (41.9) | .16 | 798 (34.0) | 34 (22.2) | .004 | |
|
|
Charlson score, mean (SD) | 3.2 (2.2) | 3.8 (2.3) | <.001 | 2.1 (2.1) | 1.6 (1.7) | <.001 | |
| Operative variables | ||||||||
|
|
ESCa/ESAb surgical high risk, n (%) | 1216 (27.0) | 143 (22.9) | .03 | 524 (22.3) | 38 (24.8) | .53 | |
|
|
Emergency operation, n (%) | 1167 (25.9) | 318 (50.9) | <.001 | 483 (20.6) | 83 (54.2) | <.001 | |
|
|
General anesthesia, n (%) | 3947 (87.7) | 528 (84.5) | .03 | 2047 (87.1) | 128 (83.7) | .27 | |
|
|
Operation duration (hours), mean (SD) | 3.7 (2.8) | 3.1 (2.8) | <.001 | 3.0 (2.2) | 2.7 (2.3) | .12 | |
|
|
Packed red blood cell transfusion, n (%) | 695 (15.4) | 112 (17.9) | .13 | 0.5 (1.5) | 1.1 (2.0) | <.001 | |
| Postoperative in-hospital events | ||||||||
|
|
Type I myocardial infarction, n (%) | 104 (2.3) | 16 (2.6) | .81 | 8 (0.3) | 2 (1.3) | .24 | |
|
|
Coronary revascularization, n (%) | 151 (3.4) | 11 (1.8) | .04 | 28 (1.2) | 2 (1.3) | >.99 | |
|
|
Percutaneous coronary intervention, n (%) | 134 (3.0) | 8 (1.3) | .02 | 27 (1.1) | 2 (1.3) | >.99 | |
|
|
C-reactive protein level at discharge, mean (SD) | 3.6 (4.0) | 9.7 (8.8) | <.001 | 3.6 (4.4) | 10.1 (8.7) | <.001 | |
| Medication at discharge, n (%) | ||||||||
|
|
Beta blocker | 1031 (22.9) | 13 (2.1) | <.001 | 294 (12.5) | 5 (3.3) | .001 | |
|
|
Calcium channel blocker | 1224 (27.2) | 21 (3.4) | <.001 | 800 (34.0) | 18 (11.8) | <.001 | |
|
|
Diltiazem | 384 (8.5) | 14 (2.2) | <.001 | 125 (5.3) | 1 (0.7) | .02 | |
|
|
Stain | 1165 (25.9) | 12 (1.9) | <.001 | 933 (39.7) | 9 (5.9) | <.001 | |
|
|
Metformin | 497 (11.0) | 26 (4.2) | <.001 | 474 (20.2) | 7 (4.6) | <.001 | |
|
|
Insulin | 1127 (25.0) | 335 (53.6) | <.001 | 636 (27.1) | 73 (47.7) | <.001 | |
|
|
Antiplatelet | 1515 (33.7) | 10 (1.6) | <.001 | 798 (34.0) | 9 (5.9) | <.001 | |
|
|
Renin angiotensin aldosterone system inhibitor | 1105 (24.6) | 20 (3.2) | <.001 | 677 (28.8) | 9 (5.9) | <.001 | |
|
|
Direct oral anticoagulant | 211 (4.7) | 3 (0.5) | <.001 | 6 (0.3) | 0 (0.0) | >.99 | |
aESC: European Society of Cardiology.
bESA: European Society of Anaesthesiology
Development of a 30-Day Mortality Prediction Model
The probability of developing a 30-day mortality prediction model was explored using 8 machine learning algorithms. The hyperparameters optimized using grid search are summarized in Multimedia Appendix 7. The performance of each model is displayed using AUROC and AUPRC plots (Multimedia Appendix 8) along with various indexes (Multimedia Appendix 9). The performance of the kNN, CART, LDA, SVM, GLMNET, and GBM models was lower than that of the RF and XGB models. The RF and XGB models showed comparable performances. The AUROC of the RF model (0.927) was higher than that of the XGB model (0.923) in the training phase. However, the AUPRC of the RF model (0.747) was lower than that of the XGB model (0.763). Additionally, the F1 score and balanced accuracy of the XGB model (0.678 and 0.784) were higher than those of the RF model (0.549 and 0.695). When the models were comprehensively evaluated, the XGB model was selected as the best performing model for predicting the 30-day mortality of patients with MINS (Figure 2).
Figure 2.
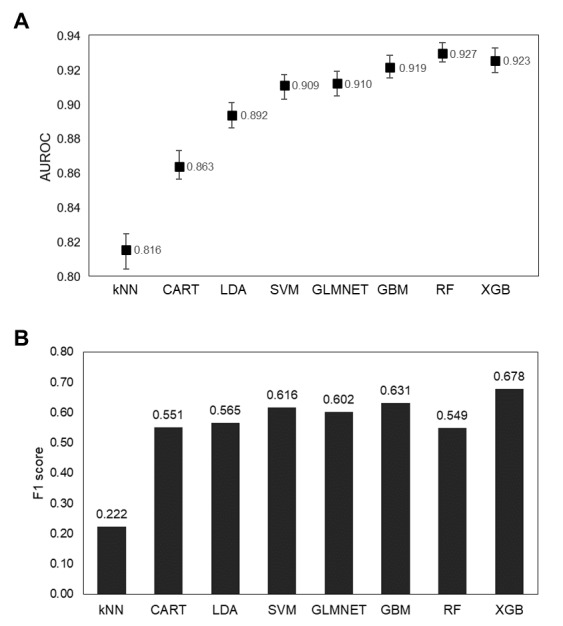
Performance comparison of each 30-day mortality prediction model with the range of (A) AUROC and (B) F1 score. AUROC: area under the receiver operating characteristic; CART: classification and regression trees; GBM: generalized boosted regression model; GLMNET: lasso/ridge/elastic net; kNN: k-nearest neighbors; LDA: linear discriminant analysis; RF: random forests; SVM: support vector machines; XGB: extreme gradient boosting.
XGB 30-Day Mortality Prediction Model Interpretation
We tried to enable models to be actively accommodated by securing an interpretability and transparency. The importance of features in the XGB model is based on an algorithm that reduces based on the impurity index of the binary tree. The feature importance plot of the XGB 30-day mortality prediction model is shown in Multimedia Appendix 10. The top 5 features were C-reactive protein (CRP) level at discharge, antiplatelet prescription at discharge, peak cardiac troponin levels (ng/L), insulin prescription at discharge, and operation duration (hours).
The SHAP summary plot for the XGB models is shown in Figure 3. The XGB models determined that antiplatelet prescription at discharge was the most important variable, followed by CRP level at discharge, insulin prescription at discharge, beta blocker prescription at discharge, and peak cardiac troponin level (ng/L). According to the SHAP values of each feature, antiplatelet prescription at discharge was associated with a lower probability of death (left side of the vertical dotted lines). Higher CRP levels at discharge were associated with a higher probability of death. Insulin prescription at discharge was associated with higher probability of death. Additionally, a SHAP dependence plot was used to explain how a single feature affects the output of the XGB prediction model (Multimedia Appendix 11).
Figure 3.

SHAP summary plot of 30-day mortality prediction extreme gradient boosting model. According to the SHAP values of each feature, antiplatelet prescription at discharge (ie, purple dots) was associated with a lower probability of death (ie, the left side of the vertical dotted line). Higher C-reactive protein levels at discharge (ie, purple dots) were associated with a higher probability of death (ie, the right side of the vertical dotted line). Insulin prescription at discharge (ie, purple dots) was associated with a higher probability of death (ie, the right side of the vertical dotted line). CABG: coronary artery bypass graft; COPD: chronic obstructive pulmonary disease; ESA: European Society of Anaesthesiology; ESC: European Society of Cardiology; SHAP: Shapley Additive Explanations.
Lightening the Model Using Feature Selection
By reducing the number of variables required to use predictive models, we tried to make the model more acceptable in clinical practice. We used the recursive feature elimination (RFE) method to explore the relation between the number of features and performance. According to the RFE method, the accuracy of the model is best when the top 28 variables were used. However, the performance of the model was almost the same as when the top 10 variables were used (Multimedia Appendix 12). To minimize the number of variables input into the model, we observed the changes in performance while reducing the number of variables to 28, 10, and 5.
Light Model With 28 Variables
The list of the top 28 predictor variables chosen by the RFE method is shown in Multimedia Appendix 12. When the top 28 variables were used to train the model, the performance of the XGB model had an accuracy of 0.926, AUPRC of 0.754, and F1 score of 0.652 (Multimedia Appendix 13). The AUROC was 0.925 (95% CI 0.919-0.931) in the training phase and 0.908 (95% CI 0.877-0.932) in the test phase. The AUROC of the model did not significantly decrease on the test data set (P=.22; Multimedia Appendix 14).
Light Model With 10 Variables
The top 10 variables used to train the XGB model were “crp_predc,” “insulin_dc,” “x_antiplt_dc,” “peaktro,” “ccb_dc,” “emergencyop,” “opduration,” “statin_dc,” “bb_dc,” and “optype.” The XGB model had an accuracy of 0.920, AUPRC of 0.708, and F1 score of 0.616 (Multimedia Appendix 13). The AUROC was 0.911 (95% CI 0.904-0.918) in the training phase and 0.904 (95% CI 0.874-0.93) in the test phase. The AUROC of the model did not significantly decrease on the test data set (P=.65; Multimedia Appendix 14).
Light Model With 10 Variables Chosen for Clinical Prediction
We made another model using 10 variables chosen for clinical prediction. Currently used treatments for MINS include dabigatran, a type of direct-acting oral coagulant [16], and potential treatments include antiplatelet agents and statins. We aimed to create a predictive model after excluding these drugs from the variables. The 10 chosen variables used were “crp_predc,” “insulin_dc,” “peaktro,” “ccb_dc,” “ccb_dc,” “emergencyop,” “opduration,” “bb_dc,” “optype,” “x_raas_dc,” and “metformin_dc.” The XGB model had an accuracy of 0.916, AUPRC of 0.672, and F1 score of 0.587 (Multimedia Appendix 13). The AUROC was 0.894 (95% CI 0.887-0.902) in the training phase and 0.895 (95% CI 0.867-0.923) in the test phase. The AUROC of the XGB model did not significantly decrease on the test data set (P=.99; Multimedia Appendix 14).
Light Model With 5 Variables
Multimedia Appendix 12 shows that the prediction accuracy decreased by approximately 1.9% when the model used 5 variables compared to when the model used 28 variables. For users who have only a small amount of information about patients with MINS, we made a lighter model by selecting 5 variables based on the RFE’s feature order. The top 5 variables used were “crp_predc,” “insulin_dc,” “x_antiplt_dc,” “peaktro,” and “ccb_dc.” The XGB model had an accuracy of 0.907, AUPRC of 0.640, and F1 score of 0.505 (Multimedia Appendix 13). The AUROC was 0.890 (95% CI 0.882-0.898) in the training phase and 0.885 (95% CI 0.856-0.915) in the test phase. The AUROC of the model did not significantly decrease on the test data set (P=.80; Multimedia Appendix 14).
Development of a 1-Year Mortality Prediction Model
The AUROC of the 1-year mortality prediction XGB model was evaluated using the optimized hyperparameters eta=0.1, gamma=0, max tree depth=4, nround=100, colsample bytree=0.6, min child weight=1, and subsample=1. The AUROC of the model was 0.857 (95% CI 0.85-0.864) on the training data set and 0.794 (95% CI 0.756-0.826) on the test data set (Multimedia Appendix 15). The AUROC decreased on the test data set, and a statistically significant difference was observed compared to the AUROC of the training data set (P<.001). However, the prediction of the model is still valuable because the accuracy (0.95) on the test data set was above the no information rate (P=.001; Multimedia Appendix 16).
The feature importance plot of the 1-year mortality prediction model is shown in Multimedia Appendix 17. The top five features were the CRP level at discharge, peak cardiac troponin level (ng/L), operation duration (hours), antiplatelet prescription at discharge, and ucharlson score.
The SHAP summary plot for the models is shown in Multimedia Appendix 18. The XGB models determined that the CRP level at discharge was the most important variable, followed by the ucharlson score, antiplatelet prescription at discharge, insulin prescription at discharge, and operation duration (hours). According to the SHAP values of each feature, a higher CRP level at discharge and ucharlson score were associated with a higher probability of death. Antiplatelet prescription at discharge was associated with a lower probability of death, and insulin prescription at discharge was associated with a higher probability of death.
Development of an App With 30-Day Mortality Prediction XGB Model
The app, Leveraging R Shiny, was developed for practical use of the 30-day mortality prediction XGB model (Figure 4). Users can download the app for free via the public link [17]. Three versions of light models developed in this study are incorporated in the app: the top 10 features model, chosen 10 features model, and top 5 model. Each model was explored to find the optimal threshold for predicting patients at high risk of death. The optimized thresholds were applied to each model: 0.65 for the top 10 model; 0.53, chosen 10 model; and 0.68, top 5 model (Multimedia Appendix 19). Each user can choose a model type according to the type of variables that can be entered in a medical situation. A value for each variable corresponding to the target patient is entered and the Action button is pressed for probability output of the patient’s demise in 30 days. After adjusting certain variable values, clinicians can observe changes in mortality and apply them to treatment decisions.
Figure 4.

Internet app for predicting 30-day mortality of patients with MINS. CCB: calcium channel blockers; MINS: myocardial injury after noncardiac surgery.
Discussion
In this observational cohort study, we demonstrated the predictability of mortality in patients with MINS based on perioperative variables using a machine learning method.
Analysis of Model Performance Considering the Asymmetry of Data
To avoid overestimating the performance of the model, an imbalanced data set should be treated carefully when training a supervised classification machine learning model [18,19]. Along with accuracy, we wanted to interpret the performance of the model using indicators such as precision, recall, F1 score, AUPRC, and no information rate. In addition, for calibrating imbalanced data, four methods including oversampling, undersampling, both-sampling, and Random Over-Sampling Examples–sampling were carried out on the training data set, but the model’s performance was significantly reduced when the model was applied in the test data set; therefore, these methods were not accepted (data not shown).
Comparison of 30-Day and 1-Year Preference Model Performance
We investigated why the 1-year prediction performance was lower than the 30-day prediction in this study. First, predicting the distant future is harder than predicting the near future. From a clinical perspective, although MINS has been reported to be associated with mortality up to 2 years after surgery, more clinical events that affect mortality are likely to take place as the duration of follow-up extends. Additionally, the observation period of the patients who made up the test data set (1.5 years) was shorter than that of the training data set (9.5 years). The observation period of the test data set may have been too short to reflect the characteristics of a patient who died within 1 year.
Consideration of the SHAP Values of the Charlson Scores
We observed different relations to SHAP values between the original Charlson Comorbidity Index (CCI) scores and the updated CCI scores. The original CCI score shows a moderate proportional relationship with the SHAP value. However, the updated CCI score shows that the SHAP value increased rapidly in the low scores and was then maintained (Multimedia Appendix 20). It is assumed that the updated CCI score has changed the weights of cardiomyopathy, peripheral vascular disease, and cerebrovascular disease from 1 to 0.
Clinical Implications
MINS is the most common medical complication directly related to mortality [13]. The rapid detection and appropriate management of MINS affects many patients at risk of mortality. The only treatment that was established in randomized trials was direct oral anticoagulants [16]. However, strengthening of cardiovascular drugs such as aspirin, statins, and few types of hypertension drugs have been reported to be linked to reduced mortality in patients with MINS [10,20]. Our results, show that the prescription of cardiovascular drugs such as antiplatelet agents, antihypertensive drugs, and statins at discharge are effective in predicting MINS mortality. The CRP level as a degree of inflammation is linked with the prognosis of coronary artery disease [21] and shows a strong impact on the model, which is consistent with previous studies. Therefore, our findings regarding the mortality of patients with MINS may be predicted based on perioperative variables, suggesting the possibility of reducing the mortality of patients with MINS by correction of perioperative variables.
We were able to reduce the number of variables to 5 with affordable loss in performance. Using only 5 variables, it is possible to predict the mortality of patients with MINS with 90.7% accuracy. A smaller number of variables in the prediction model indicates that it is highly likely to be used in other hospitals. Hence, we see this result as an important clinical implication.
Limitations of the Study
Our study has a few limitations. First, model validation was performed using a test data set having a different time window from that of the data set used for training and internal validation. As a study using observational data collected in a single institution, our predictive models may have limited generalizability. Using a data set of patients with MINS visiting different institutions over the same period would allow for more appropriate external validation.
Second, our results might have been affected by selection bias and confounding factors. Postoperative hs-cTn measurements were not routine and optionally performed in patients with specific cardiovascular risks. Consequently, the possibility of selection bias may exist and should be considered if the user wants to apply the model in clinical practice.
Third, after confirming that mortality can be predicted using observational data, we created and released a mobile app for users. However, the predictive model developed in this study cannot be immediately used in routine clinical practice. We plan to conduct further research to measure the applicability of the model in clinical practice.
Conclusions
We have confirmed that a 30-day mortality prediction model can be developed for patients with MINS using observational clinical data. The XGB algorithm outperformed the LDA, kNN, CART, SVM, GLMNET, RF, and GBM machine learning algorithms. To maximize the applicability of the prediction model in clinic settings, we observed that the number of variables that need to be input into the model can be reduced to 5 while preserving the performance of the model. For more robust evidence, a randomized clinical trial is required to address the variables explored in this study. However, this study is the first to report mortality predictability in patients with MINS using machine learning.
Acknowledgments
SJS and JP contributed equally to this study as co-first authors. KY and RWP contributed equally to this study as corresponding authors. This research was funded by the Bio Industrial Strategic Technology Development Program (20003883, 20005021) funded by the Ministry of Trade, Industry & Energy (Korea) and a grant from the Korea Health Technology R&D Project through the Korea Health Industry Development Institute, funded by the Ministry of Health & Welfare, Republic of Korea (grant HR16C0001). This research was also supported by Healthcare AI Convergence Research & Development Program through the National IT Industry Promotion Agency of Korea funded by the Ministry of Science and ICT (No. 1711120339).
Abbreviations
- AUPRC
area under the precision and recall curve
- AUROC
area under the receiver operating characteristic
- CART
classification and regression trees
- CCI
Charlson Comorbidity Index
- CRP
C-reactive protein
- GBM
generalized boosted regression model
- GLMNET
lasso/ridge/elastic net
- kNN
k-nearest neighbors
- LDA
linear discriminant analysis
- MINS
myocardial injury after noncardiac surgery
- RF
random forests
- RFE
recursive feature elimination
- SHAP
Shapley Additive Explanations
- SMC-TINCO
Samsung Medical Center Troponin in Noncardiac Operation
- SVM
support vector machines
- XGB
extreme gradient boosting
The clinical data warehouse of Samsung Medical Center, named DARWIN-C.
Name and meaning of features in original and test data sets.
Performance indicators for evaluating machine learning models.
Age distribution and sex of the patients in the two data sets.
Descriptive analysis of surgery type.
Surgery type and mortality.
The optimal parameters of the machine learning algorithm.
Area under the receiver operating characteristic and area under the precision and recall curve plots of each model in predicting 30-day mortality.
Performance indexes of machine learning models predicting 30-day mortality of patients with myocardial injury after noncardiac surgery.
Importance of features in the extreme gradient boosting 30-day mortality prediction model.
Shapley Additive Explanations dependence plots for top 10 features of 30-day mortality prediction model.
Recursive feature elimination graph based on accuracy.
Performance indexes of extreme gradient boosting models predicting 30-day mortality of patients with myocardial injury after noncardiac surgery with top 28, top 10, chosen 10, and top 5 variables.
Area under the receiver operating characteristic and area under the precision and recall curve plots of each model predicting 30-day mortality with top 28, top 10, chosen 10, and top 5 variables.
Area under the receiver operating characteristic and area under the precision and recall curve plots of the extreme gradient boosting model predicting 1-year mortality.
Performance indexes of extreme gradient boosting model predicting 1-year mortality of patients with myocardial injury after noncardiac surgery.
Importance of features in the extreme gradient boosting 1-year mortality prediction model.
Shapley Additive Explanations summary plot of 1-year mortality prediction extreme gradient boosting model.
Optimized threshold and final performance of models.
Comparison of the Shapley Additive Explanations value with the Charlson Comorbidity Index score and updated Charlson Comorbidity Index score.
Footnotes
Conflicts of Interest: None declared.
References
- 1.Puelacher C, Lurati Buse G, Seeberger D, Sazgary L, Marbot S, Lampart A, Espinola J, Kindler C, Hammerer A, Seeberger E, Strebel I, Wildi K, Twerenbold R, du Fay de Lavallaz J, Steiner L, Gurke L, Breidthardt T, Rentsch K, Buser A, Gualandro DM, Osswald S, Mueller C, BASEL-PMI Investigators Perioperative myocardial injury after noncardiac surgery: incidence, mortality, and characterization. Circulation. 2018 Mar 20;137(12):1221–1232. doi: 10.1161/CIRCULATIONAHA.117.030114.CIRCULATIONAHA.117.030114 [DOI] [PubMed] [Google Scholar]
- 2.Smilowitz NR, Redel-Traub G, Hausvater A, Armanious A, Nicholson J, Puelacher C, Berger JS. Myocardial injury after noncardiac surgery: a systematic review and meta-analysis. Cardiol Rev. 2019;27(6):267–273. doi: 10.1097/CRD.0000000000000254. http://europepmc.org/abstract/MED/30985328 . [DOI] [PMC free article] [PubMed] [Google Scholar]
- 3.Sessler DI, Devereaux PJ. Perioperative troponin screening. Anesth Analg. 2016 Aug;123(2):359–60. doi: 10.1213/ANE.0000000000001450. [DOI] [PubMed] [Google Scholar]
- 4.van Waes JAR, van Klei WA, Wijeysundera DN, van Wolfswinkel L, Lindsay TF, Beattie WS. Association between intraoperative hypotension and myocardial injury after vascular surgery. Anesthesiology. 2016 Jan;124(1):35–44. doi: 10.1097/ALN.0000000000000922. https://pubs.asahq.org/anesthesiology/article-lookup/doi/10.1097/ALN.0000000000000922 . [DOI] [PubMed] [Google Scholar]
- 5.Schacham YN, Cohen B, Bajracharya GR, Walters M, Zimmerman N, Mao G, Tanios MA, Sessler DI. Mild perioperative hypothermia and myocardial injury: a retrospective cohort analysis. Anesth Analg. 2018 Dec;127(6):1335–1341. doi: 10.1213/ANE.0000000000003840. [DOI] [PubMed] [Google Scholar]
- 6.van Lier F, Wesdorp FHIM, Liem VGB, Potters JW, Grüne F, Boersma H, Stolker RJ, Hoeks SE. Association between postoperative mean arterial blood pressure and myocardial injury after noncardiac surgery. Br J Anaesth. 2018 Jan;120(1):77–83. doi: 10.1016/j.bja.2017.11.002. https://linkinghub.elsevier.com/retrieve/pii/S0007-0912(17)53940-9 .S0007-0912(17)53940-9 [DOI] [PubMed] [Google Scholar]
- 7.Turan A, Cohen B, Rivas E, Liu L, Pu X, Maheshwari K, Farag E, Onal O, Wang J, Ruetzler K, Devereaux PJ, Sessler DI. Association between postoperative haemoglobin and myocardial injury after noncardiac surgery: a retrospective cohort analysis. Br J Anaesth. 2021 Jan;126(1):94–101. doi: 10.1016/j.bja.2020.08.056.S0007-0912(20)30761-3 [DOI] [PubMed] [Google Scholar]
- 8.Kwon J, Park J, Lee S, Lee JH, Min JJ, Kim J, Oh AR, Seo W, Hyeon CW, Yang K, Choi J, Lee S, Kim K, Ahn J, Gwon H. Pre-operative anaemia and myocardial injury after noncardiac surgery: a retrospective study. Eur J Anaesthesiol. 2021 Jun 01;38(6):582–590. doi: 10.1097/EJA.0000000000001421.00003643-202106000-00003 [DOI] [PubMed] [Google Scholar]
- 9.Lee S, Yang K, Park J, Lee JH, Min JJ, Kwon J, Yeo J, Kim J, Hyeon CW, Choi J, Lee S, Gwon H, Kim K, Ahn J, Lee SM. Association between high body mass index and mortality following myocardial injury after noncardiac surgery. Anesth Analg. 2021 Apr 01;132(4):960–968. doi: 10.1213/ANE.0000000000005303.00000539-202104000-00006 [DOI] [PubMed] [Google Scholar]
- 10.Park J, Kim J, Lee S, Lee JH, Min JJ, Kwon J, Oh AR, Seo W, Hyeon CW, Yang K, Choi J, Lee S, Kim K, Ahn J, Gwon H. Postoperative statin treatment may be associated with improved mortality in patients with myocardial injury after noncardiac surgery. Sci Rep. 2020 Jul 15;10(1):11616. doi: 10.1038/s41598-020-68511-3.10.1038/s41598-020-68511-3 [DOI] [PMC free article] [PubMed] [Google Scholar]
- 11.Oh AR, Park J, Lee S, Kim J, Lee JH, Min JJ, Kwon J, Hyeon CW, Yang K, Choi J, Lee S, Gwon H. Elevated high-sensitivity C-reactive protein concentrations may be associated with increased postdischarge mortality in patients with myocardial injury after noncardiac surgery: A retrospective observational study. Eur J Anaesthesiol. 2021 Mar 01;38(Suppl 1):S33–S40. doi: 10.1097/EJA.0000000000001409.00003643-202103001-00005 [DOI] [PubMed] [Google Scholar]
- 12.Devereaux PJ, Szczeklik W. Myocardial injury after non-cardiac surgery: diagnosis and management. Eur Heart J. 2020 May 01;41(32):3083–3091. doi: 10.1093/eurheartj/ehz301.5490290 [DOI] [PubMed] [Google Scholar]
- 13.Kristensen SD, Knuuti J. New ESC/ESA Guidelines on non-cardiac surgery: cardiovascular assessment and management. Eur Heart J. 2014 Sep 14;35(35):2344–5. doi: 10.1093/eurheartj/ehu285.ehu285 [DOI] [PubMed] [Google Scholar]
- 14.Mahajan VS, Jarolim P. How to interpret elevated cardiac troponin levels. Circulation. 2011 Nov 22;124(21):2350–4. doi: 10.1161/CIRCULATIONAHA.111.023697.124/21/2350 [DOI] [PubMed] [Google Scholar]
- 15.Lundberg SM, Nair B, Vavilala MS, Horibe M, Eisses MJ, Adams T, Liston DE, Low DKW, Newman S, Kim J, Lee S. Explainable machine-learning predictions for the prevention of hypoxaemia during surgery. Nat Biomed Eng. 2018 Oct;2(10):749–760. doi: 10.1038/s41551-018-0304-0. http://europepmc.org/abstract/MED/31001455 .10.1038/s41551-018-0304-0 [DOI] [PMC free article] [PubMed] [Google Scholar]
- 16.Devereaux PJ, Duceppe E, Guyatt G, Tandon V, Rodseth R, Biccard BM, Xavier D, Szczeklik W, Meyhoff CS, Vincent J, Franzosi MG, Srinathan SK, Erb J, Magloire P, Neary J, Rao M, Rahate PV, Chaudhry NK, Mayosi B, de Nadal M, Iglesias PP, Berwanger O, Villar JC, Botto F, Eikelboom JW, Sessler DI, Kearon C, Pettit S, Sharma M, Connolly SJ, Bangdiwala SI, Rao-Melacini P, Hoeft A, Yusuf S, MANAGE Investigators Dabigatran in patients with myocardial injury after non-cardiac surgery (MANAGE): an international, randomised, placebo-controlled trial. Lancet. 2018 Jun 09;391(10137):2325–2334. doi: 10.1016/S0140-6736(18)30832-8.S0140-6736(18)30832-8 [DOI] [PubMed] [Google Scholar]
- 17.Shin SJ, Yang KM. MINS Predictor. [2021-08-09]. https://bit.ly/3zepij6 .
- 18.Karajizadeh M, Nasiri M, Yadollahi M, Zolfaghari AH, Pakdam A. Mortality prediction from hospital-acquired infections in trauma patients using an unbalanced dataset. Healthc Inform Res. 2020 Oct;26(4):284–294. doi: 10.4258/hir.2020.26.4.284. https://www.e-hir.org/DOIx.php?id=10.4258/hir.2020.26.4.284 .hir.2020.26.4.284 [DOI] [PMC free article] [PubMed] [Google Scholar]
- 19.Symum H, Zayas-Castro JL. Prediction of chronic disease-related inpatient prolonged length of stay using machine learning algorithms. Healthc Inform Res. 2020 Jan;26(1):20–33. doi: 10.4258/hir.2020.26.1.20. https://www.e-hir.org/DOIx.php?id=10.4258/hir.2020.26.1.20 . [DOI] [PMC free article] [PubMed] [Google Scholar]
- 20.Foucrier A, Rodseth R, Aissaoui M, Ibanes C, Goarin J, Landais P, Coriat P, Le Manach Y. The long-term impact of early cardiovascular therapy intensification for postoperative troponin elevation after major vascular surgery. Anesth Analg. 2014 Nov;119(5):1053–63. doi: 10.1213/ANE.0000000000000302. [DOI] [PubMed] [Google Scholar]
- 21.Ridker PM, MacFadyen JG, Everett BM, Libby P, Thuren T, Glynn RJ, CANTOS Trial Group Relationship of C-reactive protein reduction to cardiovascular event reduction following treatment with canakinumab: a secondary analysis from the CANTOS randomised controlled trial. Lancet. 2018 Jan 27;391(10118):319–328. doi: 10.1016/S0140-6736(17)32814-3.S0140-6736(17)32814-3 [DOI] [PubMed] [Google Scholar]
Associated Data
This section collects any data citations, data availability statements, or supplementary materials included in this article.
Supplementary Materials
The clinical data warehouse of Samsung Medical Center, named DARWIN-C.
Name and meaning of features in original and test data sets.
Performance indicators for evaluating machine learning models.
Age distribution and sex of the patients in the two data sets.
Descriptive analysis of surgery type.
Surgery type and mortality.
The optimal parameters of the machine learning algorithm.
Area under the receiver operating characteristic and area under the precision and recall curve plots of each model in predicting 30-day mortality.
Performance indexes of machine learning models predicting 30-day mortality of patients with myocardial injury after noncardiac surgery.
Importance of features in the extreme gradient boosting 30-day mortality prediction model.
Shapley Additive Explanations dependence plots for top 10 features of 30-day mortality prediction model.
Recursive feature elimination graph based on accuracy.
Performance indexes of extreme gradient boosting models predicting 30-day mortality of patients with myocardial injury after noncardiac surgery with top 28, top 10, chosen 10, and top 5 variables.
Area under the receiver operating characteristic and area under the precision and recall curve plots of each model predicting 30-day mortality with top 28, top 10, chosen 10, and top 5 variables.
Area under the receiver operating characteristic and area under the precision and recall curve plots of the extreme gradient boosting model predicting 1-year mortality.
Performance indexes of extreme gradient boosting model predicting 1-year mortality of patients with myocardial injury after noncardiac surgery.
Importance of features in the extreme gradient boosting 1-year mortality prediction model.
Shapley Additive Explanations summary plot of 1-year mortality prediction extreme gradient boosting model.
Optimized threshold and final performance of models.
Comparison of the Shapley Additive Explanations value with the Charlson Comorbidity Index score and updated Charlson Comorbidity Index score.