

Abstract
The C-arm X-ray system is a common intraoperative imaging modality used to observe the state of a fractured bone in orthopedic surgery. Using C-arm, the bone fragments are aligned during surgery, and their lengths and angles with respect to the entire bone are measured to verify the fracture reduction. Since the field-of-view of the C-arm is too narrow to visualize the entire bone, a panoramic X-ray image is utilized to enlarge it by stitching multiple images. To achieve X-ray image stitching with feature detection, the extraction of accurate and densely matched features within the overlap region between images is imperative. However, since the features are highly affected by the properties and sizes of the overlap regions in consecutive X-ray images, the accuracy and density of matched features cannot be guaranteed. To solve this problem, a heterogeneous stitching of X-ray images was proposed. This heterogeneous stitching was completed according to the overlap region based on homographic evaluation. To acquire sufficiently matched features within the limited overlap region, integrated feature detection was used to estimate a homography. The homography was then evaluated to confirm its accuracy. When the estimated homography was incorrect, local regions around the matched feature were derived from integrated feature detection and substituted to re-estimate the homography. Successful X-ray image stitching of the C-arm was achieved by estimating the optimal homography for each image. Based on phantom and ex-vivo experiments using the proposed method, we confirmed a panoramic X-ray image construction that was robust compared to the conventional methods.
Keywords: C-arm, Fluoroscopy, Image stitching, Panoramic imaging
Introduction
X-ray image stitching is a technique that combines multiple X-ray images to obtain a panoramic image. Because of the narrow field-of-view (FOV) of the X-ray image acquired with a C-arm in orthopedic surgery, a panoramic image with a wide FOV is required to cover the entire region-of-interest spanning the patient. In particular, a panoramic X-ray image is crucial in the case of fracture reduction because it provides an important cue needed to assess the fracture alignment [1–3]. Furthermore, in a minimally invasive fracture surgery that requires small incisions, the panoramic X-ray image is even more important, since surgeons have access to treatment information based only on two-dimensional X-ray images [4–6].
The key part of the X-ray image stitching process is homography, which identifies a transformation between consecutive images. In conventional methods, X-ray image stitching is conducted with the help of extra accessories or hardware. A radiolucent ruler, a typical measuring instrument, is used to estimate a homography. After the radiolucent ruler region has been identified in the image, the homography is computed by aligning the graduations of the radiolucent ruler [2, 7]. An external plate with a grid of perpendicular lines is used as an extra accessory. By placing the external plate below the subject, a grid is superimposed on the X-ray image. After identifying the intersections of these lines at the borders of the images, X-ray images are stitched by matching the image intersections [8]. An absolute reference panel is also used as a grid of radio-opaque, absolute position markers. This panel consists of a cross-hair surrounded by four quadrants, which have an individual tag in binary format. After estimating each position of the image by decoding the position marker, X-ray image stitching is conducted [3, 9]. Rather than using accessories, a specifically designed hardware, such as a camera-augmented mobile C-arm (CamC) that combines a C-arm with a video camera, is used to conduct X-ray image stitching. Since the homography directly corresponds to a position change of the X-ray source due to the C-arm motion, it is calculated based on video camera data of the estimated C-arm motion. However, a geometric relationship between the X-ray source in the C-arm and the video camera should be determined in advance through the calibration process. Additionally, visible planar marker patterns are also required to estimate the C-arm motion [9, 10].
Another approach of X-ray image stitching involves directly identifying the transformation using an image matching method that derives the homography only from the images without the use of any extra accessories or hardware. The image matching methods can be divided into two general categories: direct and feature detection. For direct methods, the pixel-wise comparison of the two images is performed for the homography [11–14]. By quantifying the similarity of the images according to the sum-of-square differences (SSD), sum of absolute differences, correlation filter, mutual information, etc., stitching between consecutive images can be achieved [15–22]. A common problem in the pixel-wise comparison is a brightness variation attributed to different radiation conditions. To avoid this nonuniform intensity distribution on X-ray images, the histograms of the images are matched. Alternatively, image normalization or normalized measures can be used for X-ray image stitching to reduce inaccuracies in similarity calculations due to different brightness levels [13, 23–25]. In addition, the image noise also affects the measurement of the similarity between the images. To eliminate noise, a robust method was proposed that utilizes the minimum average correlation energy filter for the medical image. Using the peak to side-lobe ratio that measures the peak sharpness of the correlation plane, X-ray image stitching was performed directly when the images were degraded by noise [14, 26, 27].
The feature detection method is based on the extracted features from each X-ray image rather than a pixel-wise comparison. After distinct features of the images are extracted by a feature detector, such as a scale-invariant feature transform (SIFT), feature matching is conducted to identify corresponding features in each image. The feature matching is performed by comparing a descriptor of one feature with the descriptors of all the features in other images. For more reliable feature matching, an outlier elimination can be used, such as the random sample consensus (RANSAC). A homography can then be estimated from reliably matched features [28, 29]. For invariantly matched features extracted by the speed-up robust features (SURF), cross-correlations, and conditions for detection consistency are suggested with a distance between descriptors. Based on these matched features, an accurate homography can be estimated, and stitched images are generated through a weighted average fusion process [30]. Recently, to improve the performance of feature matching, a hybrid method was developed that combined SIFT and SURF. By complementing the shortcomings of each of the detection methods, a robust panoramic X-ray image was constructed [28, 31].
There are several factors to consider when determining the suitable image matching method for X-ray image stitching. The direct method is simple and efficient. However, it can only estimate the homography derived from a limited motion of the C-arm. On the contrary, although the feature detection method is time-consuming, more complicated stitching can be achieved without significant geometric constraints. However, the limitation of the feature detection method is that it depends significantly on the overlap regions between images. It is important that the size of the overlap regions are at least comparable for image stitching, and prominent features have to be contained in the region [32]. With this prerequisite, the homography for X-ray image stitching can be correctly estimated. However, when discriminative regions, such as blobs, edges, or corners, are not sufficiently contained in the overlap regions, features that represent specific points of the image cannot be defined precisely. As a result, only a few matched features are extracted, and the image stitching fails. Furthermore, the quantitative area of the overlap region for a successful X-ray stitching cannot be defined. In practice, to avoid this problem, many X-ray images are obtained in order to increase the overlap region [10].
To reduce the dependency on the overlap region, a robust X-ray image stitching process was proposed using heterogeneous stitching with homographic evaluation. To overcome the fact that only a few matched features are extracted in cases of a narrow area or an indistinct overlap region, an integrated feature detection is proposed. To take into account the various discriminative properties within the overlap region in the image, SIFT, SURF, binary robust invariant scalable key points (BRISK), and KAZE [33–36], were used in conjunction. All the features from these feature detections were combined and used to estimate the homography. Since none of the information on the accuracy and density of the matched features was derived from the property of the overlap region, homographic evaluation is suggested as a novel technique. To evaluate the homography from the integrated feature detection, the motion of the C-arm relative to the imaging target was modeled while a successive X-ray image was acquired. When the homography was determined as incorrect based on the evaluation, the local image-based estimation substituted the integrated feature detection. Based on the comparison of the locally restricted regions around matched features, which are located within the overlap region, a more reliable homography can be estimated, leading to robust X-ray image stitching.
Methods
The proposed method was based on heterogeneous stitching that depends on overlap regions in X-ray images. Using integrated feature detection, homographic evaluation, and the local image-based estimation, a robust, panoramic C-arm X-ray image can be constructed. The flow of the proposed method is shown in Fig. 1. First, an image and its consecutive X-ray image were selected after the input images were arranged in order. For the selected images, the homography was estimated using the integrated feature detection. After distinct features of the images were extracted, the homography was estimated based on the matched features. The estimated homography was then verified by evaluating the homography. If the homography was correct, it was considered an optimal homography for that image and was stored. Otherwise, the local, corresponding image-based estimation was substituted for the integrated feature detection, and its homography was considered the optimal one. This process was executed iteratively until the last image in the set was processed.
Fig. 1.

Flow diagram of the proposed method for heterogeneous stitching of X-ray images by homographic evaluation
Integrated Feature Detection
In the limited overlap region, detecting numerous distinctive features by considering various properties of an image is important for increasing the number of features and the probability of obtaining densely matched features. The proposed method combined multiple informative features derived from different feature detections to improve the feature matching. Each feature detection method extracts distinctive points using its own technique based on the unique patterns of neighboring pixels. While SIFT and SURF are based on the blob features, features from BRISK, and KAZE are more concentrated on the boundaries, edges or corners. In the distribution of detected features, BRISK, and KAZE are more locally dense than SIFT and SURF. Therefore, when multiple feature detections are integrated, more features from diverse local characteristics of the image can be detected and acquired within the narrow overlap region compared to a single feature detection.
To obtain features using the proposed method, four feature detection methods, including SIFT, SURF, BRISK, and KAZE, were combined. The integrated features in the ith image of the image set, , is defined in (1) below.
| 1 |
It consists of a location vector and a descriptor vector from four feature detections, , where k is the index of the feature detection method, j is an index of detected features of each method, and is a location vector and descriptor vector pair of the jth detected feature from the feature detection method in the ith image. Features located within the FOV of the C-arm are meaningful for feature matching. However, depending on the feature detection, the boundary of the FOV is defined with regard to distinctive points on the X-ray image. To remove features beyond the FOV, both a radius of the FOV of the C-arm and the distance between the feature location and the center of the image are used for a distance comparison. The refined integrated features, , are defined as
| 2 |
where l is an index of refined features of each method, is the total number of refined features of each feature detection method in the ith image, is a location component of , is the center of an X-ray image, is the radius of the FOV of the C-arm, is the distance between the location of the jth feature and the center of the image, and is the radius threshold ratio for eliminating features at the boundary of the FOV. After the refining features, feature matching for each feature detection was conducted based on the SSDs. By comparing the descriptor of the mth feature in the ith image with all other features in the i + 1th image, the set of the matched feature index that satisfies below.
| 3 |
where is a descriptor component of , is an index of matched features, is the threshold for SSDs, is the eth element of , P is the dimension of the descriptor, and m and n are the indices of the matched features in the ith and i + 1th image, respectively. From (3), the locations of matched features in the ith and i + 1th image are represented as and , respectively.
| 4 |
where is a horizontal and a vertical component of , is the total number of the matched feature index for each feature detection method, and and denote the first and the second element of the matched feature index in the ith and i+1th image, respectively.
To exclude outliers in the matched features, an M-estimator sample consensus (MSAC) algorithm was used. A variant of the RANSAC algorithm, MSAC is an iterative algorithm used for the robust estimation of a homography from a subset of the inlier features. Using MSAC, well-matched features were acquired. The locations of the features in consecutive images are represented by and , which denote the MSAC versions of and , respectively. Based on the locations of the features, the ith homography from integrated feature detection, , is estimated with (5).
| 5 |
where T denotes the transpose of a vector.
Homographic Evaluation
Although the homography is estimated with integrated feature detection, the uncertainty of the homography remains when the overlap is narrow. Since high-density, well-matched features cannot be guaranteed, the homography may have inaccuracies. To overcome this limitation, a novel technique of homographic evaluation is suggested in the proposed method. Based on the C-arm motion of a subject when a series of X-ray images is obtained, the estimated homography from the integrated feature detection was evaluated.
The subject of the C-arm is designated as a specific object while the X-ray images are acquired. From the FOV aspect, the C-arm is highly restricted compared to the camera. The relative distance between the subject and the detector of the C-arm is limited, and the focal length is very long (of the order of the meter). As a result, the FOV of the C-arm is inherently very small [37]. Therefore, the motion of the C-arm must follow the shape of the target to cover the entire shape of the object. Typically, since the entire shape of the visualized target of the C-arm in orthopedic surgery is simple and straight, such as the femur, tibia, and spine, the motion of the C-arm is expected to move roughly in one direction along the target. This movement characterizes a pattern described by a mathematical formula when acquiring successive X-ray images for the reconstruction of a panoramic image. Based on this knowledge of the C-arm motion, the homography can be evaluated. The homographic evaluation is conducted in two steps: (a) self-evaluation and (b) relative evaluation. Self-evaluation considers the translation and rotation of the homography. The horizontal translation, , and rotation, , of the ith homography for the self-evaluation is represented in (6). Based on the criterion, the self-evaluation index in the ith homography, , is then determined.
| 6 |
where is a width of the image, and are the margins of the width and angle, respectively. The relative evaluation assesses the current homography by comparing it with the previous one. For this evaluation, the difference in the horizontal translation and the difference in the rotational angle are the determining factors. The relative evaluation index in the ith homography, , on the current image is determined by (7).
| 7 |
The first homography of the image set undergoes only a self-evaluation since there was no prior homography. Starting from the second homography, the relative evaluation was conducted along with the self-evaluation. Through these two evaluation steps, a final assessment of the correctness of the homography was determined by the evaluation index in the ith homography, , calculated using (8).
| 8 |
where denotes a logical OR operation. When the evaluation index was equal to one, the homography was considered to be correct. Otherwise, a local, corresponding image-based estimation was used to re-estimate the homography.
Local Image-Based Estimation
When a homography derived from the integrated feature detection was determined to be incorrect, pixel values around the matched feature were substituted to re-estimate the homography. Based on the matched features within the overlap from the integrated feature detection, the corresponding local region was determined as a square area centered on the position of the feature on each image. Then, the homography was re-estimated based on the peak values of the extended phase correlation of the corresponding local regions with their flatness. Since densely matched features are not required for the homography estimation, unlike feature detections, the dependency on the overlap region is significantly reduced. The proposed local image-based estimation consists of two parts: corresponding local region selection and extended phase correlation with flatness.
Corresponding Local Region Selection
To determine the corresponding local region, the matched features were refined in advance. First, matched feature candidates for local regions were selected from the matched features of the integrated feature detection outcomes by considering the width of each image. Because the precise width of the overlap region could not be determined, we assumed that the overlap region was narrow, and the locations of the matched features, and , were restricted within a quarter of the width of the image as indicated below:
| 9 |
where is a horizontal location component of . Then, the local region was defined as a square area centered on a matched feature candidate, whereby the matched feature is located in the overlap region. The selection process of a local region is illustrated in Fig. 2. The two X-ray images, which are positioned side-by-side, contain matched features from the integrated feature detection outcomes. The subsequent images show one matched feature candidate that satisfies (9), and their corresponding local regions are represented as dotted red squares in each image. After all of the local regions that satisfy (9) were determined, they became the candidates used to calculate the extended phase correlation with flatness.
Fig. 2.
Selection of the corresponding local region within the overlap region from the integrated feature detection
Extended Phase Correlation with Flatness
By reflecting on the C-arm motion, the homography in local image-based estimation was approximated to a rigid transformation. Therefore, only the rotation and translation components are required. In the proposed method, the rotation in the frequency domain was calculated, followed by an extended phase correlation that enabled the calculation of translation at subpixel accuracy. The amplitudes of the Fourier transforms of the local region were used to estimate the rotation. The corresponding local regions and of the ith and i + 1th images, respectively, which are the centered on and , respectively, were defined, and their Fourier transforms are represented by (10).
| 10 |
where represents the Fourier transform. Since the translation only affects the phase of the Fourier transforms, the translational and rotational components of the image can be separated. Thus, by matching the amplitudes of Fourier transforms with maximized correlations, the rotation can be estimated. For efficient calculation of the correlations, these were transformed to polar coordinates. The amplitude, which is a function of the angle θ based on integration along radial lines, was computed. Therefore, was computed as the average of the values on the rectangular grid at an angle θ, assuming that the following inequality is obeyed: α—Δα/2 < θ < α + Δα/2 [38]. The estimated angle of the rotation can then be computed as the value for which their correlation is maximized.
| 11 |
where r is the radius, θ is the angle in polar coordinates, and denotes a correlation operation.
To estimate the translation, an extended phase correlation with flatness was applied. It is based on the property that the inverse Fourier transform of the normalized cross-power spectrum is the impulse function at the point of a translated pixel value. For the extended phase correlation to estimate a subpixel translation, the subpixel translated image was assumed to be a downsampled image that has been translated by the integer pixel. To obtain a closed-form solution of the extended phase correlation, it was approximated by a two-dimensional sinc function [39]. The translation with subpixel accuracy between corresponding local regions was represented as the maximum peak of the sinc function. The peak value of corresponding local regions and , which is a rotation compensated region, is calculated as follows:
| 12 |
where and are downsampling factors in the horizontal and vertical directions, respectively. and are the integer translation values in the horizontal and vertical directions, respectively, before downsampling the image. In the proposed method, the flatness of the local region is also taken into account when estimating the translation. The extended phase correlation of the flat local region leads to ambiguity regarding the maximum peak of the sinc function. To exclude the local region determined by the aforementioned features in the translation estimation, the flatness of the local region which defines the minimum the standard deviation of intensities of corresponding local regions and is calculated as
| 13 |
where denotes the minimum value between two values and denotes the standard deviation. After calculating the peak value and the flatness of all corresponding regions from the matched feature candidates, the optimal local region for estimating the homography was determined. Equation (14) defines the criteria for the peak value and the flatness, and it enables the calculation of the translation, , between consecutive images using (15).
| 14 |
| 15 |
where is the location of the matched feature in the first image between two consecutive images, and is the estimated translation between corresponding local regions. By using the estimated rotation and translation from the local corresponding image-based method, the ith homography from the local image-based estimation, , was calculated as
| 16 |
Image Blending
For the panoramic image, each X-ray image was blended using the estimated homography. After the registration of the images using homography, the overlap region between consecutive images was blended into one image. In the proposed method, the maximum blending value was used, which is a simple and fast method. It selects the maximum pixel value from the two images in the overlap region. The final stitched X-ray image was then obtained.
Experimental Results
To verify the performance of the proposed method, X-ray image stitching experiments were conducted. Both the conventional and the proposed method were implemented in MATLAB (R2019a, Mathworks) using its toolbox. In the experiment, two types of test images were used: X-ray images of the caprine tibia and the human femur [40]. In the X-ray image of the human femur, anteroposterior (AP), and lateral (LAT) views of the image were used. In the X-ray images of the caprine tibia, the intact and fractured tibia states were used. As shown in Fig. 3, the fractured tibia was from a cadaver, and the intact tibia was a phantom. In addition, to reflect the conditions in an actual operation, fixation pins and the fixation plate, which are indispensable for fracture surgeries, were included in the X-ray images of the fractured tibia.
Fig. 3.

Test images used in the experiments. (a) X-ray images of a human femur (LAT view). (b) X-ray images of a human femur (AP views). (c) X-ray images of a caprine tibia (fracture). (d) X-ray images of a caprine tibia (with fixation pins). (e) X-ray images of a caprine tibia (with a fixation plate). (f) X-ray images of a caprine tibia (phantom)
The test images were simulated X-ray images from the C-arm. The X-ray images were generated following user interventions based on the manual adjustment of the overlap region. Considering the effect of the overlap region, it must be noted that the overlap between the second and third input images in each test image set was narrower than the overlap between the first and second input images. The results of the X-ray image stitching methods performed on the test images in Fig. 3 are shown in Fig. 4. SURF, SIFT, ORB, BRISK, KAZE, and the hybrid method (which combines SIFT and SURF), were used as the conventional methods of X-ray image stitching, and these were compared with the proposed method.
Fig. 4.

Resulting images of the experiments on the test images. (a) X-ray image of the human femur. (b) X-ray image of the caprine tibia
When the results among the conventional methods were compared, the performance of the hybrid method was the best. Based on the experimental results shown in Fig. 4, features from SURF and SIFT are more applicable for X-ray image stitching than features from ORB, BRISK, and KAZE. Thus, it is reasonable that the hybrid method has a better performance for X-ray image stitching compared to the other conventional methods. However, it does not mean that features from ORB, BRISK, and KAZE are unnecessary. When the hybrid method is compared to the proposed method, the proposed method produced more robust panoramic images, as shown in Fig. 4 since more various features are included by integrated feature detection.
When comparing the results in terms of the image content, the stitching mostly failed in the X-ray images that included only bone (i.e., without any accessories). Since sufficient features such as blobs and edges could not be obtained, matched features could not be acquired, and the homography was not estimated. Instances of this result are marked with the symbol “X” in Fig. 4. By contrast, when the X-ray image contained additional accessories, such as fixation pins and a plate, many features could be obtained. However, since features outside the overlap region are matched when the overlap region is narrow, an incorrect homography was estimated. As a result, stitching was conducted but the resulting image was incorrect.
To examine the overlap region, which affects the stitching, the first stitching with the first and the second input images and the second stitching with the second and the third input images were compared. As previously mentioned, the overlap region between the first and the second input image was larger than the overlap region between the second and the third input images. Accordingly, sufficient matched features for the homography estimation were acquired in the first stitching, and a correct homography was estimated as shown in Fig. 4. Specifically, the first stitching outcomes of all of the tested methods of the caprine tibia X-ray images with fixation pins were successful. However, when the overlap region was narrow, as observed in the second stitching outcomes, features were rarely detected within the overlap region. Therefore, the homography could not be estimated.
The proposed X-ray image stitching is a heterogeneous approach that includes both integrated feature detection and local image-based estimation. To extract accurate and densely matched features within the overlap region, integrated feature detection was proposed and showed superior performance compared to the conventional feature detections. To verify the effectiveness of integrated feature detection, the locations of the matched features and their pairs were compared (Fig. 5). The red circles and green crosses in each image denote locations of detected features, and the matched features are connected by yellow lines. The red translucent rectangle in the middle of each image denotes the overlap region. The integrated feature detection identified more matched features within the overlap region compared to SIFT feature detection.
Fig. 5.

Comparison of the matched features. (a) Matched features based on conventional feature detection with SIFT. (b) Matched features from the integrated feature detection
Figure 6 shows the comparison of a stitched region in the X-ray images of the caprine tibia acquired using both the hybrid method and the proposed method. As shown in Fig. 4, these were the only two methods that can construct a successful panoramic X-ray image of a caprine tibia with fixation pins. However, there was a little difference in the quality of the panoramic X-ray images. When the stitched region indicated by a red dotted line was magnified, the result from the proposed method was more natural than the hybrid method and did not have a boundary effect. Since more matched features can be acquired from the integrated feature matching, a more precise homography was estimated using the proposed method.
Fig. 6.
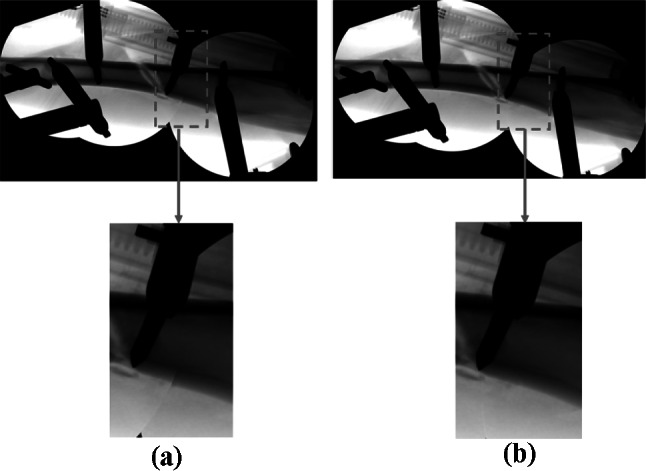
Comparison of a stitched region in X-ray images of a caprine tibia (with fixation pins): (a) hybrid and (b) proposed methods
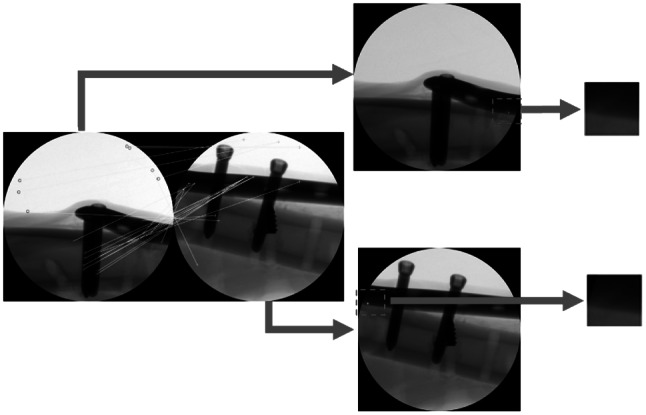
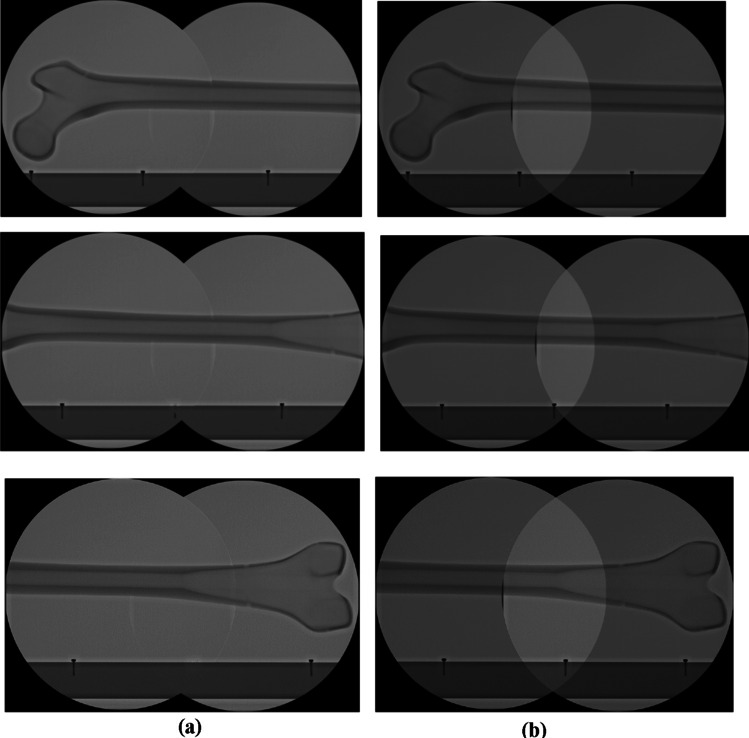
Figure 7 shows the stitching outcome of the proposed method of the X-ray image of the caprine tibia with a fixation plate. In alignment with Fig. 4, the stitching was only successful using the proposed method. Three images and their boundaries in each image are indicated by the dotted colored circles. Although the overlap region was sufficiently large between the first and second input image, it was significantly narrower between the second and the third input image. Therefore, while the first stitching was successfully conducted for several methods, the second stitching failed in all of the conventional methods. Conversely, by adopting a local image-based estimation, the proposed method could stitch the images even if the overlap region was extremely limited. Typically, when the overlap region is limited, stitching with detected features is impossible, since a sufficient number of reliably matched features in a limited region is not found. However, in the proposed method, the limitation of conventional X-ray image stitching caused by the very narrow overlap region can be overcome by heterogeneous stitching using homographic evaluation, depending on the area of the overlap.
Fig. 7.
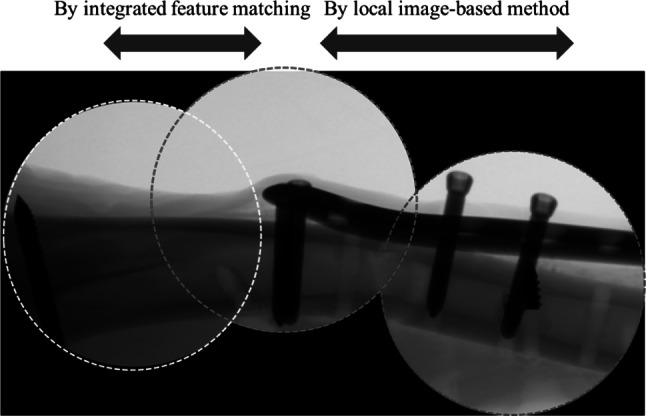
Heterogeneous stitching depending on the overlap region using the proposed method
For qualitative comparison of the proposed X-ray image stitching method, the difference between the reference and stitched images is calculated as the margin of error. Since a stitching is conducted on the basis of the first input images, those in the reference and stitched image are initially aligned, and the stitched image obtained using the proposed method is subtracted from the reference image. The difference image is then represented in terms of intensities. Specifically, the reference image is generated by manually adjusting the overlapped input images. Figure 8 shows the difference images for the test images used in the experiments. In each of the difference images, no differences are observed for the first input images as they are aligned before computing the differences. Thus, differences are observed only in the second and third input images. The error from the estimated homography can be analyzed by specifying the difference image, where the edge thickness in the intensity region represents the degree of displacement between the reference and stitched images.
Fig. 8.
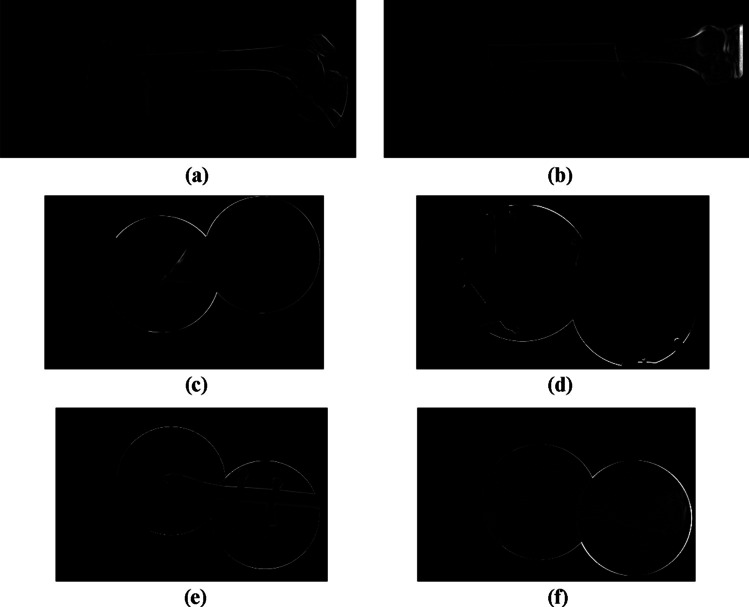
Difference images of the test images used in the experiments. (a) X-ray image of a human femur in LAT view. (b) X-ray image of a human femur in AP view. (c) X-ray image of a caprine tibial fracture. (d) X-ray image of a caprine tibia with fixation pins. (e) X-ray image of a caprine tibia with a fixation plate. (f) X-ray image of a caprine tibial phantom
The second experiment involved stitching an actual X-ray image from the C-arm. The human femur phantom and the caprine tibia of a cadaver used for the experiment are shown in Fig. 9. To emulate the clinical configuration, an ex-vivo experiment with the caprine tibia was also conducted. Four X-ray images of the human femur and three X-ray images of the caprine tibia were acquired by the C-arm, as shown in Fig. 10. As in previous experiments, SURF, SIFT, ORB, BRISK, KAZE, the hybrid method, and the proposed method were used, and the resulting images are shown in Fig. 11. Based on the results, all of the methods except for the proposed method failed to stitch the X-ray images. Thus, this experiment confirmed the superiority of the proposed method for X-ray image stitching.
Fig. 9.

Objects imaged with C-arm X-ray imaging. (a) Human femur phantom. (b) Caprine tibia from a cadaver
Fig. 10.

Test images for the experiment. X-ray images of (a) the human femur phantom and (b) caprine tibia cadaver
Fig. 11.

Results of the X-ray images of the (a) human femur phantom and (b) caprine tibia cadaver
For the quantitative evaluation of the proposed method, another X-ray image sequence of the human femur phantom was acquired, as shown in Fig. 12. During the image acquisition, a metal ruler that included markers at 100-mm intervals was placed beside the human femur phantom. By manually adjusting the homography between images based on the ruler markers, a reference image for quantitative evaluation was generated (Fig. 13b). In this experiment, three sets of images on the proximal, middle, and distal parts of the human femur phantom were used. To exclude the effect from the ruler in the X-ray image when the proposed method was applied, the ruler in the original image was removed using the image processing technique shown in Fig. 12b. That image was then used to estimate the homography using the proposed method. For the evaluation, the original image with the homography from the proposed method was used when the images were stitched. Figure 13 shows the result of the X-ray image stitching process for the quantitative evaluation of the three sets. Table 1 shows the quantitative evaluation of the X-ray image stitching process for pixel displacement.
Fig. 12.
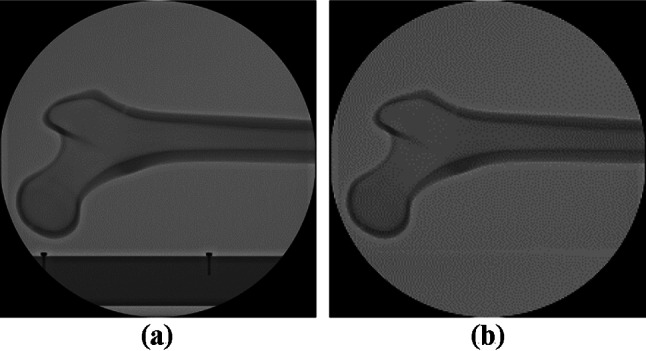
X-ray images used for quantitative evaluations. (a) Original image (with the ruler). (b) Test image (without the ruler)
Fig. 13.
X-ray image stitching outcomes used for quantitative evaluations. (a) Reconstructed images from the proposed method. (b) Reference images
Table 1.
Quantitative evaluation of X-ray image stitching process
| Displacement (pixel) | Percentage (%) | |||
|---|---|---|---|---|
| Width | Height | Width | Height | |
| Proximal part | 33 (1006) | 0 (600) | 3.28 | 0 |
| Middle part | 18 (1032) | 2 (606) | 1.74 | 0.33 |
| Distal part | 9 (929) | 0 (600) | 0.97 | 0 |
To calculate the pixel displacement, the result of X-ray image stitching was overlayed on the reference image. Figure 14 shows the overlapped images of the image reconstructed using the proposed method and the reference image. After aligning the first image of both the reference image and the reconstructed image from the proposed method, the pixel displacement was measured between the reference image and the image from the proposed method. The results are listed in Table 1 as the displaced pixels in terms of width and height. The numbers in the parentheses beside the displacement denote the total pixels in the reference image. The size of each test image was 600 × 600 pixels. Based on the total size of each dimension, the displacement percentage was calculated. The average width and height displacements were about 20 pixels and 1 pixel when the average total width and height of the image were 990 pixels and 600 pixels, respectively.
Fig. 14.

Overlapped images between the proposed method and the reference images used for quantitative evaluations. (a) Proximal part. (b) Middle part. (c) Distal part
Discussion
This study proposed a heterogeneous stitching process for X-ray images. Without any extra accessories and additional computations, such as calibrations and marker recognition, successful stitching was achieved with images alone even with extremely narrow overlap regions between the images. Based on the integrated feature detection, homographic evaluation, and the local region around an matched feature within the overlap region, the challenges associated with incorrect homography estimation using conventional methods were overcome. Based on a series of experiments, we validated the proposed panoramic X-ray image processing that led to precise homographic estimation. In addition, through experiments with simulated images that adjusted the overlap region according to the user intervention, the stitching problem derived from a narrow overlap region was successfully overcome using the proposed method. Furthermore, the stitched region between the images acquired with the proposed method was more natural and did not have a boundary effect. For the quantitative evaluation of the X-ray image stitching process with actual X-ray images from C-arm, the displacement between the reference image and the stitched image was measured in pixels. As a result, approximately 1.2% of the width average displacement occurred. However, there are some discussions on the proposed method, such as the selection of the detection methods for integrated feature detection and determining the size of the local region.
Selection of the Detection Methods in Integrated Feature Detection
To obtain a sufficient number of features within the overlap region in the image, four feature detections, SIFT, SURF, BRISK, and KAZE, were combined in the proposed method. When compared to the properties of the images from a normal digital camera, the X-ray image had a less distinct region of interest. First, because the background of the X-ray image was empty, it is simple and has no textures. Therefore, distinct features in the background of the overlap region are hardly observed. In terms of the contents of the X-ray image, only the local part of the subject was acquired since the C-arm is a medical instrument used for the diagnosis of a detailed subject. In addition, as shown Figs. 3 and 10, the shapes of the subjects in orthopedic surgery were simple with a few locally complex structures. Thus, a limited number of features from single feature detection in the X-ray image is detected.
To overcome this problem, additional features that reflect diverse and distinct regions of interest have to be detected. The proposed method suggested the use of integrated feature detection. By integrating BRISK and KAZE into SIFT and SURF, the integrated feature detection could detect various distinctive features such as blobs, edges, and boundaries. Several studies have been published on comprehensive comparisons of feature detections, such as SIFT, SURF, KAZE, AKAZE, ORB, BRISK, and others [41–43]. These studies provided comparative results for the various types of feature detections in terms of quantitative factors, such as accuracy, feature-matching time, repeatability, and others. Although there are some disputes on the comparisons and test conditions, the SIFT feature matching yielded the best overall performance, and BRISK ranked second, and the accuracy of KAZE was comparable to BRISK [43]. In terms of detecting high-quantity features, ORB ranked first and BRISK ranked second. Overall, taking into consideration accuracy and detected feature quality, BRISK, KAZE, and ORB among various feature detections were the best candidates as additional features for the integrated feature detection of the proposed method. However, based on our experiments with the X-ray image, ORB detected fewer features compared to BRISK and KAZE and mostly failed to estimate the homography of the X-ray image. In addition, there was significant similarity between the ORB and BRISK results. Therefore, only BRISK and KAZE were incorporated into the integrated feature detection.
Determining the Size of the Local Region
After the homographic evaluation, the homography was re-estimated based on a local, corresponding region in cases when the estimated homography based on the integrated feature detection was judged to be incorrect. To re-estimate the homography based on a local corresponding region, the position of the local region was specified by the matched features from the integrated feature detection. After matched features within the overlap region were selected among all the matched feature candidates, the local corresponding region was determined as a square area centered at the locations of the selected features, but its size was not fixed. Depending on the location of the selected feature, the width of the local region was restricted. When the location of a selected feature was near the boundary of the image, the maximum width of the local region was determined as the distance between the location of the feature and the boundary of the image. The minimum width of the local region was more flexible than the maximum width. However, when the size of the local region was too small, the ambiguity of the peak values of the extended phase correlation increased due to the low number of neighboring pixels, which resulted in incorrect homography. Based on these factors, the width of the local region was experimentally set at a range of over 5% of the width of the image in the proposed method.
Conclusions
In this study, a heterogeneous X-ray image stitching process was proposed according to the estimated homography. By using integrated feature detection, homographic evaluation, and the local corresponding image-based estimation, the X-ray image stitching performance was less dependent on the overlap region. Therefore, this method enabled more robust X-ray stitching. The study confirmed that the proposed method produced improved X-ray panoramic images compared to conventional methods.
Abbreviations
- AP
Anteroposterior
- BRISK
Binary robust invariant scalable key points
- LAT
Lateral
- MSAC
M-estimator sample consensus
- RANSAC
Random sample consensus
- SIFT
Scale-invariant feature transform
- SSD
Sum-of-square differences
- SURF
Speed-up robust features
Author Contribution
Ho-Gun Ha: conceptualization, methodology, writing—original draft. Kyunghwa Jung: conceptualization, methodology. Seongpung Lee: methodology. HyunKi Lee: conceptualization. Jaesung Hong: conceptualization, writing—reviewing and editing, supervision.
Funding
This work was supported by the Basic Science Research Program through the National Research Foundation of Korea (NRF) funded by the Ministry of Education (2020R1I1A1A01064673).
Availability of Data and Material
Not applicable.
Code Availability
Not applicable.
Declarations
Ethics Approval
Not applicable.
Consent to Participate
The authors agree to participate in this research study.
Consent for Publication
The authors agree to publish this research study.
Additional Declarations
Under the terms of use, we modified the uploaded X-ray images of femur from http://radiopaedia.org and utilized them as the test images in Fig. 3a, b. Under the terms of use from http://radiopaedia.org: for non-commercial, you can copy contents and alter and/or build upon it.
Conflict of Interest
The authors declare no competing interests.
Footnotes
Publisher's Note
Springer Nature remains neutral with regard to jurisdictional claims in published maps and institutional affiliations.
References
- 1.Wang L, et al.: Long bone X-ray image stitching using C-arm motion estimation. Informatik aktuell:202,2009
- 2.Yaniv Z, Joskowicz L. Long bone panoramas from fluoroscopic X-ray images. IEEE transactions on medical imaging. 2004;23:26–35. doi: 10.1109/TMI.2003.819931. [DOI] [PubMed] [Google Scholar]
- 3.Messmer P, Matthews F, Wullschleger C, Hügli R, Regazzoni P, Jacob AL. Image fusion for intraoperative control of axis in long bone fracture treatment. European Journal of Trauma. 2006;32:555–561. doi: 10.1007/s00068-006-5159-5. [DOI] [Google Scholar]
- 4.Bai L, Yang JX, Chen XH, Sun YX, Li XY: Medical robotics in bone fracture reduction surgery: a review. Sensors 19,2019 [DOI] [PMC free article] [PubMed]
- 5.Gaston P, Will EM, Keating JF. Recovery of knee function following fracture of the tibial plateau. Journal of Bone and Joint Surgery-British. 2005;87B:1233–1236. doi: 10.1302/0301-620X.87B9.16276. [DOI] [PubMed] [Google Scholar]
- 6.Dagnino G, et al. Image-guided surgical robotic system for percutaneous reduction of joint fractures. Annals of biomedical engineering. 2017;45:2648–2662. doi: 10.1007/s10439-017-1901-x. [DOI] [PMC free article] [PubMed] [Google Scholar]
- 7.Chen C, Kojcev R, Haschtmann D, Fekete T, Nolte L, Zheng GY. Ruler based automatic C-arm image stitching without overlapping constraint. Journal of Digital Imaging. 2015;28:474–480. doi: 10.1007/s10278-014-9763-3. [DOI] [PMC free article] [PubMed] [Google Scholar]
- 8.Capek M, Wegenkittl R, Felkel P: A fully-automatic stitching of 2D medical data sets, 2002
- 9.Wang L, et al.: Long bone x-ray image stitching using camera augmented mobile c-arm. Proc. International Conference on Medical Image Computing and Computer-Assisted Intervention: City [DOI] [PubMed]
- 10.Wang L, Traub J, Weidert S, Heining SM, Euler E, Navab N. Parallax-free long bone X-ray image stitching. Medical image computing and computer-assisted intervention : MICCAI International Conference on Medical Image Computing and Computer-Assisted Intervention. 2009;12:173–180. doi: 10.1007/978-3-642-04268-3_22. [DOI] [PubMed] [Google Scholar]
- 11.Szeliski R: Image alignment and stitching: Springer, 2006
- 12.Zhang Y, Zhou H. Image stitching based on particle swarm and maximum mutual information algorithm. Journal of Multimedia. 2013;8:580. [Google Scholar]
- 13.Kumar A, Bandaru RS, Rao BM, Kulkarni S, Ghatpande N: Automatic image alignment and stitching of medical images with seam blending. World Academy of Science, Engineering and Technology 65,2012
- 14.Salbiah S, Somaya A, Arof H, Saleh Z, Ibrahim F. A new approach to medical image stitching using minimum average correlation energy filter and peak to side-lobe ratio. International Journal of Imaging Systems and Technology. 2012;22:166–171. doi: 10.1002/ima.22018. [DOI] [Google Scholar]
- 15.Maintz JA, Viergever MA. A survey of medical image registration. Medical image analysis. 1998;2:1–36. doi: 10.1016/S1361-8415(01)80026-8. [DOI] [PubMed] [Google Scholar]
- 16.Oliveira FP, Tavares JMR. Medical image registration: a review. Computer methods in biomechanics and biomedical engineering. 2014;17:73–93. doi: 10.1080/10255842.2012.670855. [DOI] [PubMed] [Google Scholar]
- 17.Zitova B, Flusser J. Image registration methods: a survey. Image and Vision Computing. 2003;21:977–1000. doi: 10.1016/S0262-8856(03)00137-9. [DOI] [Google Scholar]
- 18.Santini S, Jain R. Similarity measures. Ieee Transactions on Pattern Analysis and Machine Intelligence. 1999;21:871–883. doi: 10.1109/34.790428. [DOI] [Google Scholar]
- 19.Chalom E, Asa E, Biton E. Measuring image similarity: an overview of some useful applications. Ieee Instrumentation & Measurement Magazine. 2013;16:24–28. doi: 10.1109/MIM.2013.6417053. [DOI] [Google Scholar]
- 20.Kim J, Fessler JA. Intensity-based image registration using robust correlation coefficients. Ieee Transactions on Medical Imaging. 2004;23:1430–1444. doi: 10.1109/TMI.2004.835313. [DOI] [PubMed] [Google Scholar]
- 21.Mellor M, Brady M. Phase mutual information as a similarity measure for registration. Medical Image Analysis. 2005;9:330–343. doi: 10.1016/j.media.2005.01.002. [DOI] [PubMed] [Google Scholar]
- 22.Yang F, He Y, Deng ZS, Yan A. Improvement of automated image stitching system for DR X-ray images. Computers in Biology and Medicine. 2016;71:108–114. doi: 10.1016/j.compbiomed.2016.01.026. [DOI] [PubMed] [Google Scholar]
- 23.Briechle K, Hanebeck UD: Template matching using fast normalized cross correlation. Proceedings of SPIE:95–102,2001
- 24.Pei SC, Lin CN. Image normalization for pattern recognition. Image and Vision Computing. 1995;13:711–723. doi: 10.1016/0262-8856(95)98753-G. [DOI] [Google Scholar]
- 25.Bardera A, Feixas M, Boada I: Normalized similarity measures for medical image registration. Proceedings of SPIE:108–118,2004
- 26.Mahalanobis A, Kumar B, Casasent D. Minimum average correlation energy filters. Applied Optics. 1987;26:3633–3640. doi: 10.1364/AO.26.003633. [DOI] [PubMed] [Google Scholar]
- 27.Kumar B, Savvides M, Xie C. Correlation pattern recognition for face recognition. Proceedings of the Ieee. 2006;94:1963–1976. doi: 10.1109/JPROC.2006.884094. [DOI] [Google Scholar]
- 28.Singla S, Sharma R. Medical image stitching using hybrid of sift & surf techniques. International Journal of Advanced Research in Electronics and Communication Engineering (IJARECE) 2014;3:838–842. [Google Scholar]
- 29.Jing X, Zhenjiang M: An improved algorithm on image stitching based on SIFT features. Second International Conference on Innovative Computing, Informatio and Control (ICICIC 2007), Innovative Computing, Information and Control, 2007 ICICIC '07 Second International Conference on:453,2007
- 30.Gong J-H, Zhang J-H, An Z-Z, Zhao W-W, Liu H-M: An approach for X-ray image mosaicing based on Speeded-Up Robust Features. Proc. 2012 International Conference on Wavelet Active Media Technology and Information Processing (ICWAMTIP): City
- 31.Karami E, Prasad S, Shehata M: Image matching using SIFT, SURF, BRIEF and ORB: performance comparison for distorted images. arXiv preprint arXiv:171002726, 2017
- 32.Dare P, Dowman I. A new approach to automatic feature based registration of SAR and SPOT images. International Archives of the Photogrammetry, Remote Sensing and Spatial Information Sciences - ISPRS Archives. 2000;33:125. [Google Scholar]
- 33.Bay H, Ess A, Tuytelaars T, Van Gool L. Speeded-Up Robust Features (SURF) Computer Vision and Image Understanding. 2008;110:346–359. doi: 10.1016/j.cviu.2007.09.014. [DOI] [Google Scholar]
- 34.Leutenegger S, Chli M, Siegwart RY: BRISK: Binary Robust invariant scalable keypoints. 2011 International Conference on Computer Vision, Computer Vision (ICCV), 2011 IEEE International Conference on:2548–2555,2011
- 35.Alcantarilla PF, Bartoli A, Davison AJ, Alcantarilla PF, Bartoli A, Davison AJ: KAZE features, 2012
- 36.Alcantarilla PF, Nuevo J, Bartoli A: Fast explicit diffusion for accelerated features in nonlinear scale spaces. BMVC 2013 - Electronic Proceedings of the British Machine Vision Conference 2013, 2013
- 37.Ha HG, Jeon S, Lee S, Choi H, Hong J. Perspective pinhole model with planar source for augmented reality surgical navigation based on C-arm imaging. International Journal of Computer Assisted Radiology and Surgery. 2018;13:1671–1682. doi: 10.1007/s11548-018-1823-6. [DOI] [PubMed] [Google Scholar]
- 38.Vandewalle P, Süsstrunk S, Vetterli M: A frequency domain approach to registration of aliased images with application to super-resolution. EURASIP journal on advances in signal processing 2006:071459,2006
- 39.Foroosh H, Zerubia JB, Berthod M. Extension of phase correlation to subpixel registration. IEEE transactions on image processing. 2002;11:188–200. doi: 10.1109/83.988953. [DOI] [PubMed] [Google Scholar]
- 40.Case courtesy of A.Prof Frank Gaillard, http://radiopaedia.org., rID: 23325. Available at http://radiopaedia.org., rID: 23325.
- 41.Mikolajczyk K, Schmid C. A performance evaluation of local descriptors. Ieee Transactions on Pattern Analysis and Machine Intelligence. 2005;27:1615–1630. doi: 10.1109/TPAMI.2005.188. [DOI] [PubMed] [Google Scholar]
- 42.Miksik O, Mikolajczyk K: Evaluation of local detectors and descriptors for fast feature matching. Proceedings of the 21st International Conference on Pattern Recognition (ICPR2012), Pattern Recognition (ICPR), 2012 21st International Conference on:2681–2684,2012
- 43.Tareen SAK, Saleem Z: A comparative analysis of SIFT, SURF, KAZE, AKAZE, ORB, and BRISK. 2018 International Conference on Computing, Mathematics and Engineering Technologies: Invent, Innovate and Integrate for Socioeconomic Development, iCoMET 2018 - Proceedings 2018-January:1, 2018
Associated Data
This section collects any data citations, data availability statements, or supplementary materials included in this article.
Data Availability Statement
Not applicable.
Not applicable.