Abstract
Here, we used pre-treatment CT images to develop and evaluate a radiomic signature that can predict the expression of programmed death ligand 1 (PD-L1) in non-small cell lung cancer (NSCLC). We then verified its predictive performance by cross-referencing its results with clinical characteristics. This two-center retrospective analysis included 125 patients with histologically confirmed NSCLC. A total of 1287 hand-crafted radiomic features were observed from manually determined tumor regions. Valuable features were then selected with a ridge regression-based recursive feature elimination approach. Machine learning–based prediction models were then built from this and compared each other. The final radiomic signature was built using logistic regression in the primary cohort, and then tested in a validation cohort. Finally, we compared the efficacy of the radiomic signature to the clinical model and the radiomic-clinical nomogram. Among the 125 patients, 89 were classified as having PD-L1 positive expression. However, there was no significant difference in PD-L1 expression levels determined by clinical characteristics (P = 0.109–0.955). Upon selecting 9 radiomic features, we found that the logistic regression-based prediction model performed the best (AUC = 0.96, P < 0.001). In the external cohort, our radiomic signature showed an AUC of 0.85, which outperformed both the clinical model (AUC = 0.38, P < 0.001) and the radiomics-nomogram model (AUC = 0.61, P < 0.001). Our CT-based hand-crafted radiomic signature model can effectively predict PD-L1 expression levels, providing a noninvasive means of better understanding PD-L1 expression in patients with NSCLC.
Keywords: Non-small cell lung cancer, Programmed cell death 1 protein, Radiomics, Machine learning, CT
Introduction
Tumor immunotherapy has made progress in recent years with the development of programmed death ligand 1 (PD-L1) or programmed cell death protein 1 (PD-1) inhibitors such as Nivolumab and Pembrolizumab [1, 2]. These drugs have offered new hope for patients with non-small cell lung cancer (NSCLC), especially for those with multiple metastases or inoperable tumors. In-depth evaluation of PD-L1 expression and regulation in NSCLC patients is particularly important for determining treatment plans. However, immunohistochemistry is the current conventional method for detecting PD-L1 expression, which requires an invasive biopsy or surgical samples. Biopsies increase the risk of cancer metastasis [3], and repeated tumor sampling is sometimes difficult to obtain a satisfactory tissue sample. Poor biopsy tissue quality [4] and relatively high costs for the procedures limit the detection efficiency and practicality of these methods [5]. In addition, analyzing PD-L1 expression by needle biopsy in a relatively small tissue sample size is often not representative of the entire tumor’s heterogenous expression profile. [6, 7]. Therefore, an accurate, noninvasive predictor of PD-L1 expression in patients with lung cancer is clinically desirable.
As radiomic technology has advanced in recent years, increased attention is being applied to its role in managing malignant cancer [8–11]. Several studies have hypothesized that genetic and cellular tumor characteristics reflect phenotypic patterns and can be captured with medical imaging [12–14]. Advanced, quantitative, high-throughput radiomic features can be extracted from the tumor volume in medical images which can be used to discover tumor characteristics that the naked eye cannot detect [15–17]. Radiomic is a powerful approach for capturing intratumoral heterogeneity from features in radiological images, and has already aided the development of diagnostic, predictive, and prognostic models to advance personalized medicine [18].
Studies show that radiomics have effectively aided prediction of metastasis in lymph nodes and other organs by interpreting the gene-expression patterns and prognosis of various cancers [19–22]. CT imaging can therefore characterize both tumors and their microenvironments, allowing us to predict PD-L1 expression while considering intratumor heterogeneity. This non-invasive approach can ultimately provide information complementary to a biopsy [6, 17]. Previous studies using radiomics have mostly focused on EGFR genes [23–26]. However, there are few reports that use radiomics to predict PD-L1 expression in lung cancer [27, 28], and they all lack external validation and detailed modeling analysis.
Our study aimed to develop and evaluate a hand-crafted radiomic signature using machine learning methods based on pre-treatment CT images of NSCLC patients to predict their level of PD-L1 expression. This predictive model could provide a noninvasive means to better evaluate PD-L1 expression in lung cancer and provide valuable information to direct personalized therapy.
Materials and Methods
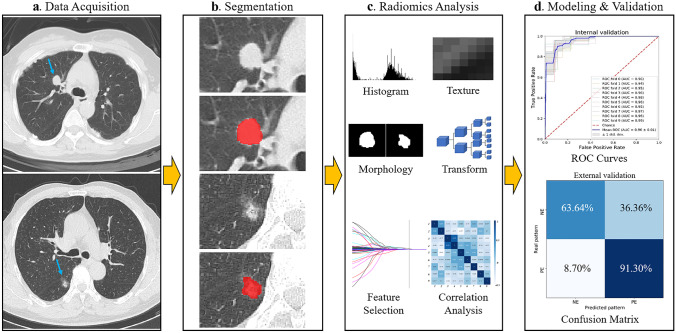
This retrospective study was approved by the ethics committees, and the requirement for informed consent was waived. The workflow of the study is provided in Fig. 1.
Fig. 1.
Study workflow overview. a Data acquisition, b tumor segmentation, c radiomic analysis including feature extraction and selection, and d modeling and validation
Patient Population
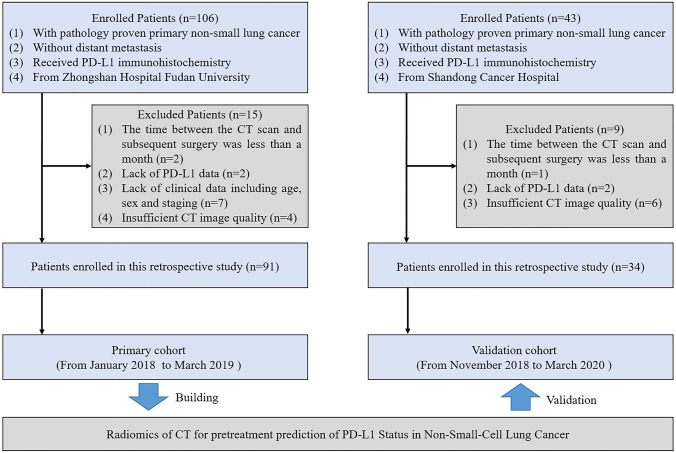
A total of 125 patients who underwent surgical treatment were included in this study (Fig. 2). The inclusion criteria were as follows: (1) patients with histologically-confirmed primary lung adenocarcinoma, (2) patients without distant metastasis, (3) those who have undergone pathological examination of tumor specimens and PD-L1 expression detection, and (4) patients with preoperative CT data. The exclusion criteria were as follows: (1) patients lacking clinical data including age, sex, and staging; (2) those who have received preoperative antitumor therapy; (3) patients with more than one month between CT examination and surgery; and (4) those with insufficient CT image quality. We divided the patients into a primary cohort and an independent validation cohort according to the hospital where they received treatment. The primary cohort consisted of 91 patients from hospital 1 treated between January 2018 and March 2019, and the validation cohort included 34 patients from hospital 2 treated between November 2018 and March 2020. Clinical characteristics were acquired from all patients, see Table 1.
Fig. 2.
Patient inclusion and exclusion criteria flowchart
Table 1.
Patient demographic characteristics
| Characteristics | All patients (N = 125) | Primary cohort (N = 91) | Validation cohort (N = 34) | P value |
|---|---|---|---|---|
| Age, mean (range) (years) | 54.49 (27–80) | 57.54 (27–80) | 61.03 (38–74) | 0.097 |
| Gender, n (%) | 0.250 | |||
| Male | 63 (50.4) | 43 (47.3) | 20 (58.8) | |
| Female | 62 (49.6) | 48 (52.7) | 14 (41.2) | |
| Smoking status, n (%) | 0.244 | |||
| Never | 87 (69.6) | 66 (72.5) | 21 (61.8) | |
| Smoker | 38 (30.4) | 25 (27.5) | 13 (38.2) | |
| Location, n (%) | 0.341 | |||
| Right upper lobe | 46 (36.8) | 33 (36.3) | 13 (38.2) | |
| Right middle lobe | 7 (5.6) | 5 (5.5) | 2 (5.9) | |
| Right lower lobe | 24 (19.2) | 15 (16.5) | 9 (26.5) | |
| Left upper lobe | 34 (27.2) | 29 (31.8) | 5 (14.7) | |
| Left lower lobe | 14 (11.2) | 9 (9.9) | 5 (14.7) | |
| CT pattern, n (%) | 0.358 | |||
| Pure solid nodule | 68 (54.4) | 46 (50.5) | 22 (64.7) | |
| Part-solid nodule | 46 (36.8) | 36 (39.6) | 10 (29.4) | |
| Ground glass nodules | 11 (8.8) | 9 (9.9) | 2 (5.9) | |
| Diameter of nodule, mean (range) (cm) | 1.66 (0.4–6.4) | 1.48 (0.4–6.4) | 2.14 (0.7–6.2) | 0.006 |
| Histological type, n (%) | 0.836 | |||
| LAC | 115 (92.0) | 84 (92.3) | 31 (91.2) | |
| LSC | 10 (8.0) | 7 (7.7) | 3 (9.7) | |
| Stage, n (%) | 0.001 | |||
| Tis | 4 (3.2) | 4 (4.4) | 0 (0.0) | |
| I | 106 (84.8) | 84 (92.3) | 22 (64.7) | |
| II and III | 15 (12.0) | 3 (3.3) | 12 (35.3) | |
| EGFR gene, n (%) | 0.432 | |||
| Mutant-type | 66 (52.8) | 50 (54.9) | 16 (47.1) | |
| Wild-type | 59 (47.2) | 41 (45.1) | 18 (52.9) | |
| Ki-67 expression, n (%) | 0.223 | |||
| Positive | 41 (32.8) | 27 (29.7) | 14 (41.2) | |
| Negative | 84 (67.2) | 64 (70.3) | 20 (58.8) | |
| PD-L1 expression, n (%) | 0.592 | |||
| Positive | 89 (71.2) | 66 (72.5) | 23 (67.6) | |
| Negative | 36 (28.8) | 25 (27.5) | 11 (32.4) |
Differences were assessed by Mann–Whitney U test or Chi-squared test
LAC lung adenocarcinoma, LSC lung squamous carcinoma, EGFR epidermal growth factor receptor, PD-L1 programmed cell death protein ligand 1
Detection of PD-L1 Expression Status
PD-L1 expression was assessed in formalin-fixed paraffin-embedded tumor samples acquired by surgical resection. Positive PD-L1 staining was defined as complete circumferential or partial cell membrane staining. The positive expression rate of PD-L1 was calculated as the percentage of PD-L1 positive cells in the total tumor volume. We defined “PD-L1 expression positive” as ≥ 1%. The whole testing was implemented according to Chinese Expert Consensus on Standards of PD-L1 Immunohistochemistry Testing for Non-small Cell Lung Cancer [29]. Then, 89 total patients were classified as having PD-L1 positive expression (PE) and 36 patients as having PD-L1 negative expression (NE).
CT Image Acquisition
Spiral CT chest scans were performed on all patients (Brilliance 256 iCT, Philips Healthcare, Cleveland, OH, or Somatom Force, Somatom Flash dual-source CT, Siemens, Germany). Scanning parameters were as follows: tube voltage 120 kV; automatic tube current, pitch 0.984 ~ 1.200, matrix 512 × 512, FOV 350 mm × 350 mm. After the initial data collection, all patients underwent a no interval reconstruction of 0.5 ~ 3.0 mm. A high-resolution lung algorithm was adopted. Breath-hold scans were performed with the patient in a supine position with both hands on both sides of the head. The scanning scope ranged from above the apex of the lungs to below the diaphragm. All CT scans were retrieved from the picture archiving and communication system for further feature extraction.
Tumor Segmentation
Region-of-interest (ROI) positioning was determined by two board-certified thoracic radiologists (with 9 and 10 years’ experience in chest CT imaging, respectively), who were blinded to the clinical and histologic findings. To test the effect of inter-observer variability on ROI delineation, which may affect radiomic feature extraction, two radiologists independently reviewed all CT images. Any discrepancies were resolved by agreement between the two radiologists. Tumor segmentation was implemented manually across the whole tumor using ITK-SNAP software (version 3.8.0; www.itksnap.org).
Radiomic Feature Extraction and Selection
The determined ROIs were transferred into the Python Pyradiomics library (version 2.0.1; available at https://github.com/Radiomics/pyradiomics) for radiomic feature extraction. The detailed extraction settings were set as follows: without normalization (CT gray values reflect absolute world values), the bin size was 25, the voxel array shift was 1000 (minimum value in HU is − 1000, shift + 1000 to prevent negative values from being squared), and resampled pixel spacing was [1, 1, 1] (using a linear interpolation method). We extracted 1287 quantitative radiomic features (13 morphology features, 18 histogram features, 73 texture features, and 1183 transform features) from each ROI. The details of features were provided in Pyradiomics documentation (https://pyradiomics.readthedocs.io/en/latest/index.html). Some of these features were described by the Imaging Biomarker Standardization Initiative (IBSI) [30].
The predictive performance of the features was evaluated using the ridge regression-based feature recursive elimination (RFE), and valuable features were selected for modeling. RFE can select the best features based on feature coefficient after repeatedly building models [31]. To obtain reasonably stable estimates [32], 9 features with the highest representation were selected from the original 1287 high throughput radiomic features for modeling. The correlation between the selected features was then analyzed, and clinical correlation analysis was performed to determine the biological significances [33].
Model Construction and Validation
The prediction models were built using machine learning models including random forest, decision tree, logistic regression, AdaBoost, Gaussian process, and support vector machine. The area under the receiver operating characteristic (ROC) curve (AUC) was used to compare the performance of each model. Finally, a logistic regression classifier with L2 regularization and a coefficient of 1 was developed based on the primary cohort using tenfold cross validation, as the final radiomic signature model. Radiomic score was calculated. To evaluate the stability of the model’s predictive performance, the final signature was tested in an external validation cohort. Additionally, the clinical model and radiomics-clinical nomogram were developed and compared to radiomic signature to determine the efficacy of prediction model.
Statistical Analysis
Statistical analysis was performed with SPSS (version 25; IBM Corporation, Armonk, NY, USA) and Python (version 3.6.6, https://www.python.org). The Kolmogorov–Smirnov test was performed to test the normal distribution of data. Differences in normally distributed data were tested using an unpaired t-test; non-normally distributed variables were tested using the Mann–Whitney U test. Differences in count variables were tested using the chi-squared test. Spearman’s test was used to assess the associations between different features. The RFE was used to reduce the dimensionality of the radiomic features. Logistic regressions were used to establish the final prediction models and nomogram. The ROC curve, AUC, and confusion matrix were used to evaluate the predictive performance of different classifiers. The Delong test was used to determine the difference in efficacy between different models. Tests were statistically significant at P < 0.05.
Result
Clinical Characteristics
Tables 1 and 2 show all the clinical characteristics acquired. There was no significant differences between the primary and validation cohorts (P = 0.097–0.836), except for the stage (P = 0.001) and diameter of nodule (P = 0.006). There was no significant difference in PD-L1 expression levels between clinical characteristics (P = 0.109–0.955).
Table 2.
Comparison of clinical characteristics according to PD-L1 expression
| Characteristics | All patients (N = 125) | PD-L1 PE (N = 89) | PD-L1 NE (N = 36) | P value |
|---|---|---|---|---|
| Age, mean (range) (years) | 54.49 (27–80) | 58.85 (27–76) | 57.58 (32–80) | 0.451 |
| Gender, n (%) | 0.955 | |||
| Male | 63 (50.4) | 45 (50.6) | 18 (50.0) | |
| Female | 62 (49.6) | 44 (49.4) | 18 (50.0) | |
| Smoking status, n (%) | 0.206 | |||
| Never | 87 (69.6) | 59 (66.3) | 28 (77.8) | |
| Smoker | 38 (30.4) | 30 (33.7) | 8 (22.2) | |
| Location, n (%) | 0.840 | |||
| Right upper lobe | 46 (36.8) | 31 (34.8) | 15 (41.7) | |
| Right middle lobe | 7 (5.6) | 6 (6.7) | 1 (2.8) | |
| Right lower lobe | 24 (19.2) | 17 (19.1) | 7 (19.4) | |
| Left upper lobe | 34 (27.2) | 24 (27.0) | 10 (27.8) | |
| Left lower lobe | 14 (11.2) | 11 (12.4) | 3 (8.3) | |
| CT pattern, n (%) | 0.713 | |||
| Pure solid nodule | 68 (54.4) | 48 (53.9) | 20 (55.6) | |
| Part-solid nodule | 46 (36.8) | 32 (36.0) | 14 (38.9) | |
| Ground glass nodules | 11 (8.8) | 9 (10.1) | 2 (5.5) | |
| Diameter of nodule, mean (range) (cm) | 1.66 (0.4–6.4) | 1.66 (0.4–6.4) | 1.65 (0.6–6.2) | 0.372 |
| Histological type, n (%) | 0.522 | |||
| LAC | 115 (92.0) | 81 (91.0) | 34 (94.4) | |
| LSC | 10 (8.0) | 8 (9.0) | 2 (5.6) | |
| Stage, n (%) | 0.909 | |||
| Tis | 4 (3.2) | 3 (3.4) | 1 (2.8) | |
| I | 106 (84.8) | 76 (85.4) | 30 (83.3) | |
| II and III | 15 (12.0) | 10 (11.2) | 5 (13.9) | |
| EGFR gene, n (%) | 0.695 | |||
| Mutant-type | 66(52.8) | 46 (51.7) | 20 (55.6) | |
| Wild-type | 59(47.2) | 43 (48.3) | 16 (44.4) | |
| Ki-67 expression, n (%) | 0.109 | |||
| Positive | 41 (32.8) | 33 (37.1) | 8 (22.2) | |
| Negative | 84 (67.2) | 56 (62.9) | 28 (77.8) |
Differences were assessed by Mann–Whitney U test or Chi-squared test
PD-L1 programmed cell death protein ligand 1, PE positive expression, NE negative expression, LAC lung adenocarcinoma, LSC lung squamous carcinoma, EGFR epidermal growth factor receptor
Valuable Radiomic Features
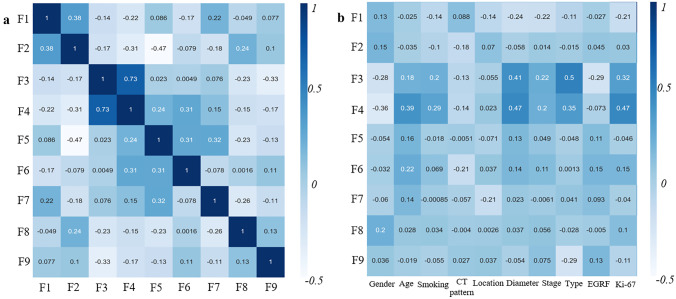
After feature selection process, 9 final radiomic features were acquired, which called F1–F9 (Table 3). All of these features were transform features, mainly from wavelet transformation (N = 8). Figure 3 shows the correlation analysis between these predictors. F3 and F4 had moderate correlation (r = 0.75); F3 showed weak correlation with pathological type (r = 0.5), and F4 showed weak correlation with Ki-67 expression (r = 0.47).
Table 3.
The details of the selected hand-crafted radiomic features
| Feature | Transformation | Feature type | Feature value | r† | P value |
|---|---|---|---|---|---|
| F1 | Log-sigma-4–0-mm-3D | GLSZM | Small area low gray level emphasis | −0.299 | 0.004 |
| F2 | Wavelet-LHL | GLCM | Cluster shade | −0.202 | 0.054 |
| F3 | Wavelet-LHH | First order | Kurtosis | 0.289 | 0.006 |
| F4 | Wavelet-LHH | GLCM | Idn | 0.321 | 0.002 |
| F5 | Wavelet-HLL | First order | Root mean squared | −0.209 | 0.047 |
| F6 | Wavelet-HLL | Ngtdm | Complexity | −0.019 | 0.860 |
| F7 | Wavelet-HHH | First order | Median | 0.078 | 0.464 |
| F8 | Wavelet-HHH | First order | Skewness | 0.214 | 0.042 |
| F9 | Wavelet-HHH | GLSZM | Size zone non uniformity normalized | 0.178 | 0.091 |
†Spearman correlation coefficient with two-sided test
Log Laplacian of Gaussian, GLSZM gray-level size-zone matrix, GLCM gray-level co-occurrence matrix, Ngtdm neighborhood gray tone difference matrix
Fig. 3.
Correlation analysis of radiomic features. a The correlation heatmap between F1-F9. b The correlation heatmap between F1–F9 and 10 clinical characteristics
Development of Machine Learning Models
The ROC curves that were generated from different machine learning models are outlined in Fig. 4. All the machine learning-based radiomic models can predict the PD-L1 expression levels (AUCs > 0.76), and that the logistic regression model had an AUC of 0.96 ± 0.01 (mean ± standard deviation), which outweighed other machine learning models (P < 0.001).
Fig. 4.
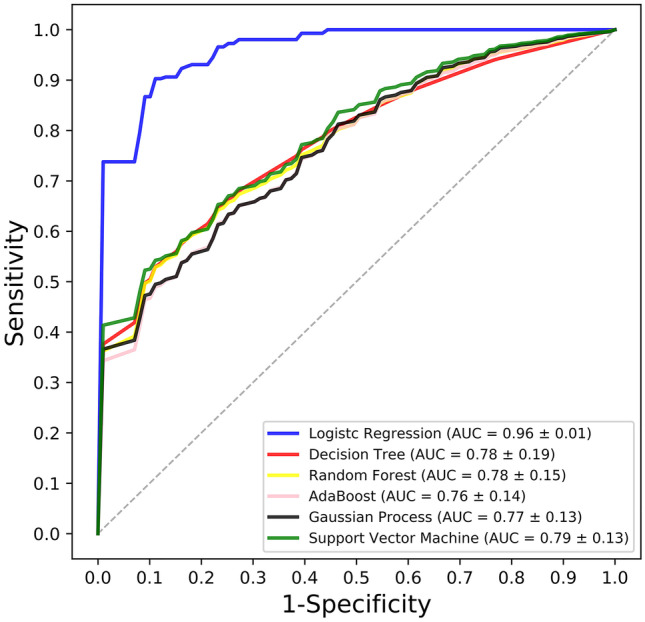
Graph shows the ROC curves of different machine learning models
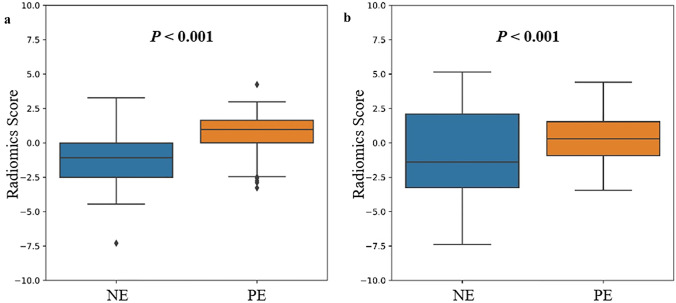
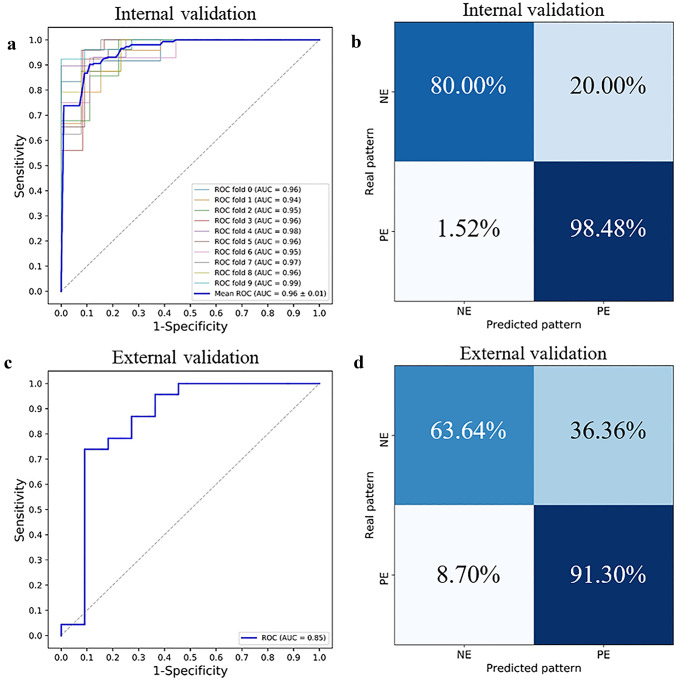
The formula for the radiomic score is provided in Table 4, and Fig. 5 shows the significant difference in radiomic scores between the PE and NE in the primary and validation cohorts (P < 0.001). Considering all the data, the radiomic score was significantly higher in the PD-L1 PE group than the NE group (0.526 ± 1.13, versus − 1.30 ± 0.69, P < 0.001). With tenfold cross validation, the AUC of our radiomic signature used to predict PD-L1 expression levels was 0.96 ± 0.01 with a specificity of 80.0% and sensitivity of 98.5%. All the 10 folds had an AUC > 0.94. In the independent external cohort, our radiomic signature had an AUC of 0.85 (specificity 63.6%, sensitivity 91.3%), thus demonstrating the efficacy of our final radiomic signature (see Fig. 6).
Table 4.
Radiomic score
| Radiomic score | = |
|---|---|
| − 1.09552856 × F1 | |
| − 0.86632614 × F2 | |
| + 0.58220868 × F3 | |
| + 0.97471849 × F4 | |
| − 0.77145334 × F5 | |
| − 0.92267150 × F6 | |
| + 0.84877258 × F7 | |
| + 0.52749997 × F8 | |
| + 0.77429202 × F9 |
The details of the F1–F9 are shown in Table 3
Fig. 5.
Comparison of radiomic scores between NE and PE groups. a Primary cohort and b validation cohort
Fig. 6.
The prediction performance of radiomic signature. The ROC curves in the a internal validation and c external validation cohorts. The confusion matrix in the b internal validation and d external validation cohorts
Radiomic Signature, Clinical Model, and Radiomics-Clinical Nomogram
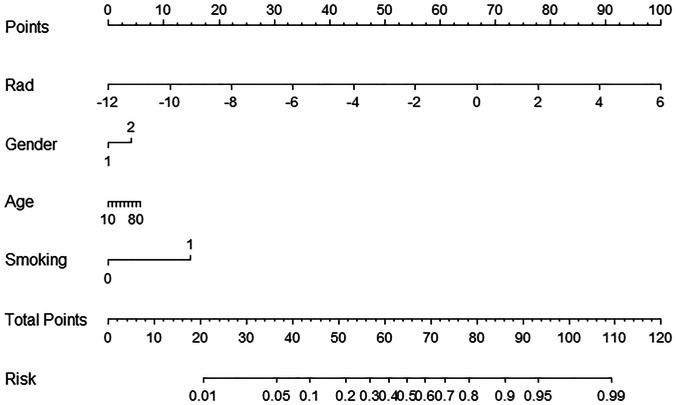
The clinical model was built using 10 clinical characteristics, and the radiomics-clinical nomogram was provided using the radiomic score, age, gender, and smoking status of each patient for convenient clinic application (see Fig. 7). Table 5 shows the performance metrics of radiomic signature, clinical model, and radiomics-clinical nomogram. The radiomic signature showed the highest performance of all the models (AUC = 0.96, versus AUC = 0.77–0.82, P < 0.001, in primary cohort; AUC = 0.85, versus AUC = 0.38–0.61, P < 0.001, in validation cohort). This predictive advantage was also demonstrated across other assessment indexes.
Fig. 7.
Radiomics-clinical nomogram was built using 4 features in primary cohort. Rad means radiomic score. The risk coefficient mapped from total points means the potential for PD-L1 positive expression
Table 5.
The performance metrics of radiomic signature, clinical model, and radiomics-clinical nomogram
| Index | Primary cohort | Validation cohort | ||||
|---|---|---|---|---|---|---|
| Radiomic signature | Clinical model | Radiomics-clinical nomogram | Radiomic signature | Clinical model | Radiomics-clinical nomogram | |
| AUC | 0.96 | 0.77 | 0.82 | 0.85 | 0.38 | 0.61 |
| ACC | 93.41% | 67.03% | 89.01% | 82.35% | 61.76% | 64.71% |
| TPR | 98.48% | 90.91% | 95.45% | 91.30% | 91.30% | 69.57% |
| TNR | 80.00% | 4.00% | 72.00% | 63.64% | 0.00% | 54.55% |
| PPV | 92.75% | 71.43% | 90.00% | 84.00% | 65.63% | 76.19% |
| NPV | 90.91% | 14.29% | 85.71% | 77.78% | 0.00% | 46.15% |
AUC area under receiver operating characteristic curve, ACC accuracy, TPR true positive rate (sensitivity), TNR true negative rate (specificity), PPV positive predictive value, NPV negative prediction value
Discussion
Tumor immunotherapy has been improving year by year, and immunosuppressive checkpoint pathways are considered one of the most promising treatment methods. However, to achieve accurate application of anti-PD-1/PD-L1 monoclonal antibody therapy in lung cancer patients, many challenges still need to be addressed, such as determining the expression levels of PD-L1 [34]. Due to tumor heterogeneity, reliability, and the high cost of biopsies, a non-invasive and easy-to-use method is needed to predict the expression of PD-L1 in lung cancer patients. Here, we developed and tested a CT-based hand-crafted radiomic signature, which can be used as a non-invasive tool to predict PD-L1 expression levels in non-small cell lung cancer.
To our knowledge, no imaging biomarker is currently used to identify PD-L1 expression levels. In our study, we found no significant difference in the PD-L1 expression levels between the clinical characteristics. And we found that combining radiomic score and clinical characteristics was worse at predicting than analyzing the radiomic signature only. This indicates that uncorrelated features could reduce the predictive performance of the model as a whole. Additionally, the poor predictive performance of clinical models indicated a need for a more accurate, non-invasive radiomic signature approach.
Radiomics can be used to transform images into high dimensional quantitative feature data and mine data that can help guide clinical decisions [35]. The results from our modeling demonstrated that the radiomic features extracted from pre-treatment CT images noticeably correlated with PD-L1 expression levels in NSCLC patients, which could reflect the biological characteristics and heterogeneity of tumors. We also found a weak correlation between radiomic and clinical characteristics. However, we hope to continue finding stronger and more specific correlations to examine radiomic features in-depth. Machine learning provides more complicated statistics capabilities, which can explore powerful prediction patterns. Of the different machine learning models we examined, the logistic regression-based radiomic approach was superior at predicting PD-L1 expression levels. The internal and external validation of the final radiomic signature showed that it could be used as an effective and non-invasive predictor of gene expression levels.
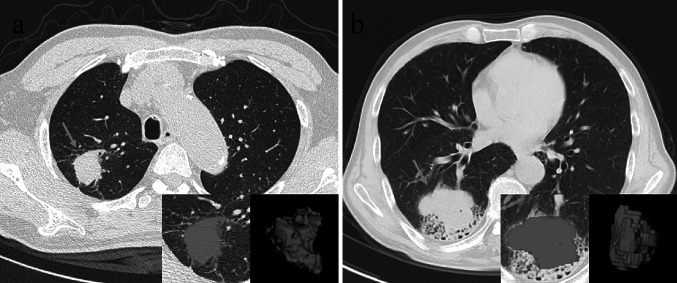
Here, we provide evidence for an effective, non-invasive application of CT radiomics to predict PD-L1 expression levels. Given the relatively low cost of CT scans and the high accuracy of their assessments, our radiomic signature may provide a relatively reliable assessment that can be used to guide immune-related treatment decisions, especially in cases where biopsies are unsuccessful, require multiple biopsies, or cannot be performed. These radiomic features and the final radiomic signature enable us to more fully assess the distinct tumor heterogeneity by analyzing the ROI of the whole tumor. Figure 8 shows two successful prediction examples.
Fig. 8.
Two typical successful prediction examples. a A 64-year-old male having PD-L1 positive expression, whose CT-based radiomic score is 0.71358; b a 66-year-old male having PD-L1 negative expression, whose CT-based radiomic score is − 3.69206
Despite these encouraging results, there are still some limitations to our current work. This study is a retrospective study, with its own potential bias, calling for further studies to prospectively validate our radiomic signature in an appropriate trial. Even so, this is a small but important part of the pre-treatment evaluation. Second, texture features were extracted from manually segmented data, which makes it difficult to exclude the small vessels and bronchi inside the nodules. This may have affected the accuracy of some features. Third, there are several testing methods used for confirm PD-L1 positivity [36], and we only built the predictor from one method. Fourth, this work does not provide insights to post-treatment changes in the radiomic signatures, which may be important to determine if a certain course of treatment should be followed or halted.
Conclusion
Our study demonstrated the feasibility of using CT-based hand-crafted radiomic signatures to effectively evaluate PD-L1 expression levels. Identifying PD-L1 expression using radiomic signatures can provide supplementary information for accurate medical treatment and clinical decisions.
Funding
This study was funded by the National Natural Science Foundation of China (NSFC61971271, NSFC81701656, NSFC81172133, NSFC81372413), the Taishan Scholars Project of Shandong Province (Tsqn20161023) and the Primary Research and Development Plan of Shandong Province (No. 2018GGX101018, No. 2019QYTPY020), the Special Fund for Scientific Research in the Public Interest (201402011), the Projects of Medical and Health Technology Development Program in Shandong Province (2014WS0058), and the Outstanding Youth Natural Science Foundation of Shandong Province (JQ201423).
Declarations
Ethics Approval
Approval was obtained from the ethics committee of Zhongshan Hospital Fudan University and Shandong Cancer Hospital. The procedures used in this study adhere to the tenets of the Declaration of Helsinki.
Conflict of Interest
The authors declare no competing interests.
Footnotes
Publisher's Note
Springer Nature remains neutral with regard to jurisdictional claims in published maps and institutional affiliations.
Zekun Jiang and Yinjun Dong contributed equally to this work.
Contributor Information
Shuanghu Yuan, Email: yuanshuanghu@sina.com.
Dengwang Li, Email: dengwang@sdnu.edu.cn.
Liheng Liu, Email: llh9821@163.com.
References
- 1.Gettinger SN, Horn L, Gandhi L, Spigel DR, Antonia SJ, Rizvi NA, Powderly JD, Heist RS, Carvajal RD, Jackman DM, Sequist LV, Smith DC, Leming P, Carbone DP, Pinder-Schenck MC, Topalian SL, Hodi FS, Sosman JA, Sznol M, McDermott DF, Pardoll DM, Sankar V, Ahlers CM, Salvati M, Wigginton JM, Hellmann MD, Kollia GD, Gupta AK, Brahmer JR. Overall survival and long-term safety of nivolumab (anti-programmed death 1 antibody, BMS-936558, ONO-4538) in patients with previously treated advanced non-small-cell lung cancer. J Clin Oncol. 2015;33(18):2004–2012. doi: 10.1200/JCO.2014.58.3708. [DOI] [PMC free article] [PubMed] [Google Scholar]
- 2.Herbst RS, Baas P, Kim DW, Felip E, Pérez-Gracia JL, Han JY, Molina J, Kim JH, Arvis CD, Ahn MJ, Majem M, Fidler MJ, De Castro G, Garrido M, Lubiniecki GM, Shentu Y, Im E, Dolled-Filhart M, Garon EB. Pembrolizumab versus docetaxel for previously treated, PD-L1-positive, advanced non-small-cell lung cancer (KEYNOTE-010): a randomised controlled trial. Lancet. 2016;387(10027):1540–1550. doi: 10.1016/S0140-6736(15)01281-7. [DOI] [PubMed] [Google Scholar]
- 3.C. Loughran, C. Keeling: Seeding of tumour cells following breast biopsy: a literature review. Br J Radiol 84(1006): 869–874, 2011. 10.1259/bjr/77245199. [DOI] [PMC free article] [PubMed]
- 4.Girard N, Sima CS, Jackman DM, Sequist LV, Chen H, Yang JCH, Ji H, Waltman B, Rosell R, Taron M, Zakowski MF, Ladanyi M, Riely G, Pao W. Nomogram to predict the presence of EGFR activating mutation in lung adenocarcinoma. Eur Respir J. 2012;39(2):366–372. doi: 10.1183/09031936.00010111. [DOI] [PubMed] [Google Scholar]
- 5.E. Rios Velazquez, C. Parmar, Y. Liu, T.P. Coroller, G. Cruz, O. Stringfield, Z. Ye, M. Makrigiorgos, F. Fennessy, R.H. Mak, R. Gillies, J. Quackenbush, H.J.W.L. Aerts: Somatic mutations drive distinct imaging phenotypes in lung cancer. Cancer Res 77(14): 3922–3930, 2017. 10.1158/0008-5472.CAN-17-0122. [DOI] [PMC free article] [PubMed]
- 6.H. Itakura, A.S. Achrol, L.A. Mitchell, J.J. Loya, T. Liu, E.M. Westbroek, A.H. Feroze, S. Rodriguez, S. Echegaray, T.D. Azad, K.W. Yeom, S. Napel, D.L. Rubin, S.D. Chang, G.R. Harsh, O. Gevaert: Magnetic resonance image features identify glioblastoma phenotypic subtypes with distinct molecular pathway activities. Sci Transl Med 7(303): 303ra138, 2015. 10.1126/scitranslmed.aaa7582. [DOI] [PMC free article] [PubMed]
- 7.Sacher AG, Dahlberg SE, Heng J, Mach S, Jänne PA, Oxnard GR. Association between younger age and targetable genomic alterations and prognosis in non-small-cell lung cancer. JAMA Oncol. 2016;2(3):313–320. doi: 10.1001/jamaoncol.2015.4482. [DOI] [PMC free article] [PubMed] [Google Scholar]
- 8.Li Y, Liu X, Xu K, Qian Z, Wang K, Fan X, Li S, Wang Y, Jiang T. MRI features can predict EGFR expression in lower grade gliomas: a voxel-based radiomic analysis. Eur Radiol. 2018;28(1):356–362. doi: 10.1007/s00330-017-4964-z. [DOI] [PubMed] [Google Scholar]
- 9.Yip SS, Aerts HJ. Applications and limitations of radiomics. Phys Med Biol. 2016;61(13):R150–R166. doi: 10.1088/0031-9155/61/13/R150. [DOI] [PMC free article] [PubMed] [Google Scholar]
- 10.Avanzo M, Stancanello J. Naqa IEl: Beyond imaging: the promise of radiomics. Phys Med. 2017;38:122–139. doi: 10.1016/j.ejmp.2017.05.071. [DOI] [PubMed] [Google Scholar]
- 11.Kermany DS, Goldbaum M, Cai W, Valentim CCS, Liang H, Baxter SL, McKeown A, Yang G, Wu X, Yan F, Dong J, Prasadha MK, Pei J, Ting MYL, Zhu J, Li C, Hewett S, Dong J, Ziyar I, Shi A, Zhang R, Zheng L, Hou R, Shi W, Fu X, Duan Y, Huu V, Wen C, Zhang ED, Zhang CL, Li O, Wang X. Michael A Singer, Xiaodong Sun, Jie Xu, Ali Tafreshi, M Anthony Lewis, Huimin Xia, Kang Zhang: Identifying medical diagnoses and treatable diseases by image-based deep learning. Cell. 2018;172(5):1122–1131. doi: 10.1016/j.cell.2018.02.010. [DOI] [PubMed] [Google Scholar]
- 12.Brown JR, Digiovanna MP, Killelea B, Lannin DR, Rimm DL. Quantitative assessment Ki-67 score for prediction of response to neoadjuvant chemotherapy in breast cancer. Lab Invest. 2014;94(1):98–106. doi: 10.1038/labinvest.2013.128. [DOI] [PubMed] [Google Scholar]
- 13.Diehn M, Nardini C, Wang DS, McGovern S, Jayaraman M, Liang Y, Aldape K, Cha S, Kuo MD. Identification of noninvasive imaging surrogates for brain tumor gene-expression modules. Proc Natl Acad Sci U S A. 2008;105(13):5213–5218. doi: 10.1073/pnas.0801279105. [DOI] [PMC free article] [PubMed] [Google Scholar]
- 14.Basu S, Kwee TC, Gatenby R, Saboury B, Torigian DA. Evolving role of molecular imaging with PET in detecting and characterizing heterogeneity of cancer tissue at the primary and metastatic sites, a plausible explanation for failed attempts to cure malignant disorders. Eur J Nucl Med Mol Imaging. 2011;38(6):987–991. doi: 10.1007/s00259-011-1787-z. [DOI] [PubMed] [Google Scholar]
- 15.Gillies RJ, Kinahan PE, Hricak H. Radiomics: images are more than pictures, they are data. Radiology. 2016;278(2):563–577. doi: 10.1148/radiol.2015151169. [DOI] [PMC free article] [PubMed] [Google Scholar]
- 16.Lambin P, Rios-Velazquez E, Leijenaar R, Carvalho S, Van Stiphout RGPM, Granton P, Zegers CML, Gillies R, Boellard R, Dekker A, Aerts HJWL. Radiomics: extracting more information from medical images using advanced feature analysis. Eur J Cancer. 2012;48(4):441–446. doi: 10.1016/j.ejca.2011.11.036. [DOI] [PMC free article] [PubMed] [Google Scholar]
- 17.Rutman AM, Kuo MD. Radiogenomics: creating a link between molecular diagnostics and diagnostic imaging. Eur J Radiol. 2009;70(2):232–241. doi: 10.1016/j.ejrad.2009.01.050. [DOI] [PubMed] [Google Scholar]
- 18.Zhou M, Leung A, Echegaray S, Gentles A, Shrager JB, Jensen KC, Berry GJ, Plevritis SK, Rubin DL, Napel S, Gevaert O. Non-small cell lung cancer radiogenomics map identifies relationships between molecular and imaging phenotypes with prognostic implications. Radiology. 2018;286(1):307–315. doi: 10.1148/radiol.2017161845. [DOI] [PMC free article] [PubMed] [Google Scholar]
- 19.Huang YQ, Liang CH, He L, Tian J, Liang CS, Chen X, Ma ZL, Liu ZY. Development and validation of a radiomics nomogram for preoperative prediction of lymph node metastasis in colorectal cancer. J Clin Oncol. 2016;34(18):2157–2164. doi: 10.1200/JCO.2015.65.9128. [DOI] [PubMed] [Google Scholar]
- 20.Aerts HJWL, Velazquez ER, Leijenaar RTH, Parmar C, Grossmann P, Cavalho S, Bussink J, Monshouwer R, Haibe-Kains B, Rietveld D, Hoebers F, Rietbergen MM, Leemans CR, Dekker A, Quackenbush J, Gillies RJ, Lambin P. Decoding tumour phenotype by noninvasive imaging using a quantitative radiomics approach. Nat Commun. 2014;5:4006. doi: 10.1038/ncomms5006. [DOI] [PMC free article] [PubMed] [Google Scholar]
- 21.Vallières M, Freeman CR, Skamene SR, El Naqa I. A radiomics model from joint FDG-PET and MRI texture features for the prediction of lung metastases in soft-tissue sarcomas of the extremities. Phys Med Biol. 2015;60(14):5471–5496. doi: 10.1088/0031-9155/60/14/5471. [DOI] [PubMed] [Google Scholar]
- 22.Yoon HJ, Sohn I, Cho JH, Lee HY, Kim JH, La Choi Y, Kim H, Lee G, Lee KS, Kim J. Decoding tumor phenotypes for ALK, ROS1, and RET fusions in lung adenocarcinoma using a radiomics approach. Medicine (Baltimore) 2015;94(41):e1753. doi: 10.1097/MD.0000000000001753. [DOI] [PMC free article] [PubMed] [Google Scholar]
- 23.Hong D, Xu K, Zhang L, Wan X, Guo Y. Radiomics signature as a predictive factor for EGFR mutations in advanced lung adenocarcinoma. Front Oncol. 2020;10:28. doi: 10.3389/fonc.2020.00028. [DOI] [PMC free article] [PubMed] [Google Scholar]
- 24.Liu Y, Kim J, Balagurunathan Y, Li Q, Garcia AL, Stringfield O, Ye Z, Gillies RJ. Radiomic features are associated with EGFR mutation status in lung adenocarcinomas. Clin Lung Cancer. 2016;17(5):441–448.e6. doi: 10.1016/j.cllc.2016.02.001. [DOI] [PMC free article] [PubMed] [Google Scholar]
- 25.Song J, Shi J, Dong D, Fang M, Zhong W, Wang K, Wu N, Huang Y, Liu Z, Cheng Y, Gan Y, Zhou Y, Zhou P, Chen B, Liang C, Liu Z, Li W, Tian J. A new approach to predict progression-free survival in stage IV EGFR-mutant NSCLC patients with EGFR-TKI therapy. Clin Cancer Res. 2018;24(15):3583–3592. doi: 10.1158/1078-0432.CCR-17-2507. [DOI] [PubMed] [Google Scholar]
- 26.Tu W, Sun G, Fan L, Wang Y, Xia Y, Guan Y, Li Q, Zhang D, Liu S, Li Z. Radiomics signature: a potential and incremental predictor for EGFR mutation status in NSCLC patients, comparison with CT morphology. Lung Cancer. 2019;132:28–35. doi: 10.1016/j.lungcan.2019.03.025. [DOI] [PubMed] [Google Scholar]
- 27.Z Sun, S Hu, Y Ge, J Wang, S Duan, J Song, C Hu, Y Li: Radiomics study for predicting the expression of PD-L1 in non-small cell lung cancer based on CT images and clinicopathologic features. J Xray Sci Technol 28(3):449–459, 2020. 10.3233/XST-190642. [DOI] [PubMed]
- 28.Yoon J, Suh YJ, Han K, Cho H, Lee HJ, Hur J, Choi BW. Utility of CT radiomics for prediction of PD-L1 expression in advanced lung adenocarcinomas. Thoracic Cancer. 2020;11(4):993–1004. doi: 10.1111/1759-7714.13352. [DOI] [PMC free article] [PubMed] [Google Scholar]
- 29.Chinese Anti-Cancer Association Lung Cancer Study Group of Committee of Oncopathology, Chinese Society of Lung Cancer, Expert Group on PD-L1 Testing Consensus: Chinese expert consensus on standards of PD-L1 immunohistochemistry testing for non-small cell lung cancer (in Chinese) Chin J Lung Cancer. 2020;23(9):733–740. doi: 10.3779/j.issn.1009-3419.2020.101.43. [DOI] [PMC free article] [PubMed] [Google Scholar]
- 30.A Zwanenburg, M Vallières, MA. Abdalah, HJWL. Aerts, v Andrearczyk, A Apte, S Ashrafinia, S Bakas, RJ. Beukinga, R Boellaard, M Bogowicz, L Boldrini, I Buvat, GJR. Cook, C Davatzikos, A Depeursinge, MC Desseroit, N Dinapoli, CV Dinh, S Echegaray, IE Naqa, AY. Fedorov, R Gatta, RJ. Gillies, V Goh, M Götz, M Guckenberger, SM Ha, M Hatt, F Isensee, P Lambin, S Leger, RTH. Leijenaar, J Lenkowicz, F Lippert, A Losnegård, KH. Maier-Hein, O Morin, H Müller, S Napel, C Nioche, F Orlhac, S Pati, EAG. Pfaehler, A Rahmim, A Rao, J Scherer, MM Siddique, NM. Sijtsema, JS Fernandez, E Spezi, R Steenbakkers, S Tanadini-Lang, D Thorwarth, EGC. Troost, T Upadhaya, V Valentini, LV. Dijk, J Griethuysen, FHP. Velden, P Whybra, C Richter, S Löck: The image biomarker standardization initiative: standardized quantitative radiomics for high-throughput image-based phenotyping, Radiology 295(2): 328–338, 2020. 10.1148/radiol.2020191145. [DOI] [PMC free article] [PubMed]
- 31.Wang J, Wu CJ, Bao ML, Zhang J, Wang XN, Zhang YD. Machine learning-based analysis of MR radiomics can help to improve the diagnostic performance of PI-RADS v2 in clinically relevant prostate cancer. Eur Radiol. 2017;27(10):4082–4090. doi: 10.1007/s00330-017-4800-5. [DOI] [PubMed] [Google Scholar]
- 32.Chalkidou A, O’Doherty MJ, Marsden PK. False discovery rates in PET and CT studies with texture features: a systematic review. PLoS One. 2015;10(5):e0124165. doi: 10.1371/journal.pone.0124165. [DOI] [PMC free article] [PubMed] [Google Scholar]
- 33.Fornacon-Wood I, Faivre-Finn C, O’Connor JPB, Price GJ. Radiomics as a personalized medicine tool in lung cancer: separating the hope from the hype. Lung Cancer. 2020;146:197–208. doi: 10.1016/j.lungcan.2020.05.028. [DOI] [PMC free article] [PubMed] [Google Scholar]
- 34.H Borghaei, L Paz-Ares, L Horn, DR. Spigel, M Steins, NE. Ready, LQ. Chow, EE. Vokes, E Felip, E Holgado, F Barlesi, M Kohlhäufl, O Arrieta, MA Burgio, J Fayette, H Lena, E Poddubskaya, DE. Gerber, SN. Gettinger, CM. Rudin, N Rizvi, L Crinò, GR. Blumenschein, SJ. Antonia, C Dorange, CT. Harbison, FG Finckenstein, JR. Brahmer: Nivolumab versus Docetaxel in advanced nonsquamous non–small-cell lung cancer. N Engl J Med 373(17):1627–39, 2015. 10.1056/NEJMoa1507643. [DOI] [PMC free article] [PubMed]
- 35.Lambin P, Leijenaar RTH, Deist TM, Peerlings J, De Jong EEC, Van Timmeren J, Sanduleanu S, Larue RTHM, Even AJG, Jochems A, Van Wijk Y, Woodruff H, Van Soest J, Lustberg T, Roelofs E, Van Elmpt W, Dekker A, Mottaghy FM, Wildberger JE, Walsh S. Radiomics: the bridge between medical imaging and personalized medicine. Nat Rev Clin Oncol. 2017;14(12):749–762. doi: 10.1038/nrclinonc.2017.141. [DOI] [PubMed] [Google Scholar]
- 36.Kim H, Chung JH. PD-L1 testing in non-small cell lung cancer: past, present, and future. J Pathol Transl Med. 2019;53(4):199–206. doi: 10.4132/jptm.2019.04.24. [DOI] [PMC free article] [PubMed] [Google Scholar]


