

Abstract
Phosphinothricin (PPT) is one of the most prevalently using herbicides. The commercial phosphinothricin products are generally in the form of a racemic mixture, of which only the l-phosphinothricin (L-PPT) gives herbicidal function. Synthesis of optically pure L-PPT by deracemization of D/L-PPT is a promising way to cut down the environmental burden and manufacturing cost. To convert D/L-PPT to L-PPT, we expressed the catalytic enzymes by genomic integration in E. coli. The whole production was implemented in two steps in one pot using four catalytic enzymes, namely d-amino acid oxidase, catalase, glutamate dehydrogenase, and glucose dehydrogenase. Finally, after a series of process optimization, the results showed that with our system the overall L-PPT yield reached 86%. Our study demonstrated a new strategy for L-PPT synthesis, based on enzymes from chromosomal integrated expression, which does not depend on antibiotic selection, and shows a high potential for future industrial application.
Keywords: l-phosphinothricin, Genomic integration, Biocatalysis, Deracemization
Introduction
Phosphinothricin entered the market as a broad-spectrum herbicide since 1980s, and had been widely used since then due to its character of low toxicity, quick natural degradation, and high herbicidal efficiency. Its structure contains a chiral center; thus, there are two optical isomers, of which the l-phosphinothricin (L-PPT) is the active form as herbicide, while the d enantiomer (D-PPT) has no herbicidal activity (Xue et al. 2018). Moreover, it has been proved that D-PPT may cause male sterility and soil hardening (Horsman and Zechel 2017), while l-phosphinothricin can be easily degraded and is less toxic to humans and animals. However, the commercial products of phosphinothricin in the current market are generally racemic mixtures. It is definitely of great interest to upgrade the current product by replacing the racemic mixture to optically pure L-PPT. By doing this, we may reduce the herbicide dosage and ease the environmental burden (Jia et al. 2020). Chemical methods and biocatalysis methods are the two ways to prepare L-PPT. The chemical synthesis methods are usually complicated in synthesis steps, with high cost and low yield, and environmental unfriendly. Employing the active enzymes, the biocatalysis methods may achieve the mission with strict stereoselectivity, mild reaction conditions, and high yield. Exploring the feasibility of enzymatic production of L-PPT has very important industrial value and might bring in significant social benefits (Jin et al. 2019; Kang et al. 2019). Previously, we have engineered and tested several enzymes for optically pure L-PPT production, and have shown a high potential to synthesize L-PPT via enzymatic asymmetric conversion (Jin et al. 2019; Cheng et al. 2020; Jia et al. 2019). In our production route, D-PPT was firstly converted by a d-amino acid oxidase (DAAO, EC 1.4.3.3) to 2-oxo-4-[(hydroxy) (methyl) phosphinoyl] butyric acid (PPO) (Xu et al. 2021). Subsequently, PPO was transformed asymmetrically to L-PPT by a glutamate dehydrogenase (GluDH, EC 1.4.1.2 1.4.1.4), a member of the amino acid dehydrogenase superfamily (Brunhuber et al. 1994), coupling with a glucose dehydrogenase (GDH) for efficient regeneration of the nicotinamide cofactor NADPH. DAAO is a typical flavin protease with flavin adenine dinucleotide (FAD) as the cofactor. In the reaction, d-amino acid can be oxidized by DAAO to produce the corresponding keto acid and ammonia. It has been reported that DAAO can be used to transform the d-form of racemic mixture PPT into PPO (Xu et al. 2021). However, in the same reaction, the reduced FAD is oxidized to produce hydrogen peroxide. The by-product H2O2 may decarboxylate PPO and deactivate DAAO, and ultimately reduce the yield greatly (Hernandez et al. 2012; Trost and Fischer et al. 2002). Therefore, additional catalase (CAT) needs to be included in the reaction to eliminate the influence of H2O2 (Fig. 1).
Fig. 1.

The synthesis route to transform D-PPT to PPO with an oxidative reaction
This production route gives a high feasibility for industrial application. However, all the current researches on this topic are implemented using the plasmid expression method. Generally, the episomal plasmids are more favorable to be used for heterologous protein expression when compared to the chromosomal integration. Technically, plasmid expression is usually easy, fast, and cost effective, and mostly ends up with multicopy number in the cells, which is conventionally considered to be able to confer a high expression level. However, over-expression of foreign proteins may result in increased metabolic burden to the cells, especially when multiple genes need to be expressed. At the meanwhile, the plasmids are usually not stable in the bacteria, and antibiotics are frequently applied to maintain the plasmids in the cells, which is not in favor of in the modern industry due to the environmental concern, as well as the additional cost of antibiotics and waste treatment. To address this problem, the chromosomal integration method can be used instead of plasmid expression. However, it is more difficult to implement the genomic manipulation than the plasmid cloning. The size of DNA fragment to be inserted and the integration site are considered to have an impact to the genetic engineering efficiency, while the integration site also plays a crucial role to the gene expression level (Englaender et al. 2017). Regarding to the choice of integration sites, several laws need to obey. Nakashima et al. chose the pseudogenes yghX, ybeM, ybfG, and yeeL as the gene knock-in loci to minimize unwanted alteration of cellular functions (Nakashima et al. 2014). Englaender et al. found that the expression level of the fluorescent reporter protein mCherry was higher in the atp-gidB locus, when compared to the lacZ, recA, and ybbD loci (Englaender et al. 2017). Site-specific integration employs the homologous recombination process. The genetic manipulation techniques have been developed very fast during the past few years, and many useful tools are available now for the research community (Sabri et al. 2013; Tas et al. 2015; Jiang et al. 2015; Zhao et al. 2016; Chung et al. 2017).
In our work, several key genes encoding the L-PPT synthesis enzymes were integrated as the first time into the Escherichia coli genome through the CRISPR/Cas-mediated double-plasmid expression system (Jiang et al. 2015). At first, the genes encoding DAAO and CAT were integrated into the locus of ybbD-ylbG. After that, the genes encoding GluDH and GDH were directly integrated into the locus of atpI-gidB in a second E. coli cell. Finally, L-PPT was synthesized by a one-pot two-step method using racemic D/L-PPT as the substrate (Fig. 2). The two constructed strains were used as whole-cell catalysts, and the overall yield of L-PPT reached 86%, which in our experiment was close to the episomal plasmid expression method. Our results demonstrated that the chromosomal integrated expression method has a high potential for industrial production of L-PPT.
Fig. 2.

The route of deracemization of D/L-PPT to synthesize optically pure L-PPT
Materials and methods
Strains, reagents, and culture media
The E. coli strain W3110(DE3) used in this study for genome editing was received from Department of Biotechnology, Catholic University of Korea (Kwon et al. 2011).
The Luria–Bertani (LB) medium (10 g/L tryptone OXOID™, 5 g/L yeast extract OXOID™, 10 g/L NaCl) was used for shake flask cultivation. Ampicillin (100 mg/L, Sigma-Aldrich®), kanamycin (50 mg/L, Sigma-Aldrich®), spectinomycin (50 mg/L, Sigma-Aldrich®), IPTG (120 mg/L, Sigma-Aldrich®), or 1 M L-arabinose (Sigma-Aldrich®) was supplemented for resistance selection in genetic manipulation or transcription induction.
Genomic DNA was extracted using the FastDNA® kit (Amercia) according to the manufacturer’s directions. Phanta® Max Super-Fidelity DNA polymerase (Vazyme, Nanjing,china), ClonExpress® II OneStep Cloning kit (Vazyme, Nanjing, china), AxyPrep™ Plasmid Miniprep kit (Corning, Suzhou, china), and AxyPrep™ PCR clean-up kit (Corning, Suzhou, china) were used for cloning. Racemic D/L-PPT was provided from Shandong Lvba Chemical Co., Ltd (Dezhou, China).
Construction of plasmids and donor DNA
Plasmids pETDuet-pmGluDH-V375S-EsGDH and pCDFDuet-DAAO-GbCAT with target genes were obtained from our stock (Xu et al. 2021; Cheng et al. 2020). The genes encoding DAAO (Xu et al. 2021), CAT (Jia et al. 2016), GluDH (Cheng et al. 2020), and GDH (Liu et al. 2015) were originated from different bacteria and have been previously reported. Genes encoding GluDH and GDH were amplified from the vector pETDuet-pmGluDH-V375S-EsGDH using primers GG-F and GG-R, while genes encoding DAAO and CAT were amplified from plasmid pCDFDuet-DAAO-GbCAT using primers DC-F and DC-R. The donor DNA was obtained by flanking the targeted genes with 500 bp homologous sequences to each side by fusion PCR, and thereafter cloned into the plasmid pTarget (Jiang et al. 2015), which was designed to carry the gRNA encoding sequence. Two gRNA targeting sequences were designed as TAAGAAAACATTGACAGTGA and GAAATATCATAAACTTGCAA corresponding to the inserting sites ybbD-ylbG and atpI-gidB in the genome. pTarget-GluDH-GDH, pTarget-DAAO-CAT were constructed by inserting the donor DNA through one-step cloning kit. All the primers and plasmids used in this research are listed in Table 1.
Table 1.
Primers in this study
| Primer | Nucleosides |
|---|---|
| DC-F | aaacattgacagtgaGCTTCTCAAATGCCTGAGGT |
| DC-R | cttgttccctggcccCCTTATGCGACTCCTGCATT |
| L1-F | ATCTGTTCGGTATGTACGGC |
| L1-R | aggagtcgcataaggTCACTGTCAATGTTTTCTTAAACC |
| R1-L | aggcatttgaggagcGGGCCAGGGAACAAGTGG |
| R1-R | GCTGGTTTTCCGCTAATGGT |
| pT-DC-F | TAATACTAGTTAAGAAAACATTGACAGTGAGTTTTAGAGCTAGAAATAGCAA |
| pT-DC-R | GCTCTAAAACTCACTGTCAATGTTTTCTTAACTAGTATTATACCTAGGACTG |
| GG-F | atcataaacttgcaaCGAGATCGATCTCGATCCCG |
| GG-R | tggcaaatgatgcctCGCCAATCCGGATATAGTTCC |
| L2-F | TCTCTGAACGATATGGTGAGCTG |
| L2-R | tcgagatcgatctcgTTGCAAGTTTATGATATTTCAGTC |
| R2-F | atatccggattggcgAGGCATCATTTGCCAAGTAAAT |
| R2-R | GGTGACGCCAGGCAAATATC |
| pT-GG-F | TAATACTAGTGAAATATCATAAACTTGCAAGTTTTAGAGCTAGAAATAGCAA |
| pT-GG-R | GCTCTAAAACTTGCAAGTTTATGATATTTCACTAGTATTATACCTAGGACTG |
Lowercase letters are corresponding to the homology arms, while the underlined letters are the gRNA targeting sequences
CRISPR-Cas assay
The genomic DNA integration was implemented by the CRISPR-Cas method, which has been described by Jiang et al. (2015). Briefly, plasmid pCas was firstly transformed to the parent W3110(DE3) strain to get W3110(DE3-pCas). The W3110(DE3-pCas) cells were then grown in kanamycin (to maintain the pCas plasmid) and arabinose (to induce the Cas protein expression) containing medium for competent cells preparation. Plasmid pTarget and the corresponding donor DNA were again transformed by the electroporation method (2 mm electro-cuvette, 2.5 kV, 200 Ω, BIO-RAD MicrPulser). After the electroporation, the competent cells were recovered for 2 h in LB medium. The cells were subsequently spread on an LB plate containing spectinomycin (for selection of pTarget) and kanamycin. The resistant cells were isolated and PCR screened for insertion of the target genes. The genetically engineered cells were sequenced in the end to confirm the correct integration of the target genes. The two plasmids were removed after the correct integration had been confirmed.
Catalytic reactions
The oxidative reaction from D/L-PPT to PPO was catalyzed by the E. coli W3110(DE3)/DAAO-CAT. First of all, the E. coli cells W3110(DE3)/DAAO-CAT were incubated with IPTG (0.1 mM final concentration) at 28 °C for about 12 h to induce gene transcription. The catalytic reactions were carried out in 150 ml reaction flasks with 30 mL reaction mixture containing 20 mM D/L-PPT and 20 g/L wet cell and incubated at 200 rpm shaking speed, 30 °C, and pH 8. After the reactions were finished, the mixtures were taken for determination of conversion rates by high performance liquid chromatography (HPLC). The expression induction conditions and catalytic reaction conditions were optimized to maximize the conversion rate. For this purpose, different cell weights (5–20 g/L) were loaded, oxygen requirement was tested, different inducer concentrations (0.01–1 mM), and induction temperature (18–28 °C), induction durations (12–20 h) and substrate concentrations (20–100 mM) were examined.
The reductive reaction from PPO to L-PPT was performed by the E. coli W3110(DE3)/GluDH-GDH. Similarly, cells were incubated with IPTG (0.2 mM final concentration) at 28 °C for 14 h to induce gene transcription. The reaction was performed in 30 mL reaction mixture containing 20 g/L wet cell weight, 50 mM PPO, 75 mM co-substrate glucose, 75 mM (NH4)2SO4, and 1 mM coenzyme NADP+ and incubated at 500 rpm shaking speed, 35 °C, and pH 7.5. The expression induction conditions and catalytic reaction conditions were also optimized by testing different induction durations, temperatures, the inducer concentrations, substrate concentrations, (NH4)2SO4, and glucose concentrations. Samples were taken at certain time intervals for HPLC determination.
Due to the fact that glucose has an inhibitory effect on the oxidation reaction (Cao et al. 2021), we used a one-pot two-step process to synthesize L-PPT. In the first oxidative reaction, the 30 mL reaction mixture containing 20 mM D/L-PPT and 20 g/L wet cells of E. coli W3110(DE3)/DAAO-CAT. The whole reaction lasted for 5 h. In the second reductive reaction, 50 mM glucose, 75 mM (NH4)2SO4, 1 mM NADP+ and 20 g/L wet cells of E. coli W3110(DE3)/GluDH-GDH were added to the first reaction cocktail to produce L-PPT. The reductive reaction lasted for 5 h.
HPLC
The D/L-PPT was quantified using the HPLC method (Cao et al. 2021) on a C18 column (Unitary C18, 5 μm, 100 A, 4.6 mm × 250 mm) at a flow rate of 1 mL/min. The determination was carried out at fluorescence wavelengths of λex = 340 nm and λem = 450 nm after 5 min of derivatization using o-phthalaldehyde (OPA) and N-acetyl-L-cysteine (NAC) at 30 °C. The mobile phase consisted of 50 mM ammonium acetate and methanol (9:1 v/v), and was calibrated at pH 5.7. The retention time for D-PPT and L-PPT was 12.5 min and 11 min, respectively. The samples for HPLC determination were prepared as follows: 50 μL reaction samples were mixed with 2 μL hydrochloric acid (6 M) to stop the reaction. The mixture was centrifuged and the supernatant was diluted for 10 times with MilliQ water (produced by Milli-Q A10 by Millipore). The 200 μL prepared samples were mixed with 400 μL derivatization reagents (2 g/L OPA, 2.4 g/L NAC) and 400 μL MilliQ water. The prepared samples were finally filtered by 0.22 μm membrane for HPLC determination (HPLC: Waters, 2695 separations module; detector: Waters 2487 Dual λ Absorbance Detector). All measurements were implemented in triplicate and experiments were repeated three times to calculate the standard deviation.
PPO was analyzed using a similar setup, using the mobile phase, including acetonitrile and mixture (5.75 g/L ammonium dihydrogen phosphate and 1 g/L tetrabutylammonium bromide) in a ratio of 12:88 (v/v), and calibrated at pH 3.7. The flow rate was set at 1.0 mL/min with a detection wavelength of 232 nm.
Result
Construction of DAAO and CAT expression E. coli strain and synthesis of PPO from D-PPT
A single copy of the genes encoding DAAO and CAT was integrated into the ybbD-ylbG locus; the transformants were screened by colony PCR and confirmed by sequencing. The genes were transcribed by the lac promoter. SDS-PAGE analysis showed that DAAO and CAT were successfully coexpressed in a recombinant E. coli W3110(DE3)/DAAO-CAT (Fig. 3). The transcription induction conditions were optimized according to the conversion rate (Fig. 4). For best performance, 0.1 mM IPTG (Fig. 4a) was used and cells were induced for 12 h (Fig. 4b) at 28 °C (Fig. 4c).
Fig. 3.
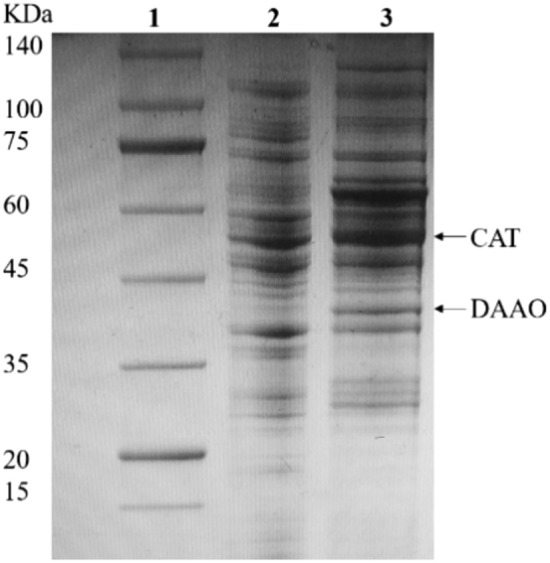
SDS-PAGE of the recombinant E. coli W3110(DE3)/DAAO-CAT. The cells were induced by 0.1 mM IPTG for 12 h at 28 °C. Lane 1, marker of protein molecular weight; Lane 2, the wild-type strain; Lane 3, the E. coli strain W3110(DE3)/DAAO-CAT
Fig. 4.

Effect of transcription induction conditions to the conversion rate of the oxidative reaction. a Effect of IPTG dosages to the conversion rate. b Effect of the expression induction time to the conversion rate. c Effect of the incubation temperatures to the conversion rate. The catalytic reaction was carried out in a 150 ml reaction flask with 30 mL reaction mixture containing 20 mM D/L-PPT and 20 g/L wet cell and incubated at 200 rpm shaking speed, 30 °C, and pH 8. Y axis: conversion rate of the reaction. The mean values and standard deviations are calculated based on three independent repeats
The reaction conditions were also optimized. First of all, different amounts of wet cell weight were used for the catalytic reaction (Fig. 5a). The conversion rate increased when increased amount of wet cells were added. The conversion rate reached 98% when 20 g/L wet cells were added. Oxygen as an auxiliary substrate may have an impact on the reaction. Thus, the effect of oxygen on the reaction was preliminarily evaluated by opening or closing the lid of the reaction flasks. The results showed that when the lid was removed and the reaction was carried out with air contacted, the conversion rate reached 98%, whereas when the reaction was implemented in a closed flask, the conversion rate decreased to 81% (Fig. 5b). This could be because that the remaining oxygen in the bottles was not sufficient to support the whole reaction. Furthermore, we also investigated the influence of substrate concentration to the catalytic reaction and found that when the concentration of D/L-PPT was 20 mM, the conversion rate of D-PPT to PPO reached the maximum 98%. This conversion rate dropped with the increasing of the substrate concentration. When the concentration of D/L-PPT reached 300 mM, the conversion rate dropped to 56% after 5 h of reaction, indicating that the biocatalyst might be sensitive to the substrate (Fig. 5c).
Fig. 5.

Effect of reaction conditions to the conversion rate of the oxidative reaction. a Effect of bacteria weight to the conversion rate. b Effect of air contact to the conversion rate. During the reaction, the flasks were either with the lid open or with the lid closed. c Effect of substrate concentration to the conversion rate. The catalytic reaction was carried out in a 150 ml reaction flask with 30 mL reaction mixture containing 20 mM D/L-PPT (if not tested) and 20 g/L wet cell (if not tested) and incubated at 200 rpm shaking speed, 30 °C, and pH 8. Y axis: conversion rate of the reaction. The mean values and standard deviations are calculated based on three independent repeats
Construction of GluDH and GDH expression E. coli strain and synthesis of L-PPT from PPO
The genes encoding GluDH and GDH were integrated into the atpI-gidB locus, and their expressions were also driven by the lac promoter. The recombinant strain was successfully verified by colony PCR and confirmed by sequencing. SDS-PAGE analysis showed that GluDH and GDH were successfully expressed in the recombinant E. coli W3110(DE3)/GluDH-GDH (Fig. 6).
Fig. 6.

SDS-PAGE of the recombinant strain E. coli W3110(DE3)/GluDH-GDH. The cells were induced by 0.2 mM IPTG for 14 h at 28 °C. Lane 1, protein molecular weight marker; Lane 2, the wild-type strain; Lane 3, E. coli W3110(DE3)/GluDH-GDH
Asymmetric reductive amination of prochiral keto acids by amino acid dehydrogenases is a very efficient strategy for the production of chiral α-amino acids (Xue et al. 2018). The GluDH used in this research has been developed previously (Cheng et al. 2020). However, this catalytic process requires the enzymatic cofactor NADPH, while for economic concern, regeneration of NADPH is necessary for industry production. Dehydrogenases, such as FDH from Lactobacillus buchneri (Alpdagtas et al. 2018), ADH from Lactobacillus brevis (Leuchs and Greiner 2011), and GDH from Exiguobacterium sibiricum, were frequently used for regeneration of enzymatic cofactor (Liu et al. 2015) (Fig. 7). Previously, we found that the GDH-mediated cofactor regeneration system had the highest yield, but not the plasmid expression system.
Fig. 7.

Amino acid dehydrogenase coupling cofactor regeneration system for reductive reaction to synthesize L-PPT from PPO
The impact of induction duration, inducer concentration, induction temperature, NADP+ dosage, and the ratio of PPO to glucose or ammonium sulfate to the reductive reaction was evaluated based on the L-PPT yield. The best enzyme production conditions were obtained as such: the catalytic cells were induced by 0.2 mM IPTG (Fig. 8a) and cultured at 28 °C (Fig. 8b) for at least 14 h (Fig. 8c). We tested a series conditions for best reaction performance. Due to the fact that the native NADP+/NADPH level in cells is often very low, additional NADP+/NADPH need to be added (Zhang et al. 2013; Wang et al. 2016). In this study, we used the optimal amount of NADP+ of 1.5 mM for reaction (Fig. 9a). It has been reported that the activity of amino acid dehydrogenase increases with the increase of NH4+ within a certain concentration rang (Marangoni et al. 2003; Taylor et al. 2002; Yin et al. 2018). In our experiment, the conversion rate reached the maximum when the (NH4)2SO4/PPO (mmol/mmol) ratio was raised to 1.5 (Fig. 9b). As an auxiliary substrate, glucose is necessary for recycling NADPH with GDH. The optimal concentration of glucose was also investigated (Fig. 9c). When the ratio of glucose to the substrate is equal to 1:1, the conversion rate reached the maximum. In the end, the impact of the substrate to the catalytic reaction was also evaluated (Fig. 9d). According to our results, the substrate concentration did not show a significant impact to the catalytic efficiency when 50–300 mM PPO were tested. When 300 mM substrate was added, 85% PPO was converted to L-PPT in about 5 h, which is similar to that of 50 mM PPO.
Fig. 8.

Effect of the transcription conditions to L-PPT yield in the reductive reaction. Different a inducer concentrations, b induction durations, and c incubation temperatures were tested based on the final L-PPT yield. The reaction was performed in 30 mL reaction mixture containing 20 g/L wet cell weight, 50 mM PPO, 50 mM co-substrate glucose, 75 mM (NH4)2SO4, and 1 mM coenzyme NADP+ and incubated at 500 rpm shaking speed, 35 °C, and pH 7.5. The yield of L-PPT was measured after 5 h of reaction. The mean values and standard deviations are calculated based on three independent repeats
Fig. 9.

Effect of reaction conditions to L-PPT yield of the oxidative reaction. Different a amounts of NADP+, b the ratio of PPO to (NH4)2SO4, c the ratio of PPO to glucose, d amount of substrate were tested based on the L-PPT yield. The reaction was performed in 30 mL reaction mixture containing 20 g/L wet cell weight, 50 mM PPO (if not tested), 50 mM co-substrate glucose (if not tested), 75 mM (NH4)2SO4 (if not tested), and 1 mM coenzyme NADP+ (if not tested) and incubated at 500 rpm shaking speed, 35 °C, and pH 7.5. The yield of L-PPT was measured after 5 h of reaction. The mean values and standard deviations are calculated based on three independent repeats
Comparison of chromosomal integration and plasmid expression systems
We compared the genomic integrated expression strains to the plasmid expression strains with their catalytic efficiencies. The plasmids we used were pCDFduet/DAAO-CAT and pETduet/GluDH-GDH, which have been previously reported (Cao et al. 2021; Cheng et al. 2020). The enzyme-encoding genes to be expressed were all fused with the same promoters in both expression systems, and were all expressed with E. coli W3110(DE3). For catalyzing D-PPT to PPO, the plasmid expression method showed to have a higher catalytic efficiency in comparison to the genomic integrated expression method (Fig. 10a). The plasmid expression method reached a similar maximum conversion rate an hour earlier than the genomic integrated expression method. For catalyzing PPO to L-PPT, the plasmid expression method showed to have a slightly higher yield (90%) in comparison to the genomic expression method (85%) (Fig. 10b).
Fig. 10.

Comparison of the genomic integrative expression method and plasmid expression method on the conversion rate of D-PPT and L-PPT yield. a Diagram of catalytic reaction from D-PPT to PPO; b diagram of catalytic reaction from PPO to L-PPT. X axis: reaction time; Y axis: conversion rate of D-PPT or L-PPT yield. The mean values and standard deviations are calculated based on three independent repeats
One-pot two-step deracemization reaction to synthesize L-PPT from D/L-PPT
Glucose has a significant inhibitory effect on oxidation reaction catalyzed by DAAO-CAT. A “one-pot two-steps” strategy was designed to eliminate this inhibitory effect. Two different substrate concentrations 20 mM and 100 mM were tested. Firstly, the oxidative deamination was carried out using D/L-PPT as the substrate, while E. coli W3110(DE3)/DAAO-CAT was taken as the biocatalyst. When 20 mM D/L-PPT was used, the D-PPT had been almost completely converted to PPO after 5 h of reaction. The reaction mixture was directly taken as the substrate for the second part reaction. In the reduction reaction, E. coli W3110(DE3)/GluDH-GDH, (NH4)2SO4, glucose, and NADP+ were added to initiate the synthesis of L-PPT. After 5 h, the total product yield of 85% was obtained (Fig. 11a). When 100 mM D/L-PPT was used, the overall yield of L-PPT was decreased to 79% (Fig. 11b).
Fig. 11.

Time course of two-stage one-pot deracemization of D/L-PPT to L-PPT was performed using integrated strain E. coli W3110(DE3)/DAAO-CAT and E. coli W3110(DE3)/GluDH-GDH. a 20 mM of substrate was used for the reaction b 100 mM of substrate was used for the reaction. The mean values and standard deviations are calculated based on three independent repeats
Discussion
Plasmid expression has been extensively applied for protein synthesis in synthetic biology. However, in comparison to the plasmid expression system, the chromosomal integrative expression strategy was barely used, whereas its advantages, such as high stability, avoid antibiotics, economic, and environmental friendly, are well known. As the first time, we expressed the L-PPT synthesis enzymes using the chromosomal integration method and successfully achieved the deracemization of D/L-PPT to synthesize L-PPT using the “one-pot two-steps” strategy, which has been widely utilized in many multi-enzyme cascade processes to solve non-affinity between enzymes (Yu et al. 2018; Zhang et al. 2017). In our study, the overall L-PPT yield reached 86% using the chromosomal integrative method and the “one-pot two-step” system, suggesting a high potential to apply this green synthesis method for industrial production of L-PPT. However, additional work remains to be done. The plasmid expression method ended up with a higher L-PPT yield and D-PPT conversion rate when compared to the genomically integrative expression method, whereas not dramatically differed. Optimal gene copy number and expression capacity need to be studied. The multicopy plasmid might confer a higher expression level, whereas it was also reported that the cells might be overloaded by the increasing gene copy number (Englaender et al. 2017). In the first oxidative reaction, we used a substrate concentration of 20 mM, which is low for direct industrial application, and might result in low production efficiency. However, increasing the substrate concentration ended up with a decreased conversion rate. This result suggested that there might be a strong substrate inhibitory effect to the biocatalyst. The substrate tolerance of the cells and enzymes needs to be improved further more. Besides this, the overall conversion rate was around 86%, there is still effort to do to improve the enzymes from the reductive reaction for a higher L-PPT yield.
Acknowledgements
This work was supported by the National Natural Science Foundation of China (No. 21978268).
Author contributions
Y-KC created the idea and wrote the first draft. HG implemented the laboratory work. Y-PX and Y-GZ provided financial support and finalized the draft.
Declarations
Conflict of interest
The authors declare that they have no conflict of interest in this publication.
References
- Alpdagtas S, Yucel S, Kapkac HA, Liu SQ, Binay B. Discovery of an acidic, thermostable and highly NADP(+) dependent formate dehydrogenase from Lactobacillus buchneri NRRL B-30929. Biotechnol Lett. 2018;40(7):1135–1147. doi: 10.1007/s10529-018-2568-6. [DOI] [PubMed] [Google Scholar]
- Brunhuber NMW, Blanchard JS. The biochemistry and enzymology of amino-acid dehydrogenases. Crit Rev Biochem Molec Biol. 1994;29(6):415–467. doi: 10.3109/10409239409083486. [DOI] [PubMed] [Google Scholar]
- Cao CH, Gong H, Dong Y, Li JM, Cheng F, Xue YP, Zheng YG. Enzyme cascade for biocatalytic deracemization of D, L-phosphinothricin. J Biotechnol. 2021;325:372–379. doi: 10.1016/j.jbiotec.2020.09.024. [DOI] [PubMed] [Google Scholar]
- Cheng F, Li H, Zhang K, Li QH, Xie D, Xue YP, Zheng YG. Tuning amino acid dehydrogenases with featured sequences for L-phosphinothricin synthesis by reductive amination. J Biotechnol. 2020;312:35–43. doi: 10.1016/j.jbiotec.2020.03.001. [DOI] [PubMed] [Google Scholar]
- Chung ME, Yeh IH, Sung LY, Wu MY, Chao YP, Ng IS, Hu YC. Enhanced integration of large DNA Iinto E. coli chromosome by CRISPR/Cas9. Biotechnol Bioeng. 2017;114(1):172–183. doi: 10.1002/bit.26056. [DOI] [PubMed] [Google Scholar]
- Englaender JA, Jones JA, Cress BF, Kuhlman TE, Linhardt RJ, Koffas MAG. Effect of genomic integration location on heterologous protein expression and metabolic engineering in E. coli. ACS Synth Biol. 2017;6(4):710–720. doi: 10.1021/acssynbio.6b00350. [DOI] [PubMed] [Google Scholar]
- Hernandez K, Berenguer-Murcia A, Rodrigues RC, Fernandez-Lafuente R. Hydrogen peroxide in biocatalysis. A dangerous liaison. Curr Org Chem. 2012;16(22):2652–2672. doi: 10.2174/138527212804004526. [DOI] [Google Scholar]
- Horsman GP, Zechel DL. Phosphonate biochemistry. Chem Rev. 2017;117(8):5704–5783. doi: 10.1021/acs.chemrev.6b00536. [DOI] [PubMed] [Google Scholar]
- Jia XB, Chen JC, Lin CQ, Lin XJ. Cloning, expression, and characterization of a novel thermophilic monofunctional catalase from Geobacillus sp CHB1. Biomed Res Int. 2016;2016:8. doi: 10.1155/2016/7535604. [DOI] [PMC free article] [PubMed] [Google Scholar]
- Jia DX, Liu ZJ, Xu HP, Li JL, Li JJ, Jin LQ, Cheng F, Liu ZQ, Xue YP, Zheng YG. Asymmetric synthesis of L-phosphinothricin using thermostable alpha-transaminase mined from Citrobacter koseri. J Biotechnol. 2019;302:10–17. doi: 10.1016/j.jbiotec.2019.06.008. [DOI] [PubMed] [Google Scholar]
- Jia DX, Xu HP, Sun CY, Peng C, Li JL, Jin LQ, Cheng F, Liu ZQ, Xue YP, Zheng YG. Covalent immobilization of recombinant Citrobacter koseri transaminase onto epoxy resins for consecutive asymmetric synthesis of L-phosphinothricin. Bioprocess Biosyst Eng. 2020;43(9):1599–1607. doi: 10.1007/s00449-020-02351-3. [DOI] [PubMed] [Google Scholar]
- Jiang Y, Chen B, Duan CL, Sun BB, Yang JJ, Yang S. Multigene editing in the Escherichia coli genome via the CRISPR-Cas9 system. Appl Environ Microbiol. 2015;81(7):2506–2514. doi: 10.1128/aem.04023-14. [DOI] [PMC free article] [PubMed] [Google Scholar]
- Jin LQ, Peng F, Liu HL, Cheng F, Jia DX, Xu JM, Liu ZQ, Xue YP, Zheng YG. Asymmetric biosynthesis of L-phosphinothricin by a novel transaminase from Pseudomonas fluorescens ZJB09-108. Process Biochem. 2019;85:60–67. doi: 10.1016/j.procbio.2019.07.010. [DOI] [Google Scholar]
- Kang XM, Cai X, Liu ZQ, Zheng YG. Identification and characterization of an amidase from Leclercia adecarboxylata for efficient biosynthesis of L-phosphinothricin. Bioresour Technol. 2019;289:8. doi: 10.1016/j.biortech.2019.121658. [DOI] [PubMed] [Google Scholar]
- Kwon YD, Kim S, Lee SY, Kim P. Long-term continuous adaptation of Escherichia coli to high succinate stress and transcriptome analysis of the tolerant strain. J Biosci Bioeng. 2011;111(1):26–30. doi: 10.1016/j.jbiosc.2010.08.007. [DOI] [PubMed] [Google Scholar]
- Leuchs S, Greiner L. Alcohol dehydrogenase from Lactobacillus brevis: a versatile robust catalyst for Enantioselective Transformations. Chem Biochem Eng Q. 2011;25(2):267–281. doi: 10.3103/S036152191103013X. [DOI] [Google Scholar]
- Liu ZQ, Ye JJ, Shen ZY, Hong HB, Yan JB, Lin Y, Chen ZX, Zheng YG, Shen YC. Upscale production of ethyl (S)-4-chloro-3-hydroxybutanoate by using carbonyl reductase coupled with glucose dehydrogenase in aqueous-organic solvent system. Appl Microbiol Biotechnol. 2015;99(5):2119–2129. doi: 10.1007/s00253-014-6245-y. [DOI] [PubMed] [Google Scholar]
- Marangoni AG. Enzyme kinetics: a modern approach. New York: Wiley; 2003. [Google Scholar]
- Nakashima N, Akita H, Hoshino T. Establishment of a novel gene expression method, BICES (biomass-inducible chromosome-based expression system), and its application to the production of 2,3-butanediol and acetoin. Metab Eng. 2014;25:204–214. doi: 10.1016/j.ymben.2014.07.011. [DOI] [PubMed] [Google Scholar]
- Sabri S, Steen JA, Bongers M, Nielsen LK, Vickers CE. Knock-in/Knock-out (KIKO) vectors for rapid integration of large DNA sequences, including whole metabolic pathways, onto the Escherichia coli chromosome at well-characterised loci. Microb Cell Fact. 2013 doi: 10.1186/1475-2859-12-60. [DOI] [PMC free article] [PubMed] [Google Scholar]
- Tas H, Nguyen CT, Patel R, Kim NH, Kuhlman TE. An integrated system for precise genome modification in Escherichia coli. PLOS ONE. 2015;10(9):19. doi: 10.1371/journal.pone.0136963. [DOI] [PMC free article] [PubMed] [Google Scholar]
- Taylor KB. Enzyme kinetics and mechanisms. Berlin: Academic Press; 2002. [Google Scholar]
- Trost EM, Fischer L. Minimization of by-product formation during D-amino acid oxidase catalyzed racemate resolution Of D/L-amino acids. J Mol Catal B-Enzym. 2002;19:189–195. doi: 10.1016/s1381-1177(02)00166-2. [DOI] [Google Scholar]
- Wang JL, Niyompanich S, Tai YS, Wang JY, Bai WQ, Mahida P, Gao T, Zhang KC. Engineering of a highly efficient escherichia coli strain for mevalonate fermentation through chromosomal integration. Appl Environ Microbiol. 2016;82(24):7176–7184. doi: 10.1128/aem.02178-16. [DOI] [PMC free article] [PubMed] [Google Scholar]
- Xu JM, Zhang K, Cao HT, Li H, Cheng F, Cao CH, Xue YP, Zheng YG. Development of a biocatalytic cascade for synthesis of 2-oxo-4-(hydroxymethylphosphinyl) butyric acid in one pot. Biocatal Biotransform. 2021;39(3):190–197. doi: 10.1080/10242422.2020.1797697. [DOI] [Google Scholar]
- Xue YP, Cao CH, Zheng YG. Enzymatic asymmetric synthesis of chiral amino acids. Chem Soc Rev. 2018;47(4):1516–1561. doi: 10.1039/c7cs00253j. [DOI] [PubMed] [Google Scholar]
- Yin XJ, Wu JP, Yang LR. Efficient reductive amination process for enantioselective synthesis of L-phosphinothricin applying engineered glutamate dehydrogenase. Appl Microbiol Biotechnol. 2018;102(10):4425–4433. doi: 10.1007/s00253-018-8910-z. [DOI] [PubMed] [Google Scholar]
- Yu HL, Li T, Chen FF, Luo XJ, Li AT, Yang C, Zheng GW, Xu JH. Bioamination of alkane with ammonium by an artificially designed multienzyme cascade. Metab Eng. 2018;47:184–189. doi: 10.1016/j.ymben.2018.02.009. [DOI] [PubMed] [Google Scholar]
- Zhang RZ, Zhang BT, Xu Y, Li YH, Li M, Liang HB, Xiao R. Efficicent (R)-phenylethanol production with enantioselectivity-alerted (S)-carbonyl reductase II and NADPH regeneration. PLOS ONE. 2013;8(12):10. doi: 10.1371/journal.pone.0083586. [DOI] [PMC free article] [PubMed] [Google Scholar]
- Zhang YF, Wang Q, Hess H. Increasing enzyme cascade throughput by pH-engineering the microenvironment of individual enzymes. ACS Catal. 2017;7(3):2047–2051. doi: 10.1021/acscatal.6b03431. [DOI] [Google Scholar]
- Zhao DD, Yuan SL, Xiong B, Sun HN, Ye LJ, Li J, Zhang XL, Bi CH. Development of a fast and easy method for Escherichia coli genome editing with CRISPR/Cas9. Microb Cell Fact. 2016 doi: 10.1186/s12934-016-0605-5. [DOI] [PMC free article] [PubMed] [Google Scholar]