Abstract
Background
Brucella spondylitis (BS) and tuberculous spondylitis (TS), caused initially by bacteremia, are the two leading types of granulomatous spinal infections. BS is easy to miss or may be misdiagnosed as TS. Our purpose aims to differentiate BS from TS in conventional MR imaging and MR T2 mapping.
Methods
We performed on 26 BS and 27 TS patients conventional MR imaging and MR T2 mapping. We analyzed the features in conventional MR imaging and measured T2 values of the lesion vertebrae (LV) and unaffected adjacent vertebrae (UAV) in BS and TS patients, respectively.
Results
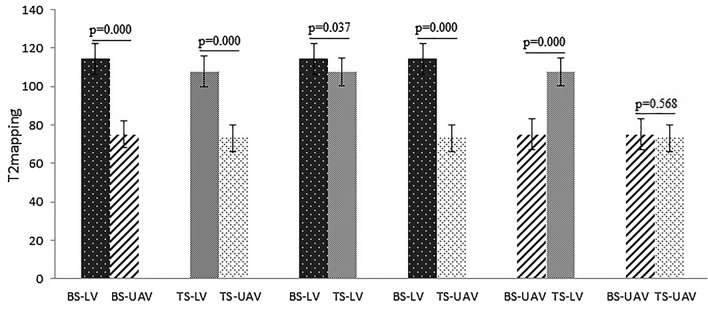
There were no significant differences in sex, age, national between BS and TS. There was significantly lower severity of vertebral destruction, vertebral posterior convex deformity, dead bone, and abscess scope in BS when compared to TS (p < 0.001, p = 0.048, p < 0.001, p < 0.001, respectively). The vertebral hyperplasia was significantly higher in BS when compared to TS (p < 0.001). The T2 value of the LV with BS was markedly higher than that in the UAV with BS and that in the LV and UAV with TS (p < 0.001, p < 0.037, p < 0.001, respectively). The T2 value of the LV with TS was significantly higher than that of the UAV in TS and BS (p < 0.001, p < 0.001, respectively). There were no significant differences in the T2 value of the UAV between BS and TS (p = 0.568).
Conclusions
The qualitative and quantitative evaluation may differentiate BS from TS. The conventional MR imaging helps to distinguish BS from TS by several distinctive features. MR T2 mapping has the additional potential to provide quantitative information between BS and TS.
Keywords: Brucellosis, Tuberculous, Spondylitis, T2 mapping, Quantitative
Key points
Conventional MR imaging has several distinctive features to distinguish BS from TS.
MR T2 mapping has the additional potential to provide quantitative information between BS and TS.
MR T2 mapping might be a valuable tool for a non-invasive and quantitative technique.
Background
Brucella spondylitis (BS) and tuberculous spondylitis (TS), caused initially by bacteremia, are the two leading types of granulomatous spinal infections [1]. They have some common clinical manifestations, including back pain, fever, and increased inflammatory markers. It is challenging to precisely distinguish clinically between the two groups [2]. BS is easy to misdiagnose as TS. Conventional MRI can detect changes in the signals and morphology in the vertebrae, which are usually qualitative. However, MR T2 mapping can help visualize and quantitatively access the water content of vertebral bodies [3]. T2 mapping has been used to evaluate lumbar intervertebral disc degeneration [4–8] and only studied vertebra injury in spinal tuberculosis [9]. The study aimed to explore whether qualitatively–quantitatively differentiate BS from TS on conventional MRI and MR T2 mapping.
Materials and methods
Study population
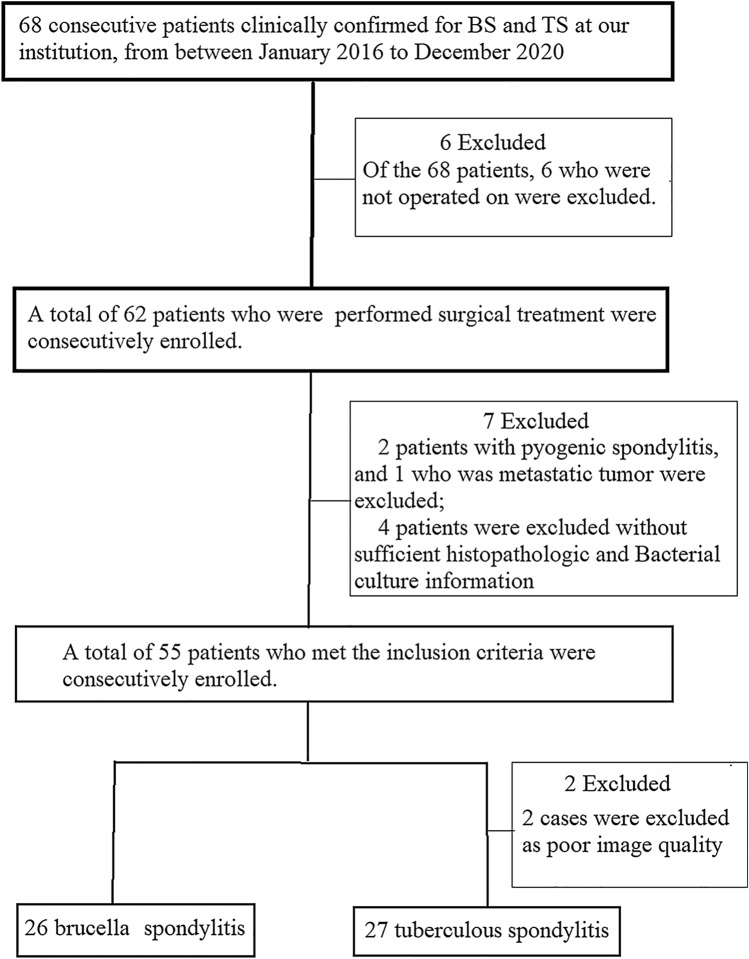
This is a prospective clinical study. Patients who were clinically confirmed for BS and TS between January 2018 and December 2020 were initially considered eligible for our research (n = 68). All participants provided written informed consent. Ethical approval for the study was obtained from the ethical review committee for our hospital. Inclusion criteria were as follows [10–12]: (a) diagnosis of TS was confirmed by biopsy on basing caseation granulomatosis on histopathological examination or the presence of acid-fast bacilli or the tuberculosis bacilli growth in cultures; (b) diagnosis of BS was based on the Brucella agglutination titer test (≥ 1:160) and isolation of Brucella species from blood, bone marrow, or tissues; (c) all patients were operated with sufficient histopathologic and bacterial culture information. A total of 55 patients who met the inclusion criteria were consecutively enrolled. 2 patients were excluded as poor image quality. Finally, we included 53 patients who were performed in our study, among whom BS patients (n = 26) and TS patients (n = 27) (Fig. 1).
Fig. 1.
Flowchart of the study population with brucella spondylitis and tuberculous spondylitis
MRI protocol
Conventional magnetic resonance imaging (MRI) and MR T2 mapping sequences were carried on in all patients and whole spine MRI studies were performed. MRI scans were performed using a 1.5-T MR scanner (Siemens Healthcare, Erlangen, Germany). The parameters for conventional MRI and MR T2 mapping sequences are shown in Table 1.
Table 1.
Conventional MRI and MR T2 mapping parameters of all patients
| Sequence | TR (ms) | TE (ms) | Layer chick (mm) | Layer distance (mm) | Layer number | FOV (mm) | Matrix |
|---|---|---|---|---|---|---|---|
| T1WI | 600 | 9.5 | 4.0 | 1 | 13 | 320 | 256 × 256 |
| T2WI | 3000 | 88 | 4.0 | 1 | 13 | 320 | 256 × 256 |
| FST2WI | 3600 | 83 | 4.0 | 1 | 13 | 320 | 256 × 256 |
| T2 mapping | 2400 | 26 | 3.0 | 1 | 17 | 260 | 256 × 256 |
Image analysis
MRI finding included the level of involvement, number of the affected vertebra, MRI signal (hypointense signal on T1WI, hyperintense signal on T2WI, and hyperintense signal on STIR), vertebral change (destruction, wedge, hyperplasia, bead bone, posterior convex deformity), intervertebral space, and abscess (paravertebral abscess, epidural abscess, psoas abscess, abscess scope), vertebral appendage lesion. Vertebral destruction was defined as a vertebral structure loss of worm-etched or patchy. Vertebral wedge was defined as the front edge of the vertebra is narrower than the back edge, and the vertebra was flattened. The spinal posterior convex deformity was defined as severe vertebral damage, with significant vertebral wedge changes, resulting in considerable kyphosis of the spine. Vertebral appendage lesion was defined as bone edema or bone destruction of the appendage. Bead bone was defined as necrotic bone. Vertebral hyperplasia was defined as the appearance of a spur or osteophyte. MR images were analyzed by an attending physician and an associate chief physician, and the consistency of image evaluation was evaluated, being blinded to histopathological results.
Using the Function Tool 2 software on the post-processing workstation, we selected a region of interest (ROI) with an area of 60 mm2 on the T2 mapping image and generated T2 values automatically. The ROI was placed in the middle three layers, where the lesion showed the best. Then, we obtained the T2 average value three times, which was measured repeatedly for the lesion vertebra (LV) and the unaffected adjacent vertebra (UAV) with BS and TS patients.
Statistical analysis
The information of sex, national, and MRI finding was expressed as the percentages and frequencies. In addition, we collected the information of age and measured T2 values of LV and UAV in the BS and TS patients. And these data concerning age and T2 values of LV and UAV were expressed as mean values and standard deviations. The Chi-square analyzed the differences between the two groups, and the Student’s t test analyzed all mean value of the differences between the two groups. A p value of less than 0.05 indicated a significant difference. The Kappa coefficient was calculated by two physicians using a consistency test.
Results
The demographic characteristics in the two groups are shown in Table 2. There were no significant differences in sex, age, national between the BS and the TS.
Table 2.
The demographic characteristics in BS and TS patients
| No. of patients | BS | TS | p value |
|---|---|---|---|
| Sex | 0.132 | ||
| Male | 15 (57.69%) | 10 (37.04%) | |
| Female | 11 (42.31%) | 17 (62.96%) | |
| Age | |||
| Mean ± SD | 50.95 ± 13.41 | 47.33 ± 15.43 | 0.682 |
| Range of age | 31–72 | 18–69 | |
| National | 0.451 | ||
| Uygur | 13 (66.67%) | 18 (66.67%) | |
| Han | 8 (22.22%) | 5 (18.52%) | |
| Other | 5 (11.11%) | 4 (14.81%) | |
BS brucellosis spondylitis; TS tuberculous spondylitis
The image quality of the two physicians was consistent, and the Kappa coefficient was 0.875. MRI findings in the two groups are shown in Table 3. There were significant differences in the site of involvement, vertebral destruction, vertebral posterior convex deformity, dead bone, vertebral hyperplasia, intervertebral space change, and abscess findings between BS and TS (p < 0.05). It was significantly lower in the severe vertebral destruction, vertebral posterior convex deformity, dead bone, and abscess beyond the vertebra lesion with BS when compared to TS (p < 0.001, p = 0.005, p = 0.048, p < 0.001, p < 0.001, respectively). The vertebral hyperplasia was significantly higher in BS when compared to TS (p < 0.001). The lumbar vertebras (69.23%) were the most common in BS. The thoracolumbar vertebras (33.33%) and lumbar vertebras (33.33%) were the most common in TS. It was significantly higher in the normal intervertebral space with BS (42.31%) when compared to TS (7.41%) (p < 0.05), and the narrow intervertebral space was distinctly lower with BS (57.69%) when compared to TS (81.48%) (p < 0.05). The paravertebral abscess was higher with BS (65.38%) when compared to TS (22.22%) (p < 0.05), and it was markedly lower in the psoas abscess with BS (0.00%) when compared to TS (66.67%) (p < 0.05). There were no significant differences in the number of the affected vertebra, MRI signal, vertebral wedge, vertebral appendage lesion between BS and TS (p > 0.05).
Table 3.
Comparison of MRI findings between brucella spondylitis and tuberculous spondylitis
| MRI findings | BS [n (%)] | TS [n (%)] | χ2 value | p value |
|---|---|---|---|---|
| Site of involvement | 11.106 | 0.025 | ||
| Cervical spine | 0 | 1 (3.70%) | ||
| Thoracic spine | 2 (14.18%) | 6 (22.22%) | ||
| Thoracolumbar spine | 2 (14.18%) | 9 (33.33%) | ||
| Lumbar spine | 18 (69.23%) | 9 (33.33%) | ||
| Lumbosacral spine | 4 (15.38%) | 2 (7.40%) | ||
| Number of affected vertebra | 0.670 | 0.715 | ||
| 1 | 1 (3.85%) | 1 (3.70%) | ||
| 2 | 23 (88.46%) | 22 (81.48%) | ||
| ≥ 3 | 2 (7.69%) | 4 (14.81%) | ||
| MRI signal | ||||
| Hypointense signal on T1WI | 23 (88.46%) | 26 (96.29%) | 1.165 | 0.280 |
| Hyperintense signal on T2WI | 14 (53.85%) | 10 (37.04%) | 1.510 | 0.219 |
| Hyperintense signal on STIR | 18 (69.23%) | 21 (77.78%) | 0.498 | 0.480 |
| Vertebral change | ||||
| Vertebral destruction | 20.974 | < 0.001 | ||
| Mild (≤ 1/3) | 23 (88.46%) | 8 (29.63%) | ||
| Severe (> 1/3) | 2 (7.41%) | 19 (70.37%) | ||
| Vertebral wedge | 0.229 | 0.632 | ||
| ≤ 1/2 | 7 (26.92%) | 20 (74.07%) | ||
| > 1/2 | 1 (3.85%) | 5 (18.52%) | ||
| Posterior convex deformity | 1 (3.85%) | 6 (22.22%) | 3.902 | 0.048 |
| Vertebral appendage lesion | 3 (11.54%) | 5 (18.52%) | 0.504 | 0.478 |
| Dead bone | 0 (0.00%) | 13 (48.15%) | 16.587 | < 0.001 |
| Vertebral hyperplasia | 25 (96.15%) | 8 (29.63%) | 24.948 | < 0.001 |
| Intervertebral space | 10.540 | 0.005 | ||
| Normal | 11 (42.31%) | 2 (7.41%) | ||
| Narrow | 15 (57.69%) | 22 (81.48%) | ||
| Disappear | 0 (0.00%) | 3 (11.11%) | ||
| Abscess | 22.945 | < 0.001 | ||
| Paravertebral abscess | 17 (65.38%) | 6 (22.22%) | ||
| Epidural abscess | 9 (34.62%) | 8 (29.62%) | ||
| Psoas abscess | 0 (0.00%) | 18 (66.67%) | ||
| Abscess scope | 27.451 | < 0.001 | ||
| Beyond the vertebra lesion | 1 (5.88%) | 17 (94.44%) | ||
| In the vertebra lesion | 16 (94.12%) | 1 (5.56%) | ||
BS brucella spondylitis; TS tuberculous spondylitis; STIR short-tau inversion recovery
The T2 values of the LV and UAV with BS and TS are shown in Fig. 2. The T2 value of the LV with BS was markedly higher than those in the LV with BS and those in the LV and UAV with TS (p < 0.001, p < 0.037, p < 0.001, respectively). The T2 value of the LV with TS was significantly higher than those of the UAV with TS and BS (p < 0.001, p < 0.001, respectively). There were no significant differences in T2 values of the UAV between BS and TS (p = 0.568). Figure 3 presents the measurement of a lumbar vertebral lesion.
Fig. 2.
This shows group t test results of T2 values for the lesion vertebra and the unaffected adjacent vertebra between brucella spondylitis and tuberculous spondylitis
Fig. 3.
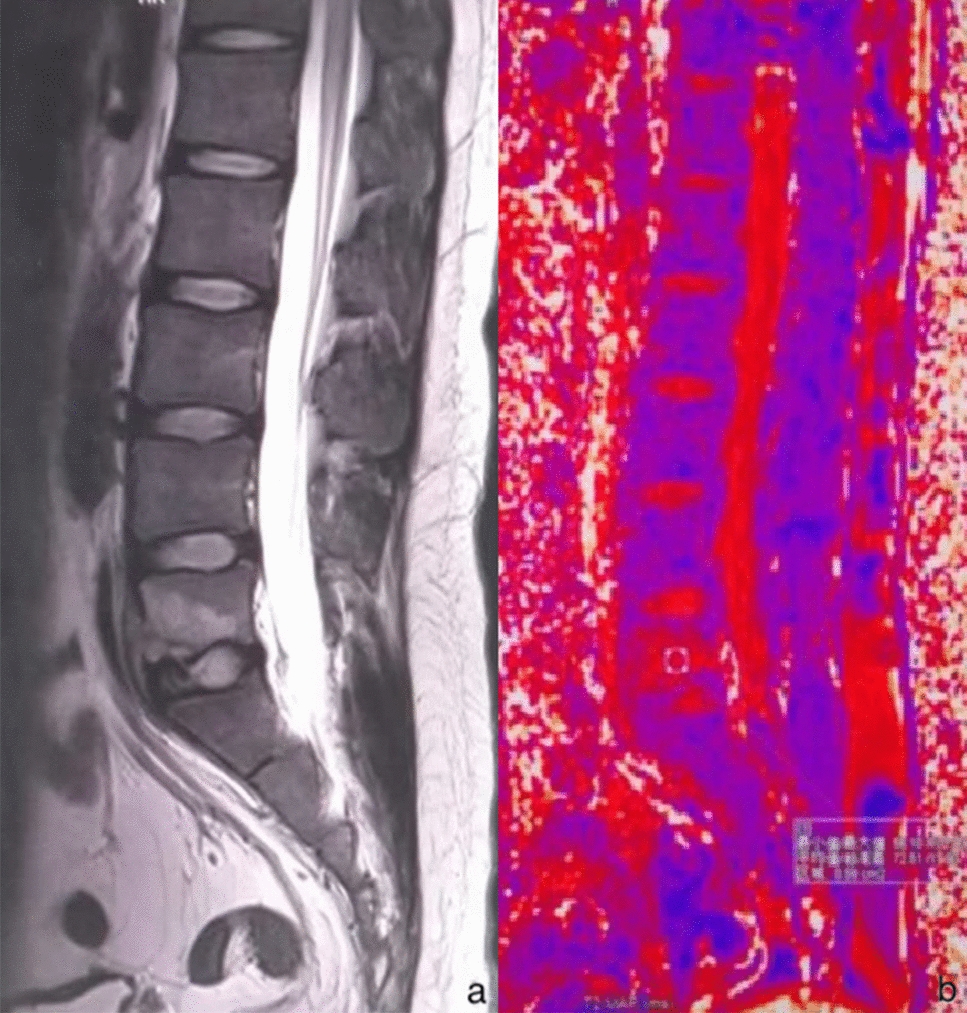
Sagittal MR T2WI (a) showed a high signal of the fifth lumbar vertebra, and sagittal MR T2 mapping (b) showed the measurement of the fifth lumbar vertebral lesion
Discussion
This study demonstrated that the qualitative and the quantitative evaluation might differentiate BS from TS. Several distinctive features (site of involvement, vertebral destruction, posterior convex deformity, bead bone, vertebral hyperplasia, intervertebral space change, and location of abscess) were identified. They can distinguish BS from TS in conventional MR imaging. The T2 value of the LV with BS was markedly higher than that in the LV with TS by using the T2 mapping technique.
BS and TS are still considered public health problems worldwide, particularly in developing countries [11, 12]. In this study, there were no significant differences in sex, age, national between BS and TS. The difference in age was inconsistent with this reported in Liu’s study [13]. The reason may be related to the sample size.
The early diagnosis and effective cure become critically important to minimize spinal deformity and permanent neurologic deficiencies. Due to the similarities in the clinical signs and laboratory data, a proportion of patients may be misdiagnosed [14], it is challenging to distinguish BS from TS. In the current study, 69.23% of patients with BS were located in the lumbar, consistent with previous studies [15–17]. However, the majority of TS cases (55.55%) were located in the lower thoracic region, and it was consistent with those in Turunc et al. [2] and Jung et al. [18]. Through the analysis of vertebra and intervertebral space, it was significantly lower in the severe vertebral destruction, vertebral posterior convex deformity, dead bone, and narrow—disappear change of intervertebral space in the patients with BS (7.41%, 3.85%, 0.00%, 57.69%, respectively) than those in TS (70.37%, 22.22%, 48.15%, 92.59%, respectively). This widespread destruction in TS may result from the rapid involvement of the endplate (inflammatory reaction). With the progress of TS, the vertebras were destroyed increasingly severely. The wedge changes of the involved adjacent vertebras resulted in the vertebral posterior convex deformity, along with a narrow or disappeared change in the intervertebral space (Fig. 4a–c). Our study found that the vertebral destruction was significantly severer in TS when compared to BS. The findings were consistent with those in Yang et al. [19] and Liu et al. [13]. A pathologic study pointed out that there was proteinase activity to destroy the disc and vertebra in TS. The vertebral erosion in TS was caseating granulomas and dead bone without new bone formation [20]. As a result, the vertebra in TS presented a severe collapse on MR images, however, it is rare in BS. Similar findings had also been reported by Tali et al. [21]. BS is more common in the mild and focal vertebral destruction, which is agreement with previous studies [10, 22]. The lack of proteolytic enzymes might limit the invasion of brucella in BS. Further researches demonstrated that osteoblastic activity is induced in BS, partly explaining the less prominent bone and disc destruction than in TS. It was significantly higher of vertebral hyperplasia with BS (96.15%) than TS (29.63%). There was distinctly more vertebral hyperplasia (Fig. 5a, b) in our result when compared to previous studies [11, 17]. The bone erosion of the endplate in BS was accompanied by new bone formation at the early stage [23]. As a result, the corresponding signs in anterior osteophyte and sclerosis were observed on MR images [21].
Fig. 4.
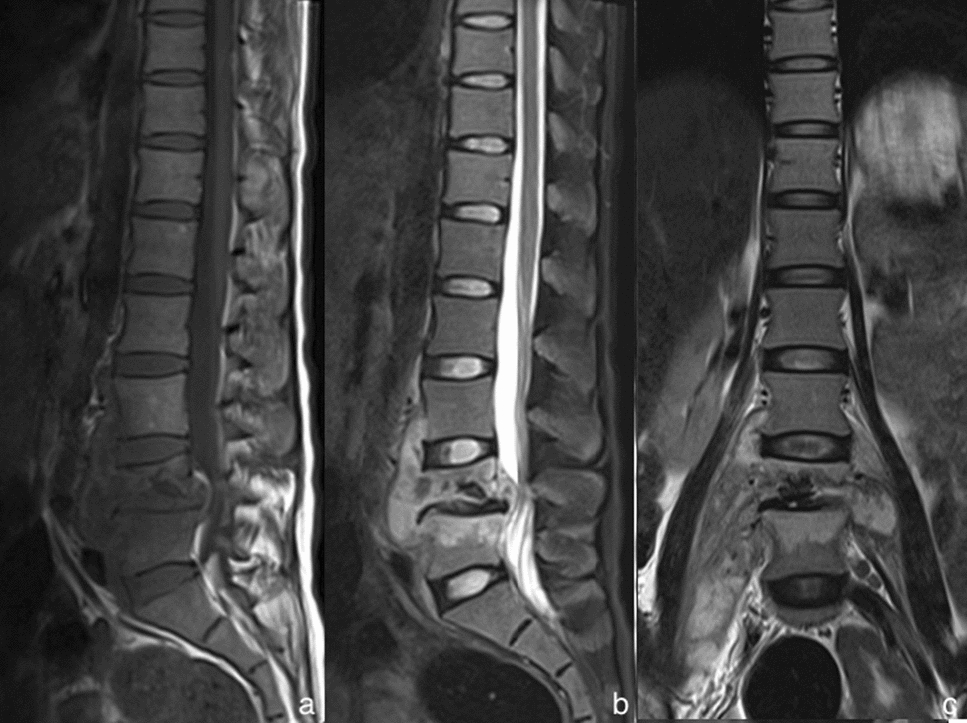
The MRI of a 23-year-old woman complaining of continuous lumbago with tuberculous spondylitis. The sagittal MRI T1WI (a), the sagittal MRI with fat saturation (b) and the coronal MRI T2WI (c) presented a combination of MRI findings: the lesions, in lumbar vertebral bodies 4 and 5, showed hypointense signal in T1WI and hyperintense signal in T2WI. They revealed typical vertebral bodies destruction and collapse, along with the vertebral posterior convex deformity and a narrowed intervertebral space. There also existed extensive psoas abscess and paraspinal abscess around
Fig. 5.
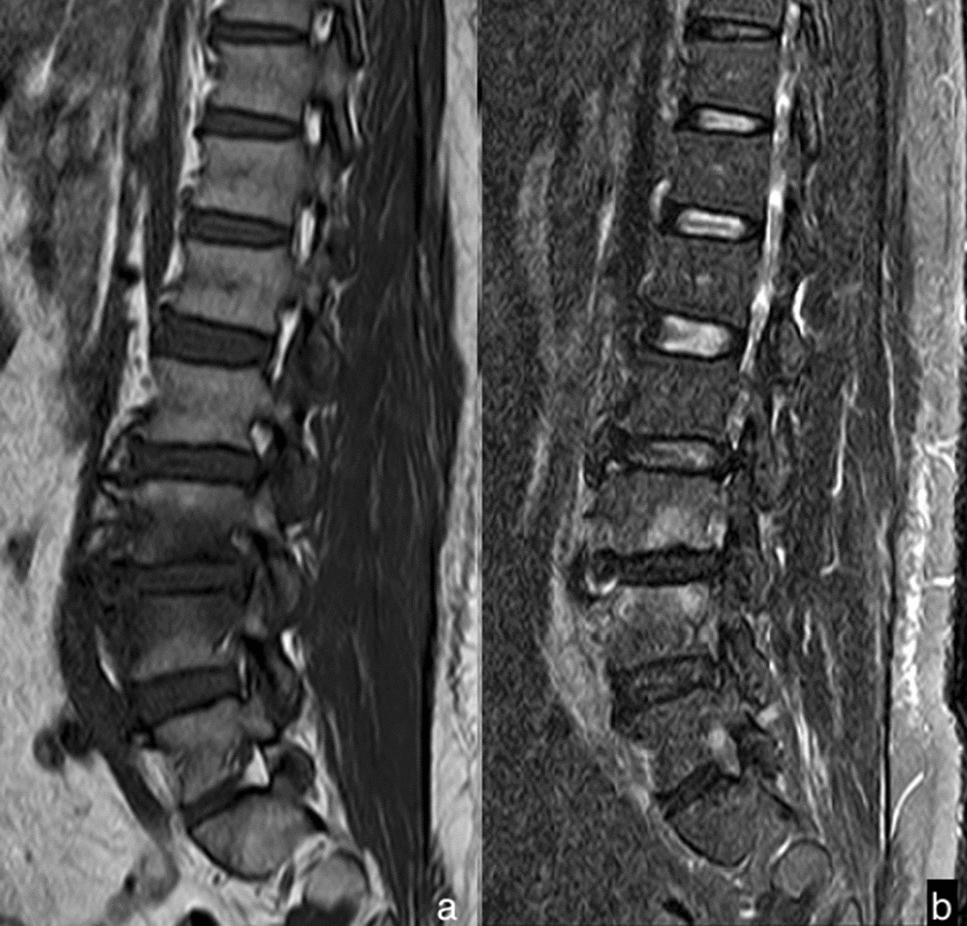
The MRI of a 47-year-old man suffering from weakness with brucella spondylitis. The lesions showed hypointense signal in T1WI (a) and slightly hyperintense signal in sagittal MRI with fat saturation (b) in lumbar vertebral bodies 4 and 5. Distinct vertebral hyperplasia and small abscesses could be found
The abscess, around the vertebra, is a common feature in BS and TS. Our study found that the paravertebral abscess was significantly higher with BS (65.38%) when compared to TS (22.22%), but the psoas abscess was markedly lower with BS (0.00%) when compared to TS (66.67%). There is a significant difference between BS and TS in terms of abscess spread. The abscess beyond the range of vertebral lesions was significantly higher in TS (94.44%) when compared to BS (5.88%). Small abscesses were frequently found by Tali et al. [21]. because the abscess in BS is relatively limited, it is generally difficult to spread. About 34.62% in BS showed epidural abscesses, which followed a previous study [24].
Previous studies [2, 12, 25, 26] showed the diagnosis and differential diagnosis in spondylitis patients on MRI was qualitative rather than quantitative. MR T2 mapping can be used to detect the early changes in physiology and morphology by water content changes in the tissues and indirectly reflect the small changes of water molecules of the tissues in the spatial information of human tissue structure and pathological and physiological conditions [27]. Spondylitis is often caused by brucella or tubercular bacteria, resulting in inflammatory vertebral edema as well as abscesses, and the paravertebral abscess can result in the increased random Brownian motion of water protons, which is reflected by increased T2 values. To the best of our knowledge, MR T2 mapping has been used to evaluate vertebal injury in spinal tuberculosis [9]. However, there was no similar research on the application of T2 mapping between BS and TS. In our work, the results showed that T2 value of the LV with BS was markedly higher than that in the LV with TS (p < 0.05) and that in the UAV with BS (p < 0.05). The T2 value of the LV was high in BS and TS. The reason may be the bacteria entering the vertebra through the blood to undergo a complex pathological inflammatory process (seep, hyperplasia, and necrosis). With the inflammatory pathological lesions developing, the extracellular water content increases, and the injured locations present congestion and edema of different degrees. As the vertebas have abnormal pathological changes, MR T2 value was increased by T2 relaxation time extended. In our work, the T2 value of the LV in BS was higher than that in TS. So, we had a preliminary result that T2 mapping may quantitatively differentiate BS from TS.
Limitations
Due to the small sample size included in this study, MR T2 mapping sequence scanning needs to be further studied by expanding the sample size in the diagnosis and differential diagnosis with BS and TS. Another limitation was that we did not determine the stage of disease between BS and TS in this series. Therefore, the T2 value may be potentially inaccurate.
Conclusion
The qualitative and quantitative evaluation may differentiate BS from TS. The conventional MR imaging helps to distinguish BS from TS by several distinctive features. MR T2 mapping has the additional potential to provide quantitative information between BS and TS.
Acknowledgements
The authors thank Peipei Yang, Yuanyuan Wang, and Haiyan Huang for scanning data.
Abbreviations
- BS
Brucella spondylitis
- TS
Tuberculous spondylitis
- MRI
Magnetic resonance imaging
- LV
Lesion vertebrae
- UAV
Unaffected adjacent vertebra
- STIR
Short-tau inversion recovery
- ROI
Region of interest
Authors’ contributions
HG and WL conceived the idea. HG and WL wrote the main manuscript text, and HG prepared Fig. 1, Fig. 2, Fig. 4. YH and MT collected the data. SL and YH and MT performed the literature search. All authors reviewed the manuscript. All authors read and approved the final manuscript.
Funding
The authors gratefully acknowledge the financial support provided by Postgraduate Innovation and Entrepreneurship Project of Xinjiang Medical University (Grant no. CXCY2021017).
Declarations
Ethics approval and consent to participate
All participants provided written informed consent. Ethical approval for the study was obtained from the ethical review committee for our hospital (Grant No. 20170214-111).
Consent for publication
All authors agree to publish.
Competing interests
The authors declare that there are no competing interests regarding the publication of this paper.
Footnotes
Publisher's Note
Springer Nature remains neutral with regard to jurisdictional claims in published maps and institutional affiliations.
References
- 1.Cordero M, Sanchez I. Brucellar and tuberculous spondylitis. A comparative study of their clinical features. J Bone Joint Surg Br. 1991;73:100–103. doi: 10.1302/0301-620X.73B1.1991738. [DOI] [PubMed] [Google Scholar]
- 2.Turunc T, Demiroglu YZ, Uncu H, et al. A comparative analysis of tuberculous, brucellar and pyogenic spontaneous spondylodiscitis patients. J Infect. 2007;55:158–163. doi: 10.1016/j.jinf.2007.04.002. [DOI] [PubMed] [Google Scholar]
- 3.Lagerstrand K, Hebelka H, Brisby H. Low back pain patients and controls display functional differences in endplates and vertebrae measured with T2-mapping. Eur Spine J. 2019;28:234–240. doi: 10.1007/s00586-018-5824-5. [DOI] [PubMed] [Google Scholar]
- 4.Raudner M, Schreiner MM, Hilbert T, et al. Clinical implementation of accelerated T2 mapping: quantitative magnetic resonance imaging as a biomarker for annular tear and lumbar disc herniation. Eur Radiol. 2021;31:3590–3599. doi: 10.1007/s00330-020-07538-6. [DOI] [PMC free article] [PubMed] [Google Scholar]
- 5.Zhang C, Lin Y, Han Z, et al. Feasibility of T2 mapping and magnetic transfer ratio for diagnosis of intervertebral disc degeneration at the cervicothoracic junction: a pilot study. Biomed Res Int. 2019;2019:6396073. doi: 10.1155/2019/6396073. [DOI] [PMC free article] [PubMed] [Google Scholar]
- 6.Ishikawa T, Watanabe A, Kamoda H, et al. Evaluation of lumbar intervertebral disc degeneration using T1ρ and T2 magnetic resonance imaging in a rabbit disc injury model. Asian Spine J. 2018;12:317–324. doi: 10.4184/asj.2018.12.2.317. [DOI] [PMC free article] [PubMed] [Google Scholar]
- 7.Hebelka H, Miron A, Kasperska I, et al. Axial loading during MRI induces significant T2 value changes in vertebral endplates-a feasibility study on patients with low back pain. J Orthop Surg Res. 2018;13:18. doi: 10.1186/s13018-018-0727-z. [DOI] [PMC free article] [PubMed] [Google Scholar]
- 8.Toren L, Hebelka H, Kasperska I, et al. With axial loading during MRI diurnal T2-value changes in lumbar discs are neglectable: a cross sectional study. BMC Musculoskelet Disord. 2018;19:25. doi: 10.1186/s12891-018-1930-0. [DOI] [PMC free article] [PubMed] [Google Scholar]
- 9.Yang PP, Guo H, Yao J, et al. The appliction of T2 relaxtion time mapping in spinal tuberculosis. Chin J Osteoporos. 2016;22:72–76. [Google Scholar]
- 10.Oztekin O, Calli C, Adibelli Z, et al. Brucellar spondylodiscitis: magnetic resonance imaging features with conventional sequences and diffusion-weighted imaging. Radiol Med. 2010;115:794–803. doi: 10.1007/s11547-010-0530-3. [DOI] [PubMed] [Google Scholar]
- 11.Ozaksoy D, Yücesoy K, Yücesoy M, et al. Brucellar spondylitis: MRI findings. Eur Spine J. 2001;10:529–533. doi: 10.1007/s005860100285. [DOI] [PMC free article] [PubMed] [Google Scholar]
- 12.Gao M, Sun JM, Jiang ZS, et al. Comparison of tuberculous and brucellar spondylitis on MRI images. Spine. 2016;42:113–121. doi: 10.1097/BRS.0000000000001697. [DOI] [PubMed] [Google Scholar]
- 13.Liu XX, Li H, Jin C, et al. Differentiation between brucellar and tuberculous spondylodiscitis in the acute and subacute stages by MRI: a retrospective observational study. Acad Radiol. 2018;25:1183–1189. doi: 10.1016/j.acra.2018.01.028. [DOI] [PubMed] [Google Scholar]
- 14.Dasari S, Naha K, Prabhu M. Brucellosis and tuberculosis: clinical overlap and pitfalls. Asian Pac J Trop Med. 2013;6:823–825. doi: 10.1016/S1995-7645(13)60145-5. [DOI] [PubMed] [Google Scholar]
- 15.Mete B, Kurt C, Yilmaz MH, et al. Vertebral osteomyelitis: eight years’ experience of 100 cases. Rheumatol Int. 2012;32:3591–3597. doi: 10.1007/s00296-011-2233-z. [DOI] [PubMed] [Google Scholar]
- 16.Colmenero JD, Ruiz-Mesa JD, Plata A, et al. Clinical findings, therapeutic approach, and outcome of brucellar vertebral osteomyelitis. Clin Infect Dis. 2008;46:426–433. doi: 10.1086/525266. [DOI] [PubMed] [Google Scholar]
- 17.Li T, Liu T, Jiang ZS, et al. Diagnosing pyogenic, brucella and tuberculous spondylitis using histopathology and MRI: a retrospective study. Exp Ther Med. 2016;12:2069–2077. doi: 10.3892/etm.2016.3602. [DOI] [PMC free article] [PubMed] [Google Scholar]
- 18.Jung NY, Jee WH, Ha KY, et al. Discrimination of tuberculous spondylitis from pyogenic spondylitis on MRI. Am J Roentgenol. 2004;182:1405–1410. doi: 10.2214/ajr.182.6.1821405. [DOI] [PubMed] [Google Scholar]
- 19.Yang X, Zhang Q, Guo X. Value of magnetic resonance imaging in brucellar spondylodiscitis. Radiol Med. 2014;119:928–933. doi: 10.1007/s11547-014-0416-x. [DOI] [PubMed] [Google Scholar]
- 20.Sapico FL, Montgomerie JZ. Pyogenic vertebral osteomyelitis: report of nine cases and review of the literature. Rev Infect Dis. 1979;1:754–776. doi: 10.1093/clinids/1.5.754. [DOI] [PubMed] [Google Scholar]
- 21.Tali ET, Koc AM, Oner AY. Spinal brucellosis. Neuroimag Clin N Am. 2015;25:233–245. doi: 10.1016/j.nic.2015.01.004. [DOI] [PubMed] [Google Scholar]
- 22.Li T, Li W, Du Y, et al. Discrimination of pyogenic spondylitis from brucellar spondylitis on MRI. Medicine. 2018;97:e11195. doi: 10.1097/MD.0000000000011195. [DOI] [PMC free article] [PubMed] [Google Scholar]
- 23.Sharif HS, Clark DC, Aabed MY, et al. Granulomatous spinal infections: MR imaging. Radiology. 1990;177:101–107. doi: 10.1148/radiology.177.1.2399306. [DOI] [PubMed] [Google Scholar]
- 24.Galhotra RD, Jain T, Sandhu P, et al. Utility of magnetic resonance imaging in the differential diagnosis of tubercular and pyogenic spondylodiscitis. J Nat Sci Biol Med. 2015;6:388–393. doi: 10.4103/0976-9668.160016. [DOI] [PMC free article] [PubMed] [Google Scholar]
- 25.Yilmaz MH, Mete B, Kantarci F, et al. Tuberculous, brucellar and pyogenic spondylitis: comparison of magnetic resonance imaging findings and assessment of its value. South Med J. 2007;100:613–614. doi: 10.1097/SMJ.0b013e3180600eaa. [DOI] [PubMed] [Google Scholar]
- 26.Sharif HS, Aideyan OA, Clark DC, et al. Brucellar and tuberculous spondylitis: comparative imaging features. Radiology. 1989;171:419–425. doi: 10.1148/radiology.171.2.2704806. [DOI] [PubMed] [Google Scholar]
- 27.Yang HJ, Behzad S, Pang JN, et al. Free-breathing, motion-corrected, highly efficient whole heart T2 mapping at 3T with hybrid radial-cartesian trajectory. Magn Reson Med. 2016;75:126–136. doi: 10.1002/mrm.25576. [DOI] [PMC free article] [PubMed] [Google Scholar]


