Abstract
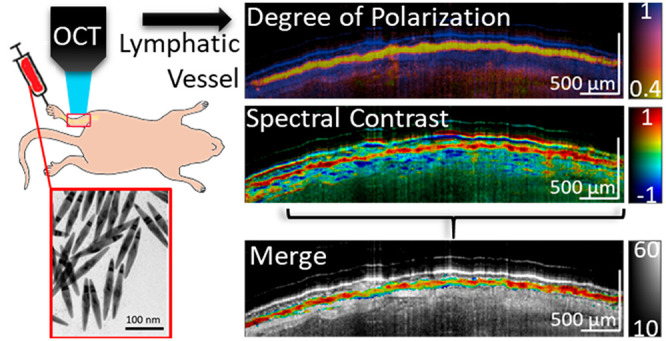
Polarization-sensitive optical coherence tomography (PS-OCT) reveals the subsurface microstructure of biological tissue and provides information regarding the polarization state of light backscattered from tissue. Complementing OCT’s structural signal with molecular imaging requires strategies to simultaneously detect multiple exogenous contrast agents with high specificity in tissue. Specific detection of molecular probes enables the parallel visualization of physiological, cellular, and molecular processes. Here we demonstrate that, by combining PS-OCT and spectral contrast (SC)-OCT measurements, we can distinguish signatures of different gold nanobipyramids (GNBPs) in lymphatic vessels from the surrounding tissue and blood vessels in live mouse models. This technique could well be extended to other anisotropic nanoparticle-based OCT contrast agents and presents significant progress toward enabling OCT molecular imaging.
Keywords: optical coherence tomography, depolarization, contrast agent, lymphatic system, in vivo imaging, gold nanoparticles
Introduction
In vivo optical molecular imaging provides visualization of different biomarkers for tracking and mapping of cellular processes and interactions in living tissue. Fluorescent labeling is commonly utilized for multiplexed tracking of many of these biological interactions.1 However, the conventional detection of widefield epifluorescence is often limited to a few hundreds of micrometers in depth unless advanced multiphoton excitation is used.2−4 Optical coherence tomography (OCT) reveals the microstructure of biological tissue by measuring the path length difference of backscattered light at a micrometer-scale resolution and with a millimeter-scale depth of penetration.5 Polarization-sensitive (PS)-OCT further determines the polarization state of the detected light to provide additional information regarding tissue retardation and depolarization.6 Optical-molecular probes are critical for further enabling the parallel visualization of physiological, cellular, and molecular processes. Unfortunately, most small molecules, antibodies, and fluorescent probes lack intrinsic OCT contrast, as they produce little detectable change in the index of refraction in the second near-infrared window (NIR-II). Developing imaging probes for use with OCT would enable the visualization of biomarkers concurrently with anatomical features at micrometer-scale resolution over wide areas of tissue at several millimeters in depth.
A number of approaches to develop exogenous functional OCT contrast agents have been studied, such as microspheres, high-aspect-ratio nanostructures, magnetic nanoparticles, and plasmonic nanoparticles.7−14 Plasmonic gold nanostructures have shown promise due to their tunable optical properties and biocompatibility.15 The unique spectral signatures of plasmonic gold nanostructures have been used for multiplexed OCT imaging in vivo.16−18 However, their detection relied on flow-gating with OCT-angiography (OCTA) to isolate flowing or diffusing particles.16−19 This allowed for the elimination of artificial spectral signatures induced by speckles in the static background signal. However, the reliance on particle motion significantly restricts labeling strategies and precludes the detection of static particles. In a parallel effort, we recently reported that ensembles of randomly oriented high-aspect-ratio gold nanorods (GNRs) act as a source of depolarization and that this can serve as a detection mechanism of GNRs in vivo. However, depolarization lacks a pronounced spectral dependence and does not allow for multiplexing.20 To address the need for multiplexed and specific detection of exogenous labels in scattering tissue, here we combine depolarization and spectral measurements to achieve a versatile and specific image contrast for gold nanoparticles with PS-OCT.
In this study, we first characterize the depolarization and spectral signatures of gold nanobipyramids (GNBPs) using a wavelength swept-source PS-OCT system in a series of in vitro experiments. We then show that depolarization and spectral measurements can be used to visualize subcutaneous injections of GNBPs for multiplexed mapping of lymphatic vessels in vivo and enable identification of static GNBPs collected in associated draining lymph nodes.
Results and Discussion
In Vitro Characterization of Depolarization and Spectral Contrast Signals
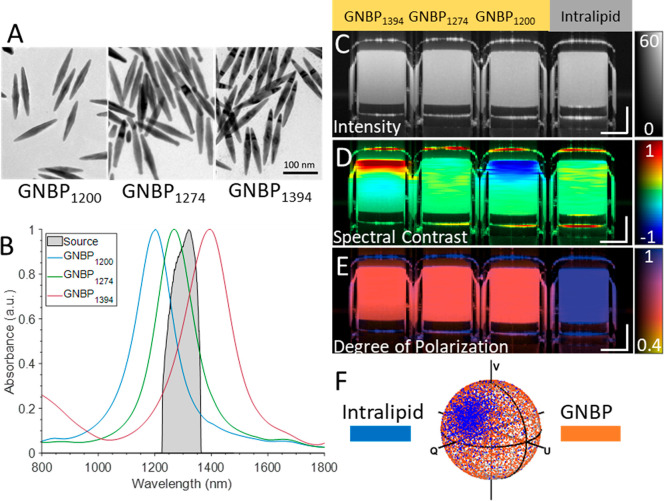
Gold nanobipyramids were prepared according to the method described in the Supporting Information and by Si et al.18 The synthesized GNBPs were imaged using transmission electron microscopy (Figure 1A). Three different kinds of GNBPs were synthesized with plasmonic resonances at 1200, 1274, and 1394 nm, allowing portions of their spectra to overlap with the spectral band of NIR-II wavelength swept-source PS-OCT systems (Figure 1B). GNBPs were chosen due to their narrower plasmonic bandwidth in comparison to gold nanorods.18 Throughout this work a wavelength swept-source PS-OCT system was used with a source central wavelength of 1310 nm and with an approximate axial resolution of 10 μm and a lateral resolution of 20 μm. To demonstrate depolarization and spectral contrast (SC) measurements of GNBPs, four capillary tubes containing a control (intralipid 1%) and three different 500 pM GNBP solutions were imaged. Intralipid was used as a control due to its common use as an OCT contrast agent and its lack of significant intrinsic spectral or polarization characteristics.21 Intensity images of the capillary tubes reveal similar scattering signals among the samples (Figure 1C). Next, the spectral contrast was computed using a dual-band spectral analysis algorithm.17,18,22 In brief, the algorithm computes two OCT interferograms utilizing the halves of the source spectral bandwidth. Computational corrections for dispersion, rolloff, and source power imbalance were applied to both bands. Afterward, the intensity tomogram originating from the shorter wavelength half was subtracted from the longer wavelength tomogram to reveal spectral differences in the scattering signal. Enhanced scattering at longer wavelengths of the PS-OCT spectrum results in positive (red) spectral contrast, while enhanced scattering in the shorter half results in negative (blue) spectral contrast. GNBP1200 and GNBP1394 exhibit negative and positive contrast, respectively (Figure 1D). Alternatively, intralipid and GNBP1274 exhibit neutral spectral contrast, as scattering is approximately equal across the halves of the source spectrum (Figure 1D). Both GNBP1200 and GNBP1394 exhibit an apparent neutralizing spectral contrast signal with depth as a result of particle absorption, previously referred to as spectral shadowing.18 Prior to this study, to the best of our knowledge, only high-aspect-ratio GNRs had been demonstrated to exhibit depolarization that could be used as a contrast mechanism for PS-OCT.20 A numerical analysis revealed similar polarization-dependent scattering cross sections of GNBPs and GNRs near the longitudinal resonance wavelength (Figure S1). To confirm this experimentally, we quantified depolarization or polarization state scrambling using degree of polarization (DOP) measurements with PS-OCT.20,23 DOP quantifies the uniformity of polarization states expressed as Stokes vectors in a small spatial neighborhood of a PS-OCT tomogram. DOP is in the range of 1 (completely polarized) to 0 (completely depolarized), where the polarization states have a high degree of randomness. The experimental results revealed that each GNBP exhibited a strong depolarization signature visualized by a loss of DOP (Figure 1E,F). Additionally, DOP measurements enable differentiation of the neutrally contrasting intralipid control from neutrally contrasting GNBP1274.
Figure 1.
(A) TEM images of GNBPs. (B) Spectra of GNBPs and the PS-OCT system source spectrum. (C) Intensity images GNBP1394, GNBP1274, GNBP1200, and intralipid (left to right). (D) Spectral contrast (SC) and (E) degree of polarization (DOP). (F) Poincare sphere showing raw Stokes vectors of nondepolarizing intralipid vs depolarizing GNBPs. Scale bars: 250 μm. SC color scale: −1 to 1. DOP: 0.4 to 1. The intensity is on the dB scale.
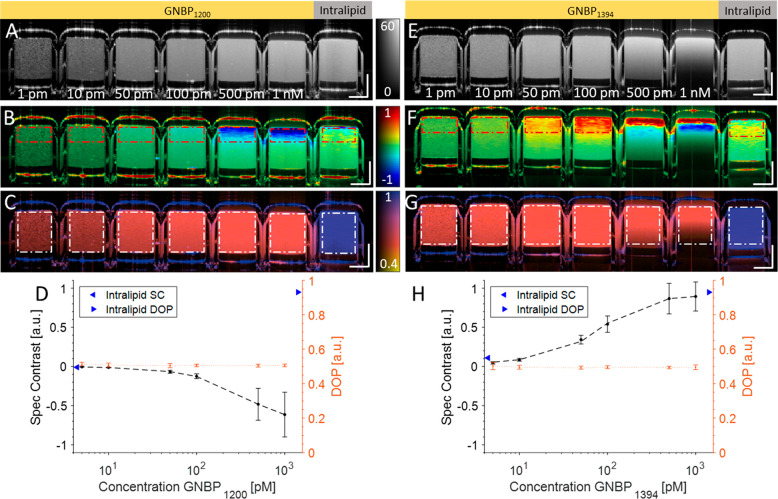
We then imaged a dilution series of GNBP1200 and GNBP1394 suspended in water along with an intralipid control (Figure 2). The full spectrum intensity visibly increases as the concentration increases from 1 pM to 1 nM for both GNBP1200 and GNBP1394 (Figure 2A,E). GNBP1200 shows a negative spectral contrast due to enhanced scattering in the shorter wavelength band, while GNBP1394 exhibits positive spectral contrast due to enhanced scattering in the longer wavelength band (Figure 2B,F). Converse to scattering, GNBP absorption is also enhanced in their respective wavelength bands. Absorption-driven spectral contrast can result in an oppositely contrasting signal in comparison to scattering-driven contrast. The transition between scattering- and absorption-driven spectral contrast can most prominently be observed in Figure 2F at the 1 nM concentration. Here a strong scattering-based positive spectral contrast signal from GNBP1394 can be observed at the surface. However, this positive contrast signal becomes neutralized and eventually strongly negative at greater depths due to enhanced abortion (decreased signal) in the longer-wavelength band. For quantitative analysis, regions of interest (ROIs) were defined at the top of the tubes to avoid absorption-driven contrast effects. Additionally, both GNBP particles exhibited strong depolarization for all concentrations, while the intralipid control exhibited little loss (blue) of DOP (Figure 2D,H). In these GNBP suspensions, meaningful NIR-II scattering was only from depolarizing GNBPs; thus, all detected light should be depolarized and have a lowered DOP. Conversely, when GNBPs were mixed with nondepolarizing scatterers, such as whole blood, DOP does have a concentration dependence (Figure S2).
Figure 2.
(A) Intensity, (B) spectral contrast, and (C) DOP of a dilution series of GNBP1200 (1 nM, 500 pM, 100 pM, 50 pM, 10 pM, and 1 pM) and 1% intralipid control. (D) Quantification of spectral contrast and DOP exhibited by the control and GNBP1200 within the red and white ROIs, respectively. (E–G) Intensity, spectral contrast, and DOP of GNBP1394 and 1% intralipid. (H) Quantification of spectral contrast and DOP from GNBP1394 within the red and white ROIs, respectively. Scale bars: 250 μm. The intensity is on the dB scale. SC color scale: −1 to 1. DOP: 0.4 to 1.
In Vivo Detection of Depolarization and Spectral Signatures
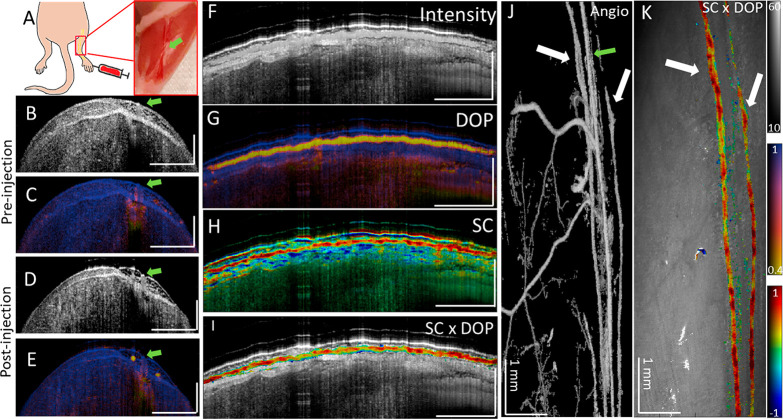
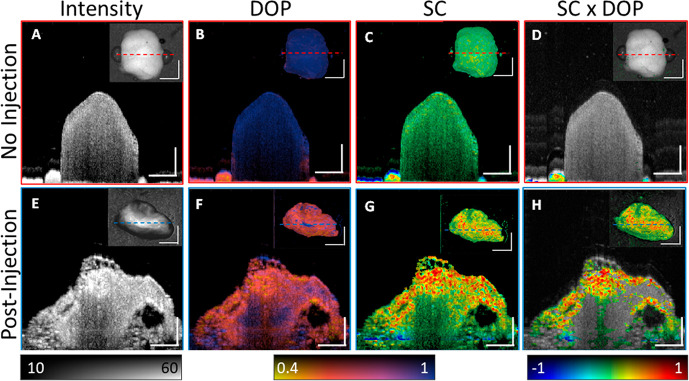
For in vivo experiments, GNBPs were PEGylated (PEG, MW ≈ 5 kDa) for stability and biocompatibility purposes. To first validate particle isolation using depolarization and identification using spectral contrast, we imaged passive accumulation of GNBP1394 in mouse hindlimb lymphatic vessels in vivo after subcutaneous injection into the foot (Figure 3A). GNBP particles used in this study were larger than 100 nm and should predominantly enter the lymphatics, as they are too large for reabsorption into blood capillaries.24 However, unlike blood, lymph minimally scatters NIR light and assessment without exogenous contrast is challenging using PS-OCT. To demonstrate, we imaged along the saphenous vein of a mouse leg before the injection of GNBP1394 (Figure 3B,C and and Figure S3). Cross-sectional intensity and DOP images of the hind leg prior to injection of 6 nM GNBP1394 (Figure S4) show no apparent lymphatic vessels or loss of DOP on either side of the saphenous vein indicated by the green arrow (Figure 3A–C). After injection of 1 uL of 6 nM GNBP1394 subcutaneously into the foot, a clear loss of DOP (in yellow) becomes visible in two vessels (Figure 3D,E). Longitudinal segmentation tracking the left lymph vessel reveals a clear intensity signal and loss of DOP along its length (Figure 3F,G). The spectral contrast shows a strong positive contrast along the length of the lymphatic vessel together with spectral noise and a strong negatively contrasting spectral shadow below the vessel (Figure 3H). The recorded volume was then segmented by masking pixels with high DOP (DOP > 0.7) and low signal levels (SNR < 20 dB). After masking, the spectral contrast was overlaid onto the longitudinal intensity, revealing a clear positive contrast signal along the length of the lymphatic vessel, consistent with the injection of GNBP1394 (Figure 3I). Additionally, an enface image using OCTA visualized the signal from blood flow and the two lymph vessels containing GNBP1394 indicated by white arrows (Figure 3J). Using DOP segmentation, an enface SC × DOP image is displayed where both lymph vessels show positive contrast (Figure 3K). To further confirm GNBP1394 uptake into the lymphatic vessels in the mouse leg, the popliteal lymph node was resected (n = 3) and imaged ex vivo (Figure 4). Without GNBP injection, popliteal lymph nodes show little depolarization or significant spectral contrast (Figure 4A–D). After GNBP1394 injection, significant loss of DOP is observed throughout the popliteal lymph node along with a strong positive contrast consistent with the signal observed in the leg (Figure 4D–G).
Figure 3.
(A) Schematic and photograph of imaging area on the hind limb after skin removal. (B, C) Intensity and DOP cross-section of the hind leg prior to GNBP1394 injection. (D, E) Intensity and DOP cross-section of the hind leg after to GNBP1394 injection. Lymphatic vessels (yellow) can be seen in (E). Longitudinal views of (F) intensity, (G) DOP, and (H) spectral contrast of the left lymphatic vessel. Note the negatively contrasting spectral shadow below most of the length of the positively contrasting lymphatic vessel. (I) Spectral contrast (SC) masked using DOP and overlaid onto the intensity image. (J) Enface intensity masked by angiography and (K) enface view of the tissue surface with masked spectral contrast. The green arrow identifies the saphenous vein. White arrows show low DOP the signal with the corresponding angiography signal, identifying lymphatic vessels. Unless otherwise noted, the horizontal scale bar is 1 mm and the vertical bar is 500 μm. The intensity is given on the dB scale. SC color scale: −1 to 1. DOP: 0.4 to 1.
Figure 4.
Resected popliteal lymph nodes. (A–D) Popliteal lymph node from a control mouse without any injection of GNBPs. Cross-section images of (A) intensity, (B) DOP, (C) spectral contrast, and (D) spectral contrast gated using DOP. (E–H) Popliteal lymph node from a mouse after GNBP1394 injection. Cross-section images of (E) intensity, (F) DOP, (G) spectral contrast, and (H) spectral contrast gated using DOP. DOP gating ignored pixels with DOP > 0.7 and SNR< 15 dB. Inset images are enface projection images. The dotted lines indicate the position of the cross-section plane. Scale bars: 0.5 mm. The intensity is given on the dB scale. SC color scale: −1 to 1.
In Vivo Multiplexing
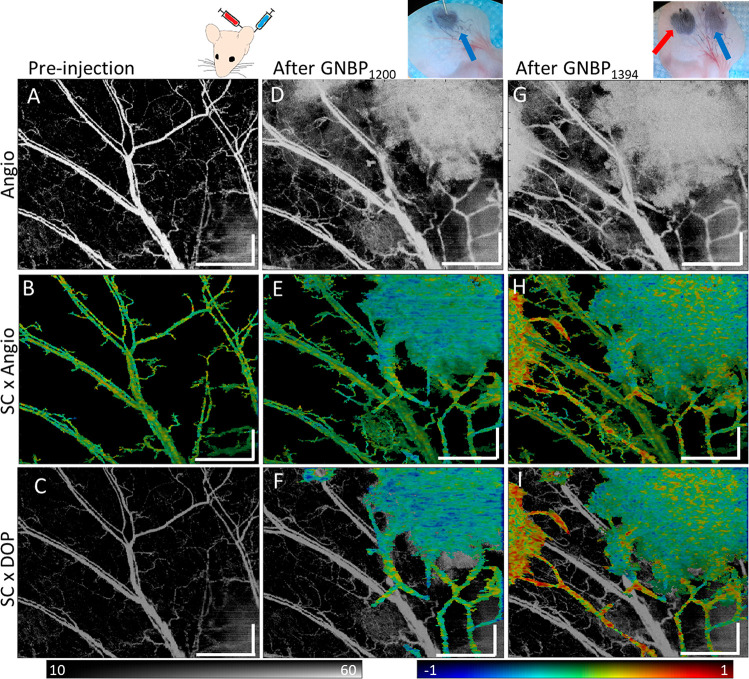
To image two contrasting GNBPs simultaneously in vivo, we subcutaneously injected 1.0 μL of 6 nM PEGylated GNBP1200 and GNBP1394 at two separate locations sequentially into the ear of a mouse. Due to the GNBP size, particles will be preferentially taken up by lymphatic vessels. PS-OCT volumetric scans of the ear were taken prior to injection of both particles (Figure 5A–C). Enface projections of angiography prior to injection of particles are shown (Figure 5A). Spectrally neutral blood vessels can be observed (Figure 5B), and no vessels exhibit significant DOP loss (Figure 5C). Upon injection of GNBP1200, we observed an enhanced angiography signal at the GNBP1200 injection site and a new signal from presumably lymphatic vessels predominantly in the lower right quadrant (Figure 5D). Angiography was then used to segment the spectral contrast but without prior knowledge does not differentiate between blood flow and lymph flow (Figure 5E). Although negative contrast is visible from the GNBP1200 injection, some areas of the lymphatic vessel still appear neutral due to variations in concentrations of GNBP in the vessels. After DOP segmentation, lymphatic vessels containing GNBPs can be clearly differentiated from blood vessels, which only showed an angiographic signal (Figure 5F). After GNBP1394 injection in a different location, additional lymphatic vessels draining that area of skin become visible in angiography (Figure 5G). The angiography signal and positive spectral contrast signal were then observed at the left injection site (Figure 5H). DOP differentiates GNBPs in lymphatic vessels from confounding blood flow (Figure 5I). Here we were able to show clear differentiation between blood flow and GNBP particle uptake in lymphatic vessels by using depolarization and spectral signatures.
Figure 5.
Sequential GNBP injection into mouse ear. (A) Angiography image of a mouse ear prior to GNBP injection. (B) Spectral contrast masked using angiography. (C) Spectral contrast masked using DOP masking overlaid onto the dimmed angiography image for reference. No significant DOP loss wasobserved prior to injection. (D) Angiography after GNBP1200 injection showing the first injection site in the upper right. (E) Spectral contrast masked using angiography and (F) spectral contrast masked using DOP overlaid onto the dimmed angiography image. (G) Angiography after GNBP1394 injection on the left side of the ear. (H) Spectral contrast masked using angiography and (I) spectral contrast masked using DOP overlaid onto the dimmed angiography image. Scale bars: 1 mm. The intensity is given on the dB scale. SC color scale: −1 to 1.
Conclusions
We have shown that the combination of depolarization and spectral measurements enables a contrast enhancement of multiplexed, exogenous labels with PS-OCT. Utilizing depolarization, we demonstrated that GNBP locations can be differentiated from the surrounding highly scattering tissue. Spectral measurements of isolated GNBPs can be used to identify GNBPs with differing plasmonic resonances. In combination, this detection scheme offers a platform for direct detection and differentiation of nanoparticles within highly scattering tissue. Furthermore, depolarization and spectral-based detection uniquely enables differentiation of neutrally contrasting particles, such as GNBP1274, from other spectrally neutral nondiattenuating sources. Scattering from GNBPs in lymphatic vessels can also be differentiated from moving scatterers in blood vessels to better separate lymphatic and blood vessel scattering without the need for manual segmentation.18,25
One area of possible interreference of GNBP detection using depolarization is endogenous depolarizing structures such as the retinal pigment epithelium (RPE), optic nerve head, and arterial plaques. Additional image segmentation would be required in the presence of such depolarizing structures or others.26,27 However, unlike other molecular imaging techniques, this scattering-based method has the advantage of not being hindered by photobleaching, quenching, or autofluorescence. In comparison with previously reported OCT spectral contrast techniques,18 this polarization-dependent spectral contrast method enables the specific detection of multiple nanoparticles simultaneously both inside and outside the vascular system, providing prospects for a wide range of biological applications.
The novel detection and multiplexing technique we report here provides a platform for in vivo imaging studies using PS-OCT. This technique opens up many opportunities for in vivo optical molecular imaging and can provide visualization of multiple contrast agents simultaneously at micrometer-scale resolution and millimeter scales of depth. For lymphatic research, our technique could be used to map lymphangiogenesis in tumors, an important factor in cancer progression and immunotherapy. Lymph node metastasis has profound clinical significance, and this technique could be employed for sentinel lymph nodes or lymphangiogenesis biomarkers.28 This technique could also enable further study of the role of the lymphatic system in the brain and its relation to neurodegenerative disease.
Materials and Methods
Complete details of methods for nanoparticle synthesis, instrumentation, image processing, and in vitro and in vivo experiments are provided in the Supporting Information.
Acknowledgments
The authors would like to thank Taylor Cannon for assistance with in vitro experiments and Dr. Pinji Lei for help with animal imaging. The work was funded by grant number P41EB015903 awarded by the National Institute of Biomedical Imaging and Bioengineering anda Grant No. 5F99CA212217-02 F99/K00 fellowship awarded by the National Cancer Institute of the National Institutes of Health. Further support was provided by NIH R01CA214913 (T.P.P.), MGH Research Scholars Program (T.P.P.), NIH F32HL156654 (M.R.), the Claire Giannini Fund, the National Institutes of Health (NIH DP50D012179), the Damon Runyon Cancer Research Foundation (DFS#06-13), the Donald E. and Delia B. Baxter Foundation, and the Skippy Frank Foundation. A.d.l.Z. is a Chan Zuckerberg Biohub investigator and a Pew-Stewart Scholar for Cancer Research supported by The Pew Charitable Trusts and The Alexander and Margaret Stewart Trust.
Supporting Information Available
The Supporting Information is available free of charge at https://pubs.acs.org/doi/10.1021/acs.nanolett.1c02291.
Preparation of gold nanobipyramids, optical coherence tomography imaging system specifications, spectral contrast and depolarization image processing, in vitro imaging experimental methods, in vivo animal imaging and handling methods, electromagnetic simulations of gold nanobipyramids, simulated scattering of GNBPs from 400 to 1600 nm, signal from GNBP dilutions mixed with human whole blood, in vivo mouse leg pre- and postinjection of GNBPs control image, in vitro comparison of depolarization and spectral contrast of 6 nM vs 1 nM GNBP, and evaluation of cellular uptake of GNBPs (PDF)
Author Contributions
■ P.K. and P.S. contributed equally.
Author Contributions
P.K. and P.S. designed the experiments, P.K,. P.S., and M.R. performed the experiments, P.K., P.S., and S.Y. wrote the code for image processing and data analysis. All authors analyzed the data. P.K., P.S., M.V., T.P.P., A.d.l.Z., and B.B. wrote the manuscript with contributions from all authors.
The authors declare no competing financial interest.
Supplementary Material
References
- Hellebust A.; Richards-Kortum R. Advances in Molecular Imaging: Targeted Optical Contrast Agents for Cancer Diagnostics. Nanomedicine 2012, 7 (3), 429–445. 10.2217/nnm.12.12. [DOI] [PMC free article] [PubMed] [Google Scholar]
- Ntziachristos V. Going Deeper than Microscopy: The Optical Imaging Frontier in Biology. Nat. Methods 2010, 7 (8), 603–614. 10.1038/nmeth.1483. [DOI] [PubMed] [Google Scholar]
- Yun S. H.; Tearney G. J.; Vakoc B. J.; Shishkov M.; Oh W. Y.; Desjardins A. E.; Suter M. J.; Chan R. C.; Evans J. A.; Jang I.; Nishioka N. S.; de Boer J. F.; Bouma B. E. Comprehensive Volumetric Optical Microscopy in Vivo. Nat. Med. 2006, 12 (12), 1429–1433. 10.1038/nm1450. [DOI] [PMC free article] [PubMed] [Google Scholar]
- Liu H.; Deng X.; Tong S.; He C.; Cheng H.; Zhuang Z.; Gan M.; Li J.; Xie W.; Qiu P.; Wang K. In Vivo Deep-Brain Structural and Hemodynamic Multiphoton Microscopy Enabled by Quantum Dots. Nano Lett. 2019, 19 (8), 5260–5265. 10.1021/acs.nanolett.9b01708. [DOI] [PubMed] [Google Scholar]
- Huang D.; Swanson E. A.; Lin C. P.; Schuman J. S.; Stinson W. G.; Chang W.; Hee M. R.; Flotte T.; Gregory K.; Puliafito C. A.; Fujimoto J. G. Optical Coherence Tomography. Science 1991, 254 (5035), 1178–1181. 10.1126/science.1957169. [DOI] [PMC free article] [PubMed] [Google Scholar]
- Hee M. R.; Swanson E. A.; Fujimoto J. G.; Huang D. Polarization-Sensitive Low-Coherence Reflectometer for Birefringence Characterization and Ranging. J. Opt. Soc. Am. B 1992, 9 (6), 903. 10.1364/JOSAB.9.000903. [DOI] [Google Scholar]
- Lee T. M.; Oldenburg A. L.; Sitafalwalla S.; Marks D. L.; Luo W.; Toublan F. J.-J.; Suslick K. S.; Boppart S. A. Engineered Microsphere Contrast Agents for Optical Coherence Tomography. Opt. Lett. 2003, 28 (17), 1546. 10.1364/OL.28.001546. [DOI] [PubMed] [Google Scholar]
- John R.; Rezaeipoor R.; Adie S. G.; Chaney E. J.; Oldenburg A. L.; Marjanovic M.; Haldar J. P.; Sutton B. P.; Boppart S. A. In Vivo Magnetomotive Optical Molecular Imaging Using Targeted Magnetic Nanoprobes. Proc. Natl. Acad. Sci. U. S. A. 2010, 107 (18), 8085–8090. 10.1073/pnas.0913679107. [DOI] [PMC free article] [PubMed] [Google Scholar]
- Agrawal A.; Huang S.; Wei Haw Lin A.; Lee M.-H.; Barton J. K.; Drezek R. A.; Pfefer T. J. Quantitative Evaluation of Optical Coherence Tomography Signal Enhancement with Gold Nanoshells. J. Biomed. Opt. 2006, 11 (4), 041121. 10.1117/1.2339071. [DOI] [PubMed] [Google Scholar]
- Jung Y.; Reif R.; Zeng Y.; Wang R. K. Three-Dimensional High-Resolution Imaging of Gold Nanorods Uptake in Sentinel Lymph Nodes. Nano Lett. 2011, 11 (7), 2938–2943. 10.1021/nl2014394. [DOI] [PMC free article] [PubMed] [Google Scholar]
- Oldenburg A. L.; Crecea V.; Rinne S. A.; Boppart S. A. Phase-Resolved Magnetomotive OCT for Imaging Nanomolar Concentrations of Magnetic Nanoparticles in Tissues. Opt. Express 2008, 16 (15), 11525–11539. 10.1364/OE.16.011525. [DOI] [PMC free article] [PubMed] [Google Scholar]
- Tucker-Schwartz J. M.; Beavers K. R.; Sit W. W.; Shah A. T.; Duvall C. L.; Skala M. C. In Vivo Imaging of Nanoparticle Delivery and Tumor Microvasculature with Multimodal Optical Coherence Tomography. Biomed. Opt. Express 2014, 5 (6), 1731. 10.1364/BOE.5.001731. [DOI] [PMC free article] [PubMed] [Google Scholar]
- Lapierre-Landry M.; Gordon A. Y.; Penn J. S.; Skala M. C. In Vivo Photothermal Optical Coherence Tomography of Endogenous and Exogenous Contrast Agents in the Eye. Sci. Rep. 2017, 7 (1), 9228. 10.1038/s41598-017-10050-5. [DOI] [PMC free article] [PubMed] [Google Scholar]
- Xu Y.; Zhou B.; Zhuang C.; Zhou J.; Chen H.; Deng S. High-Aspect-Ratio Plasmonic Heterostructures for In Vivo Enhanced Optical Coherence Tomography Imaging in the Second Near-Infrared Biological Window. Adv. Opt. Mater. 2020, 8 (15), 2000384. 10.1002/adom.202000384. [DOI] [Google Scholar]
- Dreaden E. C.; Alkilany A. M.; Huang X.; Murphy C. J.; El-Sayed M. A. The Golden Age: Gold Nanoparticles for Biomedicine. Chem. Soc. Rev. 2012, 41 (7), 2740–2779. 10.1039/C1CS15237H. [DOI] [PMC free article] [PubMed] [Google Scholar]
- Si P.; Yuan E.; Liba O.; Winetraub Y.; Yousefi S.; Sorelle E. D.; Yecies D. W.; Dutta R.; De La Zerda A. Gold Nanoprisms as Optical Coherence Tomography Contrast Agents in the Second Near-Infrared Window for Enhanced Angiography in Live Animals. ACS Nano 2018, 12 (12), 11986–11994. 10.1021/acsnano.8b03862. [DOI] [PubMed] [Google Scholar]
- Liba O.; Sorelle E. D.; Sen D.; De La Zerda A. Contrast-Enhanced Optical Coherence Tomography with Picomolar Sensitivity for Functional in Vivo Imaging. Sci. Rep. 2016, 6 (1), 1–12. 10.1038/srep23337. [DOI] [PMC free article] [PubMed] [Google Scholar]
- Si P.; Shevidi S.; Yuan E.; Yuan K.; Lautman Z.; Jeffrey S. S.; Sledge G. W.; de la Zerda A. Gold Nanobipyramids as Second Near Infrared Optical Coherence Tomography Contrast Agents for in Vivo Multiplexing Studies. Nano Lett. 2020, 20 (1), 101–108. 10.1021/acs.nanolett.9b03344. [DOI] [PubMed] [Google Scholar]
- Chhetri R. K.; Blackmon R. L.; Wu W. C.; Hill D. B.; Button B.; Casbas-Hernandez P.; Troester M. A.; Tracy J. B.; Oldenburg A. L.; Yang C. Probing Biological Nanotopology via Diffusion of Weakly Constrained Plasmonic Nanorods with Optical Coherence Tomography. Proc. Natl. Acad. Sci. U. S. A. 2014, 111 (41), E4289–E4297. 10.1073/pnas.1409321111. [DOI] [PMC free article] [PubMed] [Google Scholar]
- Lippok N.; Villiger M.; Albanese A.; Meijer E. F. J.; Chung K.; Padera T. P.; Bhatia S. N.; Bouma B. E. Depolarization Signatures Map Gold Nanorods within Biological Tissue. Nat. Photonics 2017, 11 (9), 583–588. 10.1038/nphoton.2017.128. [DOI] [PMC free article] [PubMed] [Google Scholar]
- Si P.; Honkala A.; de la Zerda A.; Smith B. R. Optical Microscopy and Coherence Tomography of Cancer in Living Subjects. Trends in Cancer 2020, 6 (3), 205–222. 10.1016/j.trecan.2020.01.008. [DOI] [PubMed] [Google Scholar]
- Villiger M.; Zhang E. Z.; Nadkarni S. K.; Oh W.-Y.; Vakoc B. J.; Bouma B. E. Spectral Binning for Mitigation of Polarization Mode Dispersion Artifacts in Catheter-Based Optical Frequency Domain Imaging. Opt. Express 2013, 21 (14), 16353. 10.1364/OE.21.016353. [DOI] [PMC free article] [PubMed] [Google Scholar]
- Lippok N.; Villiger M.; Bouma B. E. Degree of Polarization (Uniformity) and Depolarization Index: Unambiguous Depolarization Contrast for Optical Coherence Tomography. Opt. Lett. 2015, 40 (17), 3954–3957. 10.1364/OL.40.003954. [DOI] [PMC free article] [PubMed] [Google Scholar]
- Swartz M. The Physiology of the Lymphatic System. Adv. Drug Delivery Rev. 2001, 50 (1–2), 3–20. 10.1016/S0169-409X(01)00150-8. [DOI] [PubMed] [Google Scholar]
- Liba O.; SoRelle E. D.; Sen D.; de la Zerda A. Contrast-Enhanced Optical Coherence Tomography with Picomolar Sensitivity for Functional in Vivo Imaging. Sci. Rep. 2016, 6 (1), 23337. 10.1038/srep23337. [DOI] [PMC free article] [PubMed] [Google Scholar]
- Ahlers C.; Götzinger E.; Pircher M.; Golbaz I.; Prager F.; Schütze C.; Baumann B.; Hitzenberger C. K. Imaging of the Retinal Pigment Epithelium in Age-Related Macular Degeneration Using Polarization-Sensitive Optical Coherence Tomography. Invest. Ophthalmol. Visual Sci. 2010, 51 (4), 2149–2157. 10.1167/iovs.09-3817. [DOI] [PMC free article] [PubMed] [Google Scholar]
- Villiger M.; Otsuka K.; Karanasos A.; Doradla P.; Ren J.; Lippok N.; Shishkov M.; Daemen J.; Diletti R.; van Geuns R.-J.; Zijlstra F.; van Soest G.; Libby P.; Regar E.; Nadkarni S. K.; Bouma B. E. Coronary Plaque Microstructure and Composition Modify Optical Polarization. JACC Cardiovasc. Imaging 2018, 11 (11), 1666–1676. 10.1016/j.jcmg.2017.09.023. [DOI] [PMC free article] [PubMed] [Google Scholar]
- Padera T. P.; Meijer E. F. J.; Munn L. L. The Lymphatic System in Disease Processes and Cancer Progression. Annu. Rev. Biomed. Eng. 2016, 18 (1), 125–158. 10.1146/annurev-bioeng-112315-031200. [DOI] [PMC free article] [PubMed] [Google Scholar]
Associated Data
This section collects any data citations, data availability statements, or supplementary materials included in this article.


