

Abstract
Background & objectives:
India witnessed a massive second surge of COVID-19 cases since March 2021 after a period of decline from September 2020. Data collected under the National Clinical Registry for COVID-19 (NCRC) were analysed to describe the differences in demographic and clinical features of COVID-19 patients recruited during these two successive waves.
Methods:
The NCRC, launched in September 2020, is an ongoing multicentre observational initiative, which provided the platform for the current investigation. Demographic, clinical, treatment and outcome data of hospitalized, confirmed COVID-19 patients were captured in an electronic data portal from 41 hospitals across India. Patients enrolled during September 1, 2020 to January 31, 2021 and February 1 to May 11, 2021 constituted participants of the two successive waves, respectively.
Results:
As on May 11, 2021, 18961 individuals were recruited in the registry, 12059 and 6903 reflecting in-patients from the first and second waves, respectively. Mean age of the patients was significantly lower in the second wave [48.7 (18.1) yr vs. 50.7 (18.0) yr, P<0.001] with higher proportion of patients in the younger age group intervals of <20, and 20-39 yr. Approximately 70 per cent of the admitted patients were ≥ 40 yr of age in both waves of the pandemic. The proportion of males were slightly lower in second wave as compared to the first [4400 (63.7%) vs. 7886 (65.4%), P=0.02]. Commonest presenting symptom was fever in both waves. In the second wave, a significantly higher proportion [2625 (48.6%) vs. 4420 (42.8%), P<0.003] complained of shortness of breath, developed ARDS [422(13%) vs. 880 (7.9%), P<0.001], required supplemental oxygen [1637 (50.3%) vs. 4771 (42.7%), P<0.001], and mechanical ventilation [260 (15.9%) vs. 530 (11.1%), P<0.001]. Mortality also significantly increased in the second wave [OR: 1.35 (95% CI: 1.19, 1.52)] in all age groups except in <20 yr.
Interpretation & conclusions:
The second wave of COVID-19 in India was slightly different in presentation than the first wave, with a younger demography, lesser comorbidities, and presentation with breathlessness in greater frequency.
Keywords: Complication, National Clinical Registry for COVID-19, outcome, pandemic waves, symptom
The COVID-19 pandemic has been raging across the globe since early January 2020. Various geographical regions have been experiencing multiple waves of upsurge of cases which are not matched temporally as well as in severity. A similar phenomenon was seen during the 1918 influenza pandemic1.
The first case of COVID-19 was reported in India on January 30, 20202, and since then India has reported over 27 million cases and more than 3,00,000 deaths3. While the peak of SARS-CoV-2 infection declined in September 2020, India witnessed a massive second surge of COVID-19 cases since March 2021, with different parts of the country in different phases of the surge3. The daily test positivity rate has revealed that the spread of infection has been explosive with steep rise in absolute number of cases4,5. However, there is no published literature describing the demographic and clinical attributes of the second wave. Studies elucidating the disease characteristics of the multiple waves have been forthcoming from countries such as Germany, South Korea, Japan, and Iran6,7,8,9. Worth noting is that the COVID-19 disease has shown distinct symptomatology as well as outcome across the geographical borders owing to multiple factors such as population distribution, genetic makeup, baseline diseases, health infrastructure and probably some factors that are yet to be completely understood. The Indian Council of Medical Research (ICMR) had launched a ‘National Clinical Registry for COVID-19 (NCRC)’ in collaboration with the Ministry of Health and Family Welfare (MoHFW), All India Institute of Medical Sciences (AIIMS), New Delhi and ICMR-National Institute of Medical Statistics (ICMR-NIMS) to systemically record the clinical and management details of hospitalized COVID-19 patients. Against this backdrop, an analysis of the data collected in the NCRC was undertaken to describe the differences in demographic and clinical features of the COVID-19 patients recruited during the two waves in India.
Material & Methods
National Clinical Registry for COVID-19: The NCRC is an ongoing prospective multicentre clinical database, initiated and maintained by the ICMR in collaboration with the MoHFW, AIIMS and ICMR-NIMS, New Delhi. The registry was launched in September 2020 with an objective of generating COVID-19 related data pertaining to symptom profile, clinical progress, treatment received and outcome of hospitalized COVID-19 patients. This registry aims to guide the evolution of National COVID-19 management guidelines. Additionally, this registry acts as a platform to generate various hypotheses, conduct clinical trials, and assess the efficacy of different treatment models being used in real practice.
The structure and protocol of the registry are available in the public domain. (https://www.icmr.gov.in/tab1ar1.html). A hub and spoke model has been adopted for this registry. At the beginning, an expression of intent was invited for participation in the registry network. The hospitals which responded were then screened based on a site feasibility matrix. Currently, 41 tertiary care hospitals both public and private, across India, are enrolling hospitalized, confirmed COVID-19 patients in this registry (Fig. 1). The analysis presented here was based on the findings generated from these records maintained by the participating centres. Patients were managed as per the clinical discretion of the attending physicians, based on the available National and State guidelines. The diagnosis was made by the treating physicians based on the standard guidelines as followed by their hospitals. The data were collected and entered to the portal on the date of admission, but complete dataset became available only after the patient was discharged or died in the hospital. A proportion of the data was randomly verified by the site investigators and the implementation team at ICMR. This caused a considerable lag in the availability of outcome data. For outcome analysis, only the completed datasets were included. The performa used was vetted by the COVID-19 National Task Force as well as the Clinical Research Group. It was pilot tested in a few centres before starting the main study.
Fig. 1.

Spot map of India indicating the hospitals participating in the National Clinical Registry for COVID-19. Institutes Participating in the National Clinical Registry for COVID-19: (i) North: Postgraduate Institute of Medical Education & Research, Chandigarh; Medanta Institute of Education and Research, Gurugram; Christian Medical College, Ludhiana; Pandit Bhagwat Dayal Sharma Post Graduate Institute of Medical Sciences, Rohtak. (ii)West: All India Institute of Medical Sciences, Jodhpur; Rajasthan University of Medical Sciences, Mahatma Gandhi Medical College and Hospital, Jaipur; Sardar Patel Medical College, Bikaner; Smt. NHL Muncipal Medical College, CIMS Hospital, Ahmedabad; Sumandeep Vidyapeeth and Institution, Deemed to be University & Dhiraj Hospital, Vadodara; GMERS Medical College and Hospital, Himmatnagar. (iii) East: All India Institute of Medical Sciences, IMS & SUM hospital, Hitech Medical college, Bhubaneswar; Patliputra Medical College & Hospital, Dhanbad; Government Medical college, Jagdalpur; Institute of Post-Graduate Medical Education and Research, The Medical College, Infectious Diseases & Beliaghata General Hospital, College of Medicine and Sagore Dutta Hospital, Kamarhati, Tata Medical Centre, Kolkata; All India Institute of Medical Sciences, ESI hospital, Raipur. (iv) Central: Aligarh Muslim University, Aligarh; All India Institute of Medical Sciences, Gandhi Medical College, Bhopal; King George's Medical University, Lucknow; Government Institute of Medical Sciences, Greater Noida; R.D. Gardi Medical College, Ujjain; J.N. Medical College, Banaras Hindu University, Varanasi. (v) North-East: North-Eastern Indira Gandhi Regional Institute of Health and Medical Sciences, Shillong; Naga Hospital Authority, Kohima, Nagaland. (vi) South: National Institute of Mental Health and Neuro-sciences, Bowring and Lady Curzon Medical college and Research Institute, St. John's Medical College Hospital, Bengaluru; Nizam's Institute of Medical Sciences, ESIC Medical College, Hyderabad; Gulbarga Institute of Medical Sciences, Kalburgi; Gandhi Medical College, Secunderabad; Kakatiya Medical College/MGM Hospital, Warangal.
Stratification of the two waves of pandemic: To the best of our knowledge, there was no distinct demarcation of the waves of COVID-19 pandemic available for India. As per the national records, peak of the first wave of COVID-19 pandemic in India was attained on September 16, 2020 with gradual decline with the nadir reached on February 1, 2021, after which cases again started increasing with the next peak reached on May 8, 20213. Therefore, February 1, 2021 was taken as the cut-off point in between the two surges, when 8587 cases were reported across the country4 (Fig. 2). Considering February 1, 2021 as the cut-off date, the time-period between September 1, 2020 to January 31, 2021 was considered as the first wave, and from February 1 to May 11, 2021 as second wave.
Fig. 2.
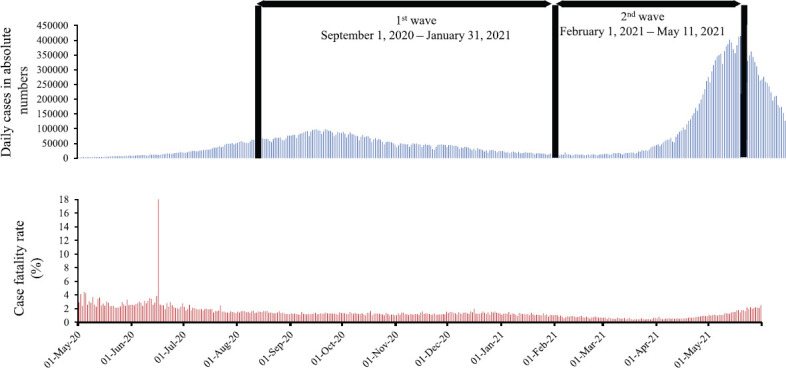
The two waves of COVID-19 pandemic in India.
For this analysis, the dataset was frozen on May 11, 2021, 1600 h and all records from September 1, 2020 onwards were considered.
Ethical clearance: Activities of the NCRC were approved by the Central Ethics Committee for Human Research at the ICMR. Individual participating sites also obtained clearances from the respective Institutional Ethics Committees. As the data collected were anonymized and retrieved from hospital case files, a waiver of consent was granted.
Data management: Demographic, clinical, treatment and outcome data were collected in an electronic data capture portal, developed and maintained by the ICMR-NIMS, by a dedicated team of 1-3 members in each of the participating hospitals. These teams were trained by the central implementation team at ICMR via an online platform. Regular refresher trainings were organized at frequent intervals, to minimise errors. The data from each site were verified by the site investigators and also by the central implementation team.
Statistical analysis: Demographic, clinical and outcome data were analysed using STATA v14 (College Station, TX, USA). Categorical data were presented as frequency and proportions, while continuous data were summarized as mean or median, as appropriate. Comparisons between the characteristics of the first and second waves were made using chi square/Fisher's exact and student t test/rank sum test, as appropriate. For multiple comparisons, Bonferroni correction was applied. Unadjusted odds ratio was calculated for the outcome parameters such as overall mortality and age-wise mortality.
Results
Profile of the enrolled patients: A total of 18961 patients were recruited in the registry as on May 11, 2021, 1600 h, of whom 12059 patients (representing 35% of the total admission in the participating centres) were enrolled before or on January 31, 2021 and were considered under the first wave. The remaining 6902 in-patients (14% of the total admission in the participating centres) were enrolled during February 1, till May 11, 2021 (Fig. 1). The distribution of patients enrolled from across the country was 5763 (30.4%) from North, 5673 (29.9%) from East, 2555 (13.5%) from South, 2503 (13.2%) from Central, 2044 (10.8%) from West and 423 (2.2%) from North-East region.
The comparative profile of demographic and clinical characteristics of enrolled patients at admission during the two waves is presented in Table I. The mean age of the study participants was approximately two years lower in the second wave as compared to the same in the first wave which was significant (P<0.001). On closer inspection, there was an increase in the proportion of patients in age groups <20 yr (456/12059, 3.8% to 304/6902, 4.4%), 20-39 yr (2855/12059, 23.7% to 1829/6902, 26.5%) and 40-60 yr (4834/12059, 40% to 2852/6902, 41.3%) during the second wave as compared to the first wave. Patients over 60 yr of age featured in higher proportion in the first wave compared to the second (3914/12059, 32.5% vs. 1917/6902, 27.8%). Lesser proportion of admitted patients had one or more comorbidities. This was consistent across the age groups except for <20 yr where only a few had comorbidities in either of the waves [2nd wave: 64 (21.1%) vs. 1st wave: 99 (21.7%), P=0.83]. Fifty per cent of the patients presented to the hospital for admission within three days of onset of symptoms during the second wave as compared to four days in the first wave.
Table I.
Demographic and clinical characteristics of patients registered in the National Clinical Registry for COVID-19 NCRC
| Characteristic | Second wave February 1, 2021 to May 11, 2021 (n=6902) | First Wave September 1, 2020 to January 31, 2021 (n=12059) | P |
|---|---|---|---|
| Age (yr), mean±SD | 48.7±18.1 | 50.7±18.0 | <0.001 |
| Age categories (yr) | |||
| <20 | 304 (4.4) | 456 (3.8) | <0.001 |
| 20-39 | 1829 (26.5) | 2855 (23.7) | |
| 40-60 | 2852 (41.3) | 4834 (40.1) | |
| >60 | 1917 (27.8) | 3914 (32.5) | |
| Gender | |||
| Male | 4400 (63.7) | 7886 (65.4) | 0.022 |
| Female | 2502 (36.3) | 4173 (34.6) | |
| Days from symptom onset to admission, median (IQR) | 3 (1-5) | 4 (2-6) | <0.001 |
| One or more comorbidities | |||
| Present | 3170 (45.9) | 6745 (55.9) | <0.001 |
| Absent | 3732 (54.1) | 5314 (44.1) | |
| Hypertension | 1902 (27.6) | 4067 (33.7) | <0.001 |
| Diabetes mellitus | 1487 (21.5) | 3198 (26.5) | <0.001 |
| Chronic cardiac disease | 288 (4.2) | 827 (6.9) | <0.001 |
| Chronic pulmonary disease | 79 (1.1) | 233 (1.9) | <0.001 |
| Asthma | 71 (1.03) | 235 (1.9) | <0.001 |
| Tuberculosis | 35 (0.5) | 103 (0.8) | 0.007 |
| Chronic kidney disease | 231 (3.3) | 478 (3.9) | 0.03 |
| Chronic liver disease | 71 (1.03) | 138 (1.1) | 0.46 |
| Malignancy | 136 (1.9) | 221 (1.8) | 0.5 |
| Symptomatic | 5404 (78.3) | 10,338 (85.7) | <0.01 |
| Asymptomatic | 1498 (21.7) | 1721 (14.3) |
Values are expressed as n (%) unless specified. SD, standard deviation; IQR, interquartile range
Symptomatology: The proportion of asymptomatic patients at the time of admission had considerably increased during the second wave. Amongst the symptoms noted, shortness of breath in the second wave increased by six per cent (4420/10338, 42.8% to 2625/5404, 48.6%, P<0.001) as compared to the first wave. The common presenting complaints have been outlined in Figure 2. Fever was the commonest symptom observed in both the waves. Symptoms like dry cough, sore throat, fatigue, muscle ache, weakness of limbs, loss of taste and loss of smell were less commonly reported in the second wave (Fig. 3).
Fig. 3.
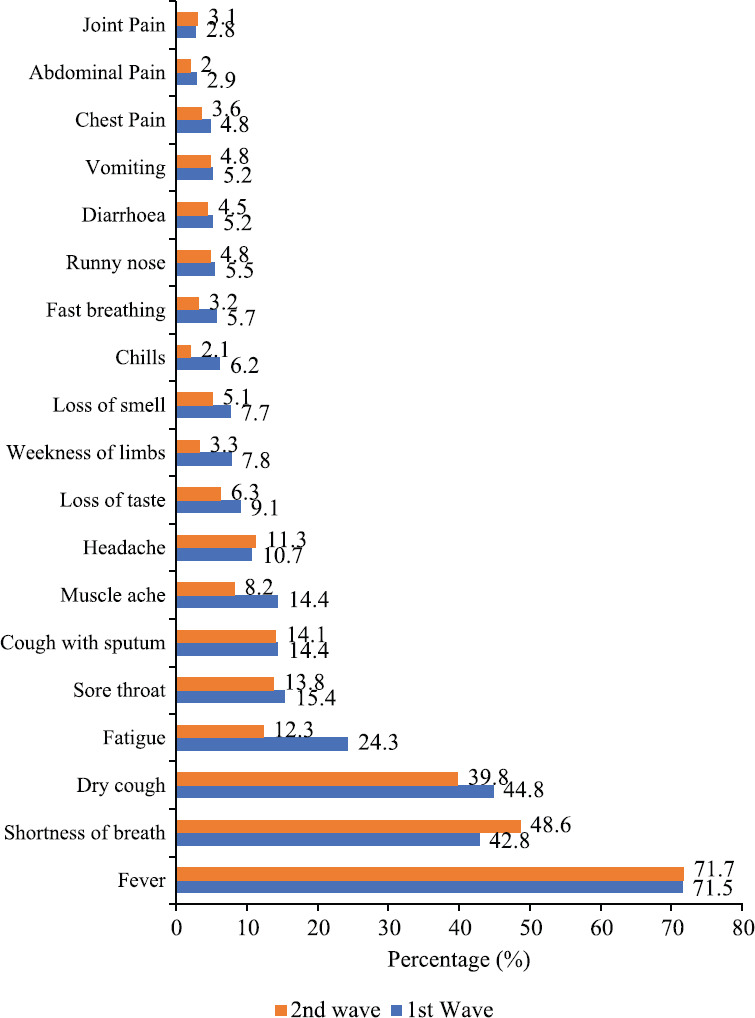
Comparison of the common presenting complaints in symptomatic patients during the 1st (n=10338) and 2nd wave (n=5404) of the pandemic.
Complications: As on May 11, 2021, complete dataset pertaining to outcome data were available for 14436 patients, of whom 11178 patients belonged to the first wave and 3258 patients to the second. When the records with complete outcome data were compared to those where outcome data were incomplete, it was noted that the patients with incomplete records had a lower mean age, shorter median duration of symptom before admission, and lesser proportion of comorbidities. Proportion of patients with complications decreased during the second wave, except for acute respiratory distress syndrome (ARDS), hyperglycaemia and septic shock (Table II).
Table II.
Complications and outcome seen among patients recruited during the first and second wave of pandemic in the NCRC
| Complications | Second wave (n=3258) | First wave (n=11,178) | P | OR (95% CI) |
|---|---|---|---|---|
| ARDS | 422 (13) | 880 (7.9) | <0.001 | |
| Hyperglycaemia | 247 (7.6) | 632 (5.7) | <0.001 | |
| Septic shock | 114 (3.5) | 272 (2.4) | 0.001 | |
| Acute kidney injury | 39 (1.2) | 215 (1.9) | 0.006 | |
| Hospital acquired pneumonia | 19 (0.6) | 72 (0.6) | 0.70 | |
| Anaemia | 32 (1.0) | 129 (1.2) | 0.41 | |
| Liver dysfunction | 11 (0.3) | 75 (0.7) | 0.03 | |
| Congestive heart failure | 13 (0.4) | 29 (0.3) | 0.19 | |
| DIC/DVT/PTE | 20 (0.6) | 33 (0.3) | 0.008 | |
| Stroke | 10 (0.3) | 15 (0.1) | 0.04 | |
| Meningitis | 2 (0.1) | 13 (0.1) | 0.39 | |
| Death* | 403 (13.3) | 1058 (10.2)# | <0.001 | 1.35 (1.19-1.52) |
| Discharged | 2636 (86.8) | 9315 (89.8) | ||
| Death in age categories (yr)* | ||||
| <20 (n=506) | 6 (4.7) | 23 (6.1)# | 0.54 | 0.75 (0.29-1.89) |
| 20-39 (n=3308) | 51 (6.5) | 87 (3.5)# | <0.001 | 1.92 (1.35-2.75) |
| 40-60 (n=5355) | 148 (12.1) | 380 (9.2)# | 0.003 | 1.36 (1.11-1.66) |
| >60 (n=4243) | 198 (22.2) | 568 (17)# | <0.001 | 1.39 (1.16-1.67) |
All values are expressed as n (%). Bonferroni correction applied for multiple comparisons of complications; P<0.004 (0.05/11) considered as significant. *The outcome of death or discharged was available for 13,412 records. Patients whose outcome was noted as left against medical advice or transferred were left out of the mortality analysis, n=1024; #The reference category. ARDS, acute respiratory distress syndrome; DIC, disseminated intravascular coagulopathy; DVT, deep venous thrombosis; PTE, pulmonary thrombo-embolism; OR, odds ratio; CI, confidence interval
Mortality: The outcome of death or discharged was analysed in 13412 records, leaving out the patients (n=1024) who were either transferred out or left the care facility against medical advice. The mortality among hospitalized patients increased by 3.1 per cent in the second wave (1058/10373 to 403/3039, P=<0.001). The increase in mortality was seen in all age groups except for <20 yr of age, where mortality was decreased (Table II). In the second wave, number of deaths in the patients >60 yr of age was 198/894. Taking >60 yr of age as the reference category, the odds of death in 0-19 yr was 0.17 (95% CI: 0.07, 0.41), in 20-39 yr was 0.24 (95% CI: 0.18, 0.34) and in 40-60 yr was 0.48 (95% CI: 0.38, 0.61).
Treatment and utilization of healthcare system: The overall usage of corticosteroids was similar in both waves [1st wave: 5896 (52.8%) vs. 2nd wave: 1727 (53%), P=0.79]. The steroids used were dexamethasone, methyl prednisolone, prednisolone and hydrocortisone. Dexamethasone usage increased in the second wave [1351 (41.5%) vs. 4340 (38.8%), P=0.007] whereas usage of methyl prednisolone decreased in the second wave [397 (12.2%) vs. 1558 (13.9%), P=0.01]. Tocilizumab was used in similar proportions in both the waves [1st wave: 116 (6.4%) vs. 2nd wave: 36 (5.9%), P=0.69]. The burden on healthcare system showed an upsurge as requirement of oxygen supplementation and need for mechanical ventilation increased significantly in the second wave. The median duration of hospital-stay decreased by one day in the second wave as compared to the first wave (Table III).
Table III.
Parameters of healthcare system utilization in the two waves of pandemic
| Characteristics | Second wave (n=3258) | First wave (n=11,178) | P |
|---|---|---|---|
| Requiring supplemental oxygen | 1637 (50.3) | 4771 (42.7) | <0.001 |
| Requiring mechanical ventilation among those requiring oxygen supplementation | 260 (15.9) | 530 (11.1) | <0.001 |
| Duration of hospital stay in days, median (IQR) | 6 (4-9) | 7 (5-10) | <0.001 |
| Duration of hospital stay in days in discharged patients, median (IQR) | 7 (5-9) | 8 (6-9) | <0.001 |
| Duration of hospital stay in days in deceased patients, median (IQR) | 6 (4-11) | 5 (2-9) | <0.001 |
Values are expressed as n (%) unless specified. IQR, interquartile range
Discussion
The current investigation presents a comparative analysis of the COVID-19 patients admitted during the two waves of SARS-CoV-2 pandemic using the data from the NCRC. Large number of patients included in the registry, which were representative of most regions of our country, was the main strength of this analysis. The data were collected in a meticulous, systematic manner with multiple rounds of verification.
The mean age of the admitted patients in the current investigation was lower in the second wave as compared to first. This small difference, though significant, might not be clinically important. The second and subsequent waves in other countries such as Germany, Japan, South Korea, and Iran have also reported a shift towards younger demography6,7,8,9. Considering the vaccination programme in our country was prioritized for high-risk groups such as frontline workers since January 16, 2021 and the geriatric population was vaccinated since March 1, 2021, the younger age-groups remained largely unvaccinated10,11. This could be one of the important reasons for the change in age pattern seen for hospitalized patients. Also, the restrictive measures becoming less stringent since the decline in cases from September 2020, with the younger ones stepping out for work, could have resulted in higher rate of infection. Hospitalization among younger ones might be a reflection of the early care-seeking behaviour prompted by the experiences of the first wave.
There has been an alteration in the clinical profile of admitted patients in the second wave with lesser proportion having comorbidities and higher proportion showing breathlessness. This has led to higher utilization of oxygen supplementation, mechanical ventilation and subsequently mortality. It is noteworthy that mortality of hospitalized patients (and not population-based case fatality rates) are discussed in this analysis. There could be multiple potential factors behind this phenomenon. The phenomenon of ‘silent hypoxemia’ reported in COVID-19, where patients with hypoxia do not show corroborating signs of breathlessness, may have led to patients reaching healthcare facilities with more severe disease12. The circulating variants in the second wave of COVID-19, B.1.1.7 and B.1.617 have been debated to be more transmissible as well as more virulent13. More importantly, the explosive nature of the second wave led to a large number of people being affected within a short span of time. This has put the health infrastructure under pressure, making hospitalization possible for only more severe patients, which could also explain the higher mortality among the hospitalized patients. A retrospective Indian study from 10 private tertiary care hospitals in north India has also shown an increase in mortality in the in-patients in the second wave as compared to the first wave14. In comparison, our investigation covered both public and private institutes from different regions of the country, however, the trends in supplemental oxygen utilization, need for mechanical ventilation, and mortality were similar. Other countries have demonstrated varied pattern in terms of mortality in subsequent waves of COVID-19 pandemic. Reports from Japan, and Iran suggest lower mortality in the subsequent waves; whereas, countries like Germany and South Korea have reported higher case fatality rate in the successive waves6,7,8,9.
The decrease in the duration from symptom onset to admission, and duration of hospital stay suggested that patients might be having a shorter and more aggressive disease, and also the general understanding and approach of the treating physicians about the disease had improved over time. The patients who recovered and were discharged had a longer stay in the hospital as compared to the deceased in both the waves. When compared to the first wave, the discharged patients had a shorter length of stay (LOS) in the second wave, whereas the deceased had a longer LOS in the second wave. The complicated and severe nature of the disease in the deceased patients might have dictated the longer LOS. The increase in septic shock among patients underlines the importance of strict infection control practices among COVID-19 patients and also the need of appropriate use of steroids. The increase in hyperglycemia in the second wave also points towards the need for judicious use of drugs like corticosteroids. It was worthwhile to note that corticosteroid was used in hospitalized, hypoxic patients even before the publication of the landmark REVOVERY trial results15.
An increase in non-respiratory symptoms like diarrhoea and vomiting was seen in some of the other countries16. However, our data did not reflect any such development. Fever and respiratory symptoms remained the commonest presenting features for admission. The differences noted in clinical presentation, access to health care, response to treatment, rate of complications and case fatality between the first and second waves of the pandemic in this investigation might have been affected by local, State-wise and region-wise variations in policies and strategies regarding COVID-19 testing and hospitalization.
There were some limitations of the present investigation. The registry did not capture the initial phase of the first wave as data collection commenced since September 1, 2020. There has been a considerable lag in obtaining a complete dataset due to time required for data verification and the unprecedented workload of the healthcare team involved in COVID-19 care. Hence, the outcome data were not available for many cases from the second wave. Though the data were submitted from more than 40 hospitals across the country to the NCRC, data from some States like Maharashtra and Kerala were missing due to logistic reasons, thus constraining the national representation. Rapid and explosive spread of SARS-CoV-2 infection during the second wave of pandemic in India resulting in huge caseload on the entire healthcare system of the country including the participating institutes, did not allow enrolling all in-patients in our registry. All these factors led to incomplete registration and enrolment (participation) bias which was unavoidable in this real-world investigation platform. The differing recruitment rate might have influenced some of the inferences, which is also one of the limitations of the current investigations. Though the necessity of collecting data on detailed socio-economic and behavioural information is appreciated, the present study design does not allow us to do so.
In conclusion, the second wave that is being experienced in our country seem to be slightly different in presentation than the first wave. Besides the steep rise of the cases, there has been more involvement of the younger demography. However, the elderly above 60 yr of age remained the most vulnerable. The symptomatology has remained focussed primarily on respiratory system with breathlessness reported in higher proportions during the second wave of COVID-19 in India. Higher utilization of health care systems has underlined the need for meticulous pandemic preparedness for future surges.
Footnotes
Financial support & sponsorship: The National Clinical Registry for COVID-19 was funded by the Indian Council of Medical Research, New Delhi.
Conflicts of Interest: None.
References
- 1.He D, Dushoff J, Day T, Ma J, Earn DJ. Inferring the causes of the three waves of the 1918 influenza pandemic in England and Wales. Proc Biol Sci. 2013;280:20131345. doi: 10.1098/rspb.2013.1345. [DOI] [PMC free article] [PubMed] [Google Scholar]
- 2.Andrews MA, Arcekal B, Rajesh KR, Krishna J, Suryakala R, Krishnan B, et al. First confirmed case of COVID-19 infection in India: A case report. Indian J Med Res. 2020;151:490–2. doi: 10.4103/ijmr.IJMR_2131_20. [DOI] [PMC free article] [PubMed] [Google Scholar]
- 3.Ministry of Health and Family Welfare |Home. [accessed on May 30, 2021]. Available from: https://www.mohfw.gov.in/
- 4.India COVID: 27,369,093 Cases and 315,263 Deaths - Worldometer. [accessed on May 27, 2021]. Available from: https://www.worldometers.info/coronavirus/country/india/
- 5.Ranjan R, Sharma A, Verma MK. Characterization of the second wave of COVID-19 in India. medRxiv. 2021 doi: https://doi.org/10.1101/2021.04.17.21255665. [Google Scholar]
- 6.Jalali SF, Ghassemzadeh M, Mouodi S, Javanian M, Akbari Kani M, Ghadimi R, et al. Epidemiologic comparison of the first and second waves of coronavirus disease in Babol, North of Iran. Caspian J Intern Med. 2020;11(Suppl 1):544–50. doi: 10.22088/cjim.11.0.544. [DOI] [PMC free article] [PubMed] [Google Scholar]
- 7.Graichen H. What is the difference between the first and the second/third wave of Covid-19? – German perspective. J Orthop. 2021;24:A1–3. doi: 10.1016/j.jor.2021.01.011. [DOI] [PMC free article] [PubMed] [Google Scholar]
- 8.Seong H, Hyun HJ, Yun JG, Noh JY, Cheong HJ, Kim WJ, et al. Comparison of the second and third waves of the COVID-19 pandemic in South Korea: Importance of early public health intervention. Int J Infect Dis. 2021;104:742–5. doi: 10.1016/j.ijid.2021.02.004. [DOI] [PMC free article] [PubMed] [Google Scholar]
- 9.Saito S, Asai Y, Matsunaga N, Hayakawa K, Terada M, Ohtsu H, et al. First and second COVID-19 waves in Japan: A comparison of disease severity and characteristics. J Infect. 2021;82:84–123. doi: 10.1016/j.jinf.2020.10.033. [DOI] [PMC free article] [PubMed] [Google Scholar]
- 10.The World's Largest COVID-19 Vaccination Campaign - The Lancet Infectious Diseases. [accessed on May 30, 2021]. Available from: https://www.thelancet.com/journals/laninf/article/PIIS1473-3099(21)00081-5/fulltext .
- 11.Day 45- Next Phase of COVID-19 Vaccination Commences. [accessed on May 30, 2021]. Available from: http://www.pib.gov.in/Pressreleaseshare.aspx?PRID=1701807 .
- 12.Tobin MJ, Laghi F, Jubran A. Why COVID-19 silent hypoxemia is baffling to physicians. Am J Respir Crit Care Med. 2020;202:356–60. doi: 10.1164/rccm.202006-2157CP. [DOI] [PMC free article] [PubMed] [Google Scholar]
- 13.Indian SARS-CoV-2 Genomic Consortia (INSACOG) Key Aspects May 6, 2021. [accessed on May 27, 2021]. Available from: http://dbtindia.gov.in/sites/default/files/INSACOG%20Key%20Aspects%20May% 206%202021.pdf .
- 14.Budhiraja S, Indrayan A, Mona A, Jha V, Jain D, Tarai B, et al. Differentials in the characteristics of COVID-19 cases in Wave-1 and Wave-2 admitted to a network of hospitals in North India. medRxiv. 2021 doi: https://doi.org/10.1101/2021.06.24.21259438. [Google Scholar]
- 15.RECOVERY Collaborative Group, Horby P, Lim WS, Emberson JR, Mafham M, Bell JL, et al. Dexamethasone in hospitalized patients with Covid-19. N Engl J Med. 2021;384:693–704. doi: 10.1056/NEJMoa2021436. [DOI] [PMC free article] [PubMed] [Google Scholar]
- 16.Elshazli RM, Kline A, Elgaml A, Aboutaleb MH, Salim MM, Omar M, et al. Gastroenterology manifestations and COVID-19 outcomes: A meta-analysis of 25,252 cohorts among the first and second waves. J Med Virol. 2021;93:2740–68. doi: 10.1002/jmv.26836. [DOI] [PMC free article] [PubMed] [Google Scholar]