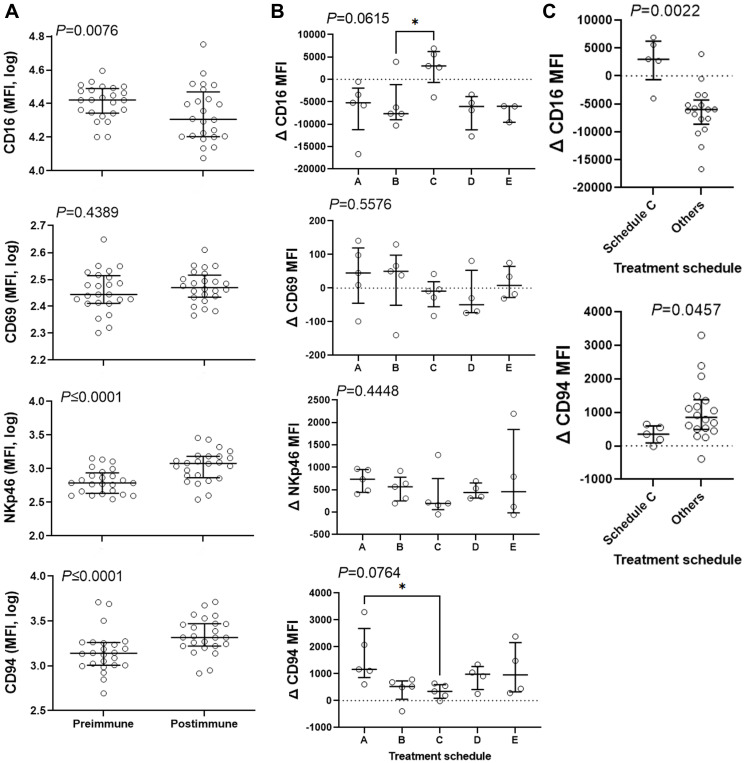
Figure 2. Combination therapy affects expression of NK-cell markers.
CD3-negative CD56-positive population was gated and the expression levels of CD16, CD69, NKp46, and CD94 was determined. (A) Median Fluorescence Intensity (MFI) for these markers was measured in pre and postimmune samples and was plotted for 23 subjects. Data were analyzed with 2-sided paired Wilcoxon’s signed-rank test. (B and C) The effect of treatment schedule (the timing of administration of the vaccine relative to chemotherapy) on the therapy-induced change in the expression levels of the above markers was analyzed. Data were analyzed with Kruskal-Wallis (B) or 2-sided Mann-Whitney (C) tests. Kruskal-Wallis test was followed by Dunn’s multiple comparisons test comparing schedule C with other schedules. Bars show median and interquartile range. *, significant at P ≤ 0.05.

