

Abstract
Background:
Inflammation plays an important role in the development of cardiovascular disease, including atherosclerosis and arrhythmia. The aim of this study was to evaluate atrial conduction times (ACTs) in patients with inflammatory bowel disease (IBD) in which systemic chronic inflammation is evident.
Methods:
In this cross-sectional, prospective, single-center study, 79 IBD patients (51 ulcerative colitis; 28 Crohn's disease) and 70 healthy controls were included. Atrial electromechanical properties were measured by recording simultaneous surface electrocardiography (ECG) with transthoracic echocardiography (ECHO) and tissue Doppler imaging methods. The relationship between age, disease duration, and ACT was evaluated.
Results:
There were significantly increased conduction durations of lateral-PA (time interval from the onset of the P-wave on surface ECG to the beginning of the late diastolic wave), septal-PA, tricuspid-PA, and interatrial–electromechanical delay (IA-EMD), right intraatrial EMD, and left intraatrial (LI-EMD) durations in IBD patients (P < 0.001). In IBD patients, there was a positive correlation with age, lateral PA, septal PA, tricuspid PA, IA-EMD, and LI-EMD (P < 0.05). A positive correlation was found between disease duration and only lateral PA and tricuspid PA (P < 0.05).
Conclusion:
In IBD patients, prolonged ACT consists a potential risk for severe atrial arrhythmias. ECG and ECHO screening can be useful in identifying risk groups in IBD patients and taking precautions for future cardiac complications.
Keywords: Crohn disease, electrocardiography, heart rate, ulcerative colitis
INTRODUCTION
Inflammatory bowel disease (IBD) is a systemic chronic inflammatory disease consisting of ulcerative colitis (UC) and Crohn's disease (CD), with an increasing incidence and prevalence worldwide, involving the gastrointestinal system.[1] In IBD, there is an incremental risk of cardiovascular diseases, such as early atherosclerosis, myocardial infarction, and stroke, characterized by an increase in carotid intima-media thickness.[2,3] High-serum C-reactive protein (CRP) level is the most important marker indicating the severity of inflammation and activation of the disease in IBD patients, and it is also associated with atherogenesis and atherosclerotic heart disease.[3]
Atrial fibrillation (AF) is one of the most common cardiac arrhythmias associated with a significant increase in mortality and morbidity risk from stroke.[4] Recently, inflammation has been shown as a pathogenic factor contributing to the development of AF.[5] The relationship between inflammation and AF is not completely understood; however, atrial myocarditis that develops as a result of infiltration of the atrial wall with inflammatory cells is thought to be an etiologic factor.[6] As a result, inflammatory mechanisms play a major role in both IBD and atherosclerosis. This information suggests the possibility of an increase in the frequency of AF in which inflammation plays a role in IBD (a chronic inflammatory disease with activation and remissions) patients compared to healthy controls.
If it is thought that AF can be diagnosed with fatal complications such as stroke, it will be essential to predict the disease in advance and prevent complications.[7] It may be a rational approach to evaluate atrial conduction times (ACTs) to determine the risk before arrhythmia develops.
Tissue Doppler imaging (TDI) is a noninvasive echocardiographic (ECHO) technique that provides quantitative evaluation of myocardial tissue velocities. Recently, determination of total ACT with TDI using transthoracic ECHO has been shown as a safe predictor of new-onset and recurrent AF.[8]
In this study, it was aimed to investigate the association between IBD and ACTs.
PATIENTS AND METHODS
Ethical issues
The study was approved by the Clinical Research Ethics Committee of the institution (No: 115, Decision number: 2019/50, Dated: March 07, 2019). Informed consent of all patients was obtained.
Study population
Between April 2019 and October 2019, UC and CD patients over 18-years-old who were followed in the gastroenterology clinic of the institution and diagnosed for at least 1 year were included in the study. Personal data, medical history, and clinical information about IBD of the patients were scanned and recorded from the hospital's online data system and patient files. The diagnosis of IBD was made clinically, endoscopically, radiologically, and histologically. To evaluate activity and remission status in IBD patients, Partial Mayo Score was used for UC[9] and Harvey–Bradshaw Index for CD[10]; patients who were clinically in remission according to these criteria were included in the study.
Patients with known cardiovascular and thyroid disease, history of malignancy and chronic alcohol use, diabetes mellitus (normal tolerance test with fasting serum glucose and 75 g of glucose), hypertension (blood pressure above 140/90 mmHg, receiving antihypertensive treatment or history of hypertension), hyperlipidemia, and a history of chronic kidney disease were excluded from the study. Additionally, all patients and the control group were questioned at least 3 months before enrollment in the study in terms of using glucocorticoids, antidiabetic, estrogenic and androgenic, antihypertensive, and drugs affecting the atrial conduction system (such as beta blockers and calcium channel blockers); patients using medication were excluded from the study.
The control group was defined by matched volunteers according to age, gender, and smoking, and the following criteria: (1) those who did not have any known chronic disease and cardiac pathology, (2) not using drugs affecting the heart, and (3) who were evaluated by electrocardiography (ECG) and ECHO.
The study group was evaluated with a complete physical examination, 12-lead ECG, standard transthoracic ECHO, and TDI. Body mass index (BMI) was calculated by dividing weight by the square of height (BMI = weight/height2; kg/m2).
ECG analysis
Twelve-lead ECG recordings were obtained on paper with each patient in the supine position at a size of 10 mm/Mv and a speed of 50 mm/s.[11] CardioLab v. 6.0 General Electric Medical SystemsTM was used for ECG recordings and measurements. ECGs were analyzed by two experts (cardiologist) without having any knowledge of the patients' clinical conditions.
Laboratory parameters
Fasting blood glucose, CRP, erythrocyte sedimentation rate (ESR), creatinine, aspartate aminotransferase (AST), and alanine aminotransferase were measured by standard procedures from blood samples taken after overnight fasting. In both groups, systolic blood pressure (SBP), diastolic blood pressure (DBP), and heart rates were measured three times on the right arm in the sitting position after resting for 10 min, and the mean value was determined.
Echocardiographic and Doppler measurements
Echocardiographic examinations were performed with a 2.5 MHz phased array transducer (Vivid 9 Pro, GE Vingmed, Milwaukee, Wisconsin, USA), while the patient was at rest in the left lateral decubitus position, by a blinded single cardiologist in terms of clinical status. ECHO measurements were made during single-lead ECHO recording. In accordance with the recommendations of the American Society of Echocardiography, all conventional measurements (ejection fraction, EF; left ventricular end systolic diameter, LV-ESD; left ventricular end diastolic diameter, LV-EDD; interventricular septum thickness, IVS; posterior wall thickness, PW; aortic root diameter, AR; ascending aortic root diameter, AAR; and left atrium diameter, LA) were performed on the parasternal long-axis and apical four-chamber views. LV-EF was calculated by Simpson's method.[12]
Transmitral pulsed-wave flow velocities were measured by using the apical four-chamber method from the area between the ends of the mitral leaflets with a Doppler device. Early (E) and late (A) diastolic peak flow velocities and their ratio (E/A) were measured. All Doppler sonographic measurements were made by evaluating the average of three consecutive cardiac cycles. When the E/A ratio was between 0.9 and 1.5, the diastolic function was considered as normal.
Tissue Doppler imaging
TDI imaging technique was used to measure atrial electromechanical association. TDI provides analysis of high amplitude and low-speed movements of the myocardium from different regions of the heart, with high temporal resolution. The sample volume width is kept in the range of 2–5 mm in order to achieve high temporal resolution. Due to the low myocardial velocities, measurements were done when Nyquist limits were between –20 and +20 cm/s; the monitor speed was between 50 and 100 mm/s. When pulsed Doppler sample volume was on the apical four-chamber view axis, it was placed in the left ventricle lateral mitral annulus, septal mitral annulus, and right ventricle tricuspid annulus. The sampled window was positioned as parallel as possible to the myocardial area from which an optimal view was desired. Interatrial and intraatrial electromechanical delay (EMD) durations were determined using TDI and ECG tracing simultaneously. The time between the onset of the P wave on the ECG and the peak of the tissue Doppler late systolic wave was defined as the atrial electromechanical union (PA) time. Interatrial EMD (IA-EMD) was calculated as the time difference between lateral PA and tricuspid PA. The time difference between septal PA and tricuspid PA was calculated as intraright atrial EMD (RI-EMD) and the time difference between lateral PA and septal PA was calculated as intra-left-EMD (LI-EMD).
Statistical analysis
Numerical variables were expressed as mean ± standard deviation and median (min–max), and categorical variables as percentages. Kolmogorov–Smirnov test was used to determine normal distribution. Statistical analysis was performed using Student's t-test in the case of normal distribution of values and using the Mann–Whitney U-test in cases that did not comply with the normal distribution. Spearman correlation analysis was used to evaluate the relationship between electromechanical and clinical parameters. A P value of less than 0.05 was considered statistically significant.
RESULTS
There was no statistically significant difference between the control and IBD groups in terms of age and gender distribution (36.6 ± 8.17 vs 37.7 ± 11.01; P > 0.05). Compared to the control group, although DBP, fasting blood glucose, ESR, CRP, and AST values were clinically in normal ranges, it was statistically significantly higher, and creatinine levels were found significantly lower (all, P < 0.05). Although DBP, fasting blood glucose, ESR, CRP in patients with CD and DBP, ESR and AST in UC patients were in normal ranges, it was found to be significantly higher than the control group (all, P < 0.05). Smoking and creatinine were significantly lower in UC patients than in the control group (P = 0.021, P < 0.0001, respectively). Smoking and creatinine levels were significantly higher in patients with CD than in UC patients (P = 0.018, P < 0.001, respectively). Clinical, laboratory, and demographic data are summarized in Table 1.
Table 1.
Clinical, laboratory, and demographic data of the study population
| Variables | Control (n=70) | IBD (n=79) | P | CD (n=28) | P | UC (n=51) | P |
|---|---|---|---|---|---|---|---|
| Age (years)* | 36.6±8.2 | 37.7±11.0 | 0.464a | 39.1±12.1 | 0.327a | 37.0±10.4 | 0.796a |
| Gender n (%) | |||||||
| Male | 38 (54.3) | 46 (58.2) | 0.628b | 20 (71.4) | 0.119b | 26 (51) | 0.719b |
| Female | 32 (45.7) | 33 (41.8) | 8 (28.6) | 25 (49) | |||
| SBP (mm/Hg)* | 127.1±11.5 | 129.0±9.3 | 0.251a | 130.7±10.3 | 0.145a | 128.1±8.7 | 0.590a |
| DBP (mm/Hg)** | 75 (64–83) | 78 (66–100) | 0.0001 c | 79 (66–100) | 0.004c | 78 (66–96) | 0.0001c |
| Smoking (n%) | 21 (35) | 24 (30.4) | 0.564b | 16 (57.1) | 0.084b | 8 (15.7) | 0.021b |
| BMI (kg/m2)** | 24.8 (16.5–36.7) | 24.8 (16.1–42.5) | 0.072c | 24.9 (16.0–30.7) | 0.070c | 24 (18.4–42.5) | 0.202c |
| Illness duration (years)** | - | 4 (1–20) | - | 4 (1–17) | - | 4 (1–20) | - |
| Fasting glucose (mg/dL)* | 90.04±8.69 | 93.49±9.99 | 0.033a | 96.17±9.58 | 0.005a | 92.09±10.03 | 0.251a |
| ESR (mm/h)** | 6 (1–15) | 11.5 (1–32) | 0.0001c | 14 (1–32) | 0.005c | 11 (2–31) | 0.0001c |
| CRP (mg/L)** | 0.6 (0.1–8.0) | 1.1 (0.1–16.0) | 0.024c | 1.4 (0.1–6.3) | 0.047c | 1.0 (0.1–16.0) | 0.081c |
| Creatinine (mg/dL)** | 0.9 (0.6–1.3) | 0.8 (0.5–1.3) | 0.0001c | 0.8 (0.7–1.1) | 0.065c | 0.7 (0.5–1.3) | 0.0001c |
| AST (U/L)* | 16.4±5.7 | 19.1±6.2 | 0.006a | 18.7±5.0 | 0.068a | 19.4±6.8 | 0.011a |
| ALT (U/L)* | 16.8±8.1 | 19.3±12.3 | 0.144a | 17.7±7.7 | 0.615a | 20.3±14.3 | 0.135a |
aThe independent sample-t test, bChi-square analysis, cMann–Whitney U-test, * mean±SD, and ** median (min–max). BMI: body mass index, CD: Crohn’s disease, UC: ulcerative colitis, IBD: inflammatory bowel disease, SBP: systolic blood pressure, DBP: diastolic blood pressure, ESR: erythrocyte sedimentation rate, CRP: C-reactive protein, ALT: alanine aminotransferase, and AST: aspartate aminotransferase. Only creatinine and smoking are significantly higher in the patients with CD than UC, in a comparison of the parameters between CD and UC (P<0.001 and P=0.018, respectively). P values less than 0.05 are specified in bold characters
PW, EF, and LV diameters were found to be significantly higher in the UC group compared to the control group (P = 0.027, P = 0.02, P = 0.003, respectively). LV diameter was found to be significantly higher in IBD and CD compared to the control group (P = 0.001, P = 0.005, respectively). There was no significant difference between the groups in terms of other ECHO measurements [Table 2].
Table 2.
Comparison of echocardiographic measurements in the study population
| Variables | Control n (70) | IBD n (79) | (P) | CD n (28) | (P) | UC n (51) | (P) |
|---|---|---|---|---|---|---|---|
| LV-EF (%) | 62.2±3.1 | 61.2±2.9 | 0.053 | 61.9±2.8 | 0.643 | 60.8±3.0 | 0.020 |
| PW thickness (mm) | 0.83±0.09 | 0.89±0.25 | 0.065 | 0.85±0.10 | 0.603 | 0.92±0.30 | 0.027 |
| IVS thickness (mm) | 0.88±0.09 | 0.98±0.47 | 0.084 | 0.98±0.41 | 0.219 | 0.99±0.51 | 0.105 |
| LA (cm)* | 3.20 (2.80–3.70) | 3.40 (2.80–4.10) | 0.001 | 3.45 (2.80–4.00) | 0.005 | 3.37±0.35 | 0.003 |
| AR (cm) | 3.17±0.24 | 3.19±0.39 | 0.717 | 3.10±0.51 | 0.365 | 3.24±0.29 | 0.167 |
| AAR (cm) | 3.19±0.21 | 3.25±0.25 | 0.109 | 3.23±0.24 | 0.394 | 3.26±0.26 | 0.092 |
| LV-EDD (mm) | 4.67±0.38 | 4.66±0.27 | 0.788 | 4.62±0.26 | 0.474 | 4.68±0.28 | 0.894 |
| LV-ESD (mm) | 2.81±0.28 | 2.84±0.20 | 0.408 | 2.82±0.22 | 0.791 | 2.85±0.19 | 0.316 |
| Mitral E velocity (cm/s) | 0.74±0.18 | 0.72±0.13 | 0.410 | 0.71±0.12 | 0.428 | 0.72±0.13 | 0.572 |
| Mitral A velocity (cm/s) | 0.64±0.11 | 0.63±0.15 | 0.801 | 0.63±0.16 | 0.878 | 0.63±0.15 | 0.820 |
| E/A | 1.19±0.30 | 1.22±0.39 | 0.552 | 1.21±0.39 | 0.797 | 1.23±0.39 | 0.538 |
* Data are presented as median (min–max) and Mann–Whitney U-test is used. Other parameters are presented as mean±SD and independent Student’s t test is used. CD: Crohn’s disease, UC: ulcerative colitis, IBD: inflammatory bowel disease, LV-EF: left ventricular ejection fraction, PW: posterior wall, IVS: interventricular septum, LA: left atrium dimension, AR: aortic root diameter, AAR: ascending aortic root diameter, LV-ESD: left ventricular end-systolic dimension, and LV-EDD: left ventricular end-diastolic dimension. Any significant results cannot find at the comparison of the parameters between CD and UC. P values less than 0.05 are specified in bold characters
Lateral PA, septal PA, tricuspid PA, IA-EMD, RI-EMD, and LI-EMD durations were significantly higher in IBD, CD, and UC patients compared to the control group (all, P < 0.001). Statistical analysis in terms of electrocardiographic and atrial electromechanical parameters is summarized in Table 3.
Table 3.
Comparison of electrocardiographic and atrial electromechanical parameters
| Variables | Control n (70) | IBD n (79) | (P)* | CD n (28) | (P)* | UC n (51) | (P)* |
|---|---|---|---|---|---|---|---|
| HR (beat/min) | 70 (54–88) | 72 (55–100) | 0.067 | 74 (56–100) | 0.098 | 72 (55–96) | 0.155 |
| Lateral-PA (ms) | 86.5 (76–104) | 108 (85–122) | 0.0001 | 109 (98–118) | 0.0001 | 108 (85–122) | 0.0001 |
| Septal-PA (ms) | 80 (70–87) | 96 (85–108) | 0.0001 | 98 (85–108) | 0.0001 | 95 (88–106) | 0.0001 |
| Tricuspid-PA (ms) | 70 (60–76) | 82 (74–92) | 0.0001 | 83 (78–92) | 0.0001 | 82 (74–92) | 0.0001 |
| IA-EMD (ms) | 16 (6–31) | 25 (5–36) | 0.0001 | 24 (18–36) | 0.0001 | 25 (5–34) | 0.0001 |
| RI-EMD (ms) | 8 (0–16) | 13 (4–20) | 0.0001 | 14 (7–20) | 0.0001 | 13 (4–20) | 0.0001 |
| LI-EMD (ms) | 7 (3–24) | 11 (-3–20) | 0.0001 | 10 (6–19) | 0.0001 | 12 (-3–20) | 0.0001 |
* Data are presented as median (min–max) and Mann–Whitney U-test is used. CD: Crohn’s disease, UC: ulcerative colitis, IBD: inflammatory bowel disease, HR: heart rate, PA: time interval from the onset of the P-wave on surface electrocardiogram to the beginning of the late diastolic wave, IA-EMD: interatrial electromechanical delay, RI-EMD: right intraatrial electromechanical delay, and LI-EMD: left intraatrial electromechanical delay. No significant differences were found in the comparison of the parameters between CD and UC. P values less than 0.05 are specified in bold letters
In the correlation analysis between age and ECHO and atrial electromechanical measurements in IBD patients, there was a slight negative correlation between LV-EF and age (r = -0.282, P = 0.012); a moderate positive correlation between PW thickness, IVS thickness, AR diameter, AAR diameter, LV-ESD and LV-EDD, mitral A velocity, lateral PA, septal PA, tricuspid PA, and IA-EMD (all P values < 0.001; r = 0.602, 0.693, 0.540, 0.537, 0.616, 0.606, 0.683, 0.566, 0.471, 0.455, respectively, and P = 0.00, r = 0.362); a slightly positive correlation with LI-EMD (r = 0.271, P = 0.016), mitral E velocity; a moderate negative correlation with E/A ratio (r = -0.453, P < 0.001; r = 0.676, P < 0.001, respectively); and a strong positive correlation with left atrium diameter (r = 0.797, P < 0.001) [Table 4 and Figures 1-3].
Table 4.
Correlation between age and illness duration with echocardiographic findings and electromechanical measurements
| Variables | Control n (70) |
IBD n (79) |
||||
|---|---|---|---|---|---|---|
| (r)a | (P)a | (r)a | (P)a | (r)b | (P)b | |
| Age; illness duration (years) | ||||||
| LV-EF (%) | 0.079 | 0.516 | -0.282 | 0.012 | -0.034 | 0.769 |
| PW thickness (mm) | 0.123 | 0.312 | 0.602 | 0.0001 | 0.148 | 0.192 |
| IVS thickness (mm) | 0.041 | 0.736 | 0.693 | 0.0001 | 0.252 | 0.025 |
| LA (cm) | 0.221 | 0.065 | 0.797 | 0.0001 | 0.285 | 0.011 |
| AR (cm) | -0.070 | 0.567 | 0.540 | 0.0001 | 0.044 | 0.698 |
| AAR (cm) | -0.062 | 0.609 | 0.537 | 0.0001 | 0.057 | 0.631 |
| LV-EDD (mm) | 0.118 | 0.330 | 0.616 | 0.0001 | 0.180 | 0.113 |
| LV-ESD (mm) | 0.047 | 0.697 | 0.606 | 0.0001 | 0.203 | 0.072 |
| Mitral E velocity (cm/s) | 0.154 | 0.202 | -0.453 | 0.0001 | -0.171 | 0.132 |
| Mitral A velocity (cm/s) | -0.138 | 0.253 | 0.683 | 0.0001 | 0.206 | 0.068 |
| E/A | 0.220 | 0.067 | -0.676 | 0.0001 | -0.180 | 0.112 |
| Lateral-PA (ms) | -0.131 | 0.279 | 0.566 | 0.0001 | 0.265 | 0.018 |
| Septal-PA (ms) | -0.203 | 0.093 | 0.471 | 0.0001 | 0.218 | 0.054 |
| Tricuspid-PA (ms) | -0.025 | 0.836 | 0.455 | 0.0001 | 0.337 | 0.002 |
| IA-EMD (ms) | -0.116 | 0.339 | 0.362 | 0.001 | 0.055 | 0.629 |
| RI-EMD (ms) | -0.235 | 0.050 | 0.154 | 0.175 | -0.068 | 0.552 |
| LI-EMD (ms) | 0.032 | 0.790 | 0.271 | 0.016 | 0.127 | 0.264 |
The spearman correlation analysis is used. LV-EF: left ventricular ejection fraction, PW: posterior wall, IVS: interventricular septum, LA: left atrium dimension, AR: aortic root diameter, AAR: ascending aortic root diameter, LV-ESD: left ventricular end-systolic dimension, LV-EDD: left ventricular end-diastolic dimension, IBD: inflammatory bowel disease, HR: heart rate, PA: time interval from the onset of the P-wave on surface electrocardiogram to the beginning of the late diastolic wave, IA-EMD: interatrial electromechanical delay, RI-EMD: right intraatrial electromechanical delay, and LI-EMD: left intraatrial electromechanical delay. P values less than 0.05 are specified in bold characters. "a" represents Age and "b" represents illness duration
Figure 1.
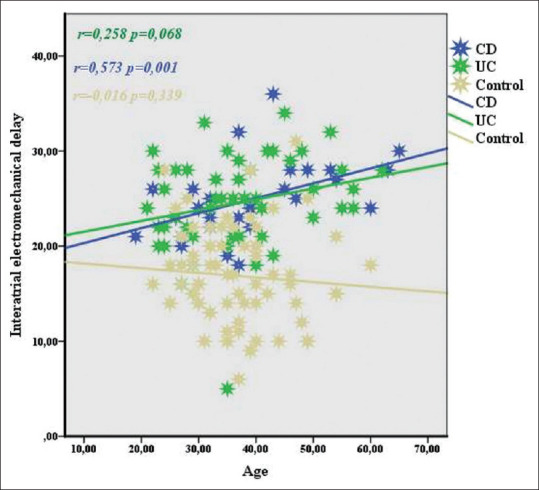
Correlation between interatrial electromechanical delay and age in IBD, UC and CD
Figure 3.

Correlation between right intra-atrial electromechanical delay and age in IBD, UC and CD
Figure 2.

Correlation between left intra-atrial electromechanical delay and age in IBD, UC and CD
In the correlation analysis between disease duration and ECHO and atrial electromechanical measurements in IBD patients, there was a weak positive correlation between disease duration and IVS thickness, LV diameter, lateral PA (r = 0.252, P = 0.025, r = 0.285, P = 0.011; r = 0.265, P = 0.018, respectively.), and a moderate positive correlation was found with tricuspid PA (r = 0.337, P = 0.002) [Table 4].
DISCUSSION
Studies on the cardiac effects of inflammation in many autoimmune diseases accompanied by inflammation and atherosclerosis seem to be intriguing. Studies investigating the effect of inflammation on atherosclerosis and cardiac arrhythmias are also of particular importance in IBD, in which the prevalence is increasing all over the world, especially in Western countries.
In a national-based study evaluating the role of inflammation in the development of AF involving approximately 10 times the healthy control group and enrolling 24,499 IBD patients, it was found that while there is an increase in the risk of AF and stroke in IBD patients in active period, there was no increased risk in remission patients compared to the control group.[13]
In the current study, it was determined that interatrial and intraatrial conduction durations were significantly increased in all IBD patients compared to the control group, in the same age group. In addition, LA width increased significantly compared to the control group. Although it was within normal limits only in UC patients, EF decreased and PW thickness increased compared to the control group. The obtained data show that in this process, in which inflammation plays an important role, not only the ACT but also the mechanical functions of the heart, especially the left atrium diameter, are negatively affected. Independently, increased left atrium diameter also has an effect on the risk of AF. In a population-based study using the national health insurance database in Korea, 348 of 37,696 IBD patients were newly diagnosed with AF during an average follow-up period of 4.9 ± 1.3 years. In this study, it was determined that patients with IBD have a high risk for the development of AF at a rate of 36% compared to the control group, which was approximately three times the number of patients with IBD.[14] In the same study, it was proven that patients with CD have a higher risk of developing AF than UC patients. Efe et al.[15] analyzed the delay in ACT with 52 IBD patients (25 actives, 27 in remission, and 26 healthy controls). According to the results of that study, it was found that the delay in remission and ACT increased significantly in active period IBD patients compared to healthy controls. In the same study, it was shown that the delay in ACT in IBD patients in remission increased compared to healthy controls. In another study involving 45 UC and 46 healthy controls, it was found that the delay in interatrial and right-intra-ACT increased in UC patients compared to healthy controls, and there was a significant decrease in the left atrium mechanical functions evaluated by ECHO in the UC group compared to the healthy control group. In this study, a weak–moderate positive correlation was found between the delay in ACTs and age and disease duration.[16] In our study, while a positive weak–moderate correlation was found between the delay in ACTs and age in patients with IBD, no relationship was found with the duration of the disease. One of the reasons for this difference may be due to activation and remission times differing from person to person. For example, while one of two different people with the same disease duration passes most of this period in remission, the other person may have more time with activation. This shows that the year of the disease does not determine the length of time individuals are exposed to the effects of inflammation. In a separate analysis of UC and CD in terms of age and delay in ACT, while no relationship was found in UC, a moderate positive correlation was found in CD patients [Figures 1-3]. The delay in the increased ACTs of CD supported the increased risk of AF development in patients with CD and UC, as determined in a study conducted in Korea.[14]
There are several limiting factors in our study. First, the relation of activation with the delay in ACT could not be evaluated, since the IBD group consisted of patients who were all in remission. Second, it has not been examined whether the drug treatments used by patients affect the delay in these transmission times. Third, the study population was relatively small.
CONCLUSION
This study showed that the delay in ACT increased in IBD. In addition, the delay in ACT increases with age. In this case, IBD patients may be at risk for cardiac arrhythmia and stroke, with advancing age. It is important to prevent complications that are difficult to treat before the disease develops. Therefore, necessary controls should be planned in IBD patients with ECG and ECHO, which are noninvasive and inexpensive methods.
Financial support and sponsorship
Nil.
Conflicts of interest
There are no conflicts of interest.
REFERENCES
- 1.Molodecky NA, Soon S, Rabi DM, Ghali WA, Ferris M, Chernoff G, et al. Increasing incidence and prevalence of the inflammatory bowel diseases with time, based on systematic review. Gastroenterology. 2012;142:46–54. doi: 10.1053/j.gastro.2011.10.001. [DOI] [PubMed] [Google Scholar]
- 2.Ekmen N, Can G, Yozgat A, Can H, Bayraktar MF, Demirkol ME, et al. Evaluation of epicardial adipose tissue and carotid intima-media thickness as a marker of atherosclerosis in patients with inflammatory bowel disease. Rev Esp Enferm Dig. 2021 doi: 10.17235/reed.2020.7394/2020. doi: 10.17235/reed.2020.7394/2020. [DOI] [PubMed] [Google Scholar]
- 3.Rungoe C, Basit S, Ranthe MF, Wohlfahrt J, Langholz E, Jess T. Risk of ischaemic heart disease in patients with inflammatory bowel disease: A nationwide Danish cohort study. Gut. 2013;62:689–94. doi: 10.1136/gutjnl-2012-303285. [DOI] [PubMed] [Google Scholar]
- 4.Libby P, Ridker PM, Hansson GK. Inflammation in atherosclerosis: From pathophysiology to practice. J Am Coll Cardiol. 2009;54:2129–38. doi: 10.1016/j.jacc.2009.09.009. [DOI] [PMC free article] [PubMed] [Google Scholar]
- 5.Aviles RJ, Martin DO, Apperson-Hansen C, Houghtaling PL, Rautaharju P, Kronmal RA, et al. Inflammation as a risk factor for atrial fibrillation. Circulation. 2003;108:3006–10. doi: 10.1161/01.CIR.0000103131.70301.4F. [DOI] [PubMed] [Google Scholar]
- 6.Issac TT, Dokainish H, Lakkis NM. Role of inflammation in initiation and perpetuation of atrial fibrillation: A systematic review of the published data. J Am Coll Cardiol. 2007;50:2021–8. doi: 10.1016/j.jacc.2007.06.054. [DOI] [PubMed] [Google Scholar]
- 7.Wolf P, Kannel W, McGee D, Meeks S, Bharucha N, McNamara P. Duration of atrial fibrillation and imminence of stroke: The Framingham study. Stroke. 1983;14:664–7. doi: 10.1161/01.str.14.5.664. [DOI] [PubMed] [Google Scholar]
- 8.Mueller P, Hars C, Schiedat F, Boesche LI, Gotzmann M, Strauch J, et al. Correlation between total ACT estimated via tissue Doppler imaging (PA-TDI interval), structural atrial remodeling and new-onset of atrial fibrillation after cardiac surgery. J Cardiovasc Electrophysiol. 2013;24:626–31. doi: 10.1111/jce.12084. [DOI] [PubMed] [Google Scholar]
- 9.Lewis JD, Chuai S, Nessel L, Lichtenstein GR, Aberra FN, Ellenberg JH. Use of the noninvasive components of the Mayo score to assess clinical response in ulcerative colitis. Inflamm Bowel Dis. 2008;14:1660–6. doi: 10.1002/ibd.20520. [DOI] [PMC free article] [PubMed] [Google Scholar]
- 10.Vermeire S, Schreiber S, Sandborn WJ, Dubois C, Rutgeerts P. Correlation between the Crohn's disease activity and Harvey–Bradshaw indices in assessing Crohn's disease severity. Clin Gastroenterol Hepatol. 2010;8:357–63. doi: 10.1016/j.cgh.2010.01.001. [DOI] [PubMed] [Google Scholar]
- 11.Usalp S, Kemal HS, Akpinar O, Cerit L, Duygu H. Does protein adding to diet affect sportsmen's cardiovascular system? Cukurova Med J. 2020;45:1428–35. [Google Scholar]
- 12.Mitchell C, Rahko PS, Blauwet LA, Canaday B, Finstuen JA, Foster MC, et al. Guidelines for performing a comprehensive transthoracic echocardiographic examination in adults: Recommendations from the American Society of Echocardiography. J Am Soc Echocardiogr. 2019;32:1–64. doi: 10.1016/j.echo.2018.06.004. [DOI] [PubMed] [Google Scholar]
- 13.Kristensen SL, Lindhardsen J, Ahlehoff O, Erichsen R, Lamberts M, Khalid U, et al. Increased risk of atrial fibrillation and stroke during active stages of inflammatory bowel disease: A nationwide study. Europace. 2014;16:477–84. doi: 10.1093/europace/eut312. [DOI] [PubMed] [Google Scholar]
- 14.Choi Y-J, Choi E-K, Han K-D, Park J, Moon I, Lee E, et al. Increased risk of atrial fibrillation in patients with inflammatory bowel disease: A nationwide population-based study. World J Gastroenterol. 2019;25:2788. doi: 10.3748/wjg.v25.i22.2788. [DOI] [PMC free article] [PubMed] [Google Scholar]
- 15.Efe TH, Cimen T, Ertem AG, Coskun Y, Bilgin M, Sahan HF, et al. Atrial electromechanical properties in inflammatory bowel disease. Echocardiography. 2016;33:1309–16. doi: 10.1111/echo.13261. [DOI] [PubMed] [Google Scholar]
- 16.Nar G, Ergul B, Aksan G, Inci S. Assessment of atrial electromechanical delay and left atrial mechanical functions in patients with ulcerative colitis. Echocardiography. 2016;33:970–6. doi: 10.1111/echo.13213. [DOI] [PubMed] [Google Scholar]