

Abstract
The pace of progress in biomedical research directly depends on techniques that enable the quantitative interrogation of interactions between proteins and other biopolymers, or with their small molecule ligands. Here, time-resolved Förster resonance energy transfer (TR-FRET) assay platforms offer high sensitivity and specificity. However, the paucity of accessible and biocompatible luminescent lanthanide complexes, which are essential reagents for TR-FRET-based approaches, and their poor cellular permeability has limited broader adaptation of TR-FRET beyond homogenous and extracellular assay applications. We here report the development of CoraFluors, a new class of macrotricyclic terbium complexes, which are synthetically readily accessible, stable in biological media, and exhibit photophysical and physicochemical properties desirable for biological studies. We validate the performance of CoraFluors in cell-free systems, identify cell-permeable analogs and demonstrate their utility in the quantitative domain-selective characterization of Keap1 ligands, as well as in isoform-selective target engagement profiling of HDAC1 inhibitors in live cells.
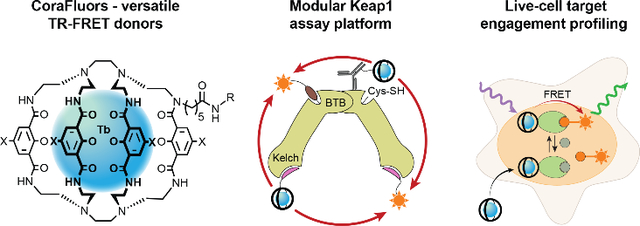
Graphical Abstract
Introduction
Fluorescence-based technologies are critical for life science research and clinical diagnostics. Most high-throughput assays are based on various modes of fluorescence detection due to their high sensitivity, large dynamic range, signal stability, variety of readily accessible fluorophores, and ease of operation1–3. Similarly, fluorescence-based microscopy techniques comprise arguably the most important imaging technology currently employed in biomedical research4. In recent years, the application of time-resolved (TR) fluorescence measurements has greatly improved the sensitivity of homogenous assays and high-resolution microscopy5–7. In particular, the combination of TR readouts with Förster resonance energy transfer (FRET) is attractive for studying biological processes on the molecular level2, 6, 8–13. In TR-FRET-based techniques, a signal is generated through FRET between a donor with a long luminescence lifetime and an acceptor fluorophore. The time-gated measurement allows for the virtual elimination of nonspecific background originating from scattered excitation light and autofluorescence of screening compounds, biological media, and assay plates; the FRET component limits the readout to acceptor molecules that are in immediate proximity of the donor6, 14–16. This approach therefore enables the quantitative measurement of interactions between biomolecules and/or small molecule ligands with high sensitivity and specificity.
Essential for the development of sensitive and robust TR-FRET-based chemogenomic applications is the availability of luminescent donors that satisfy the following criteria: 1) high stability in biological buffers, 2) sufficiently long luminescence lifetime compared to autofluorescence generated from biological samples, 3) good quantum yield and brightness, 4) insensitive to assay environment, and 5) scalability and costs. The favorable luminescent properties (long lifetimes, narrow luminescent bands, and large effective Stokes shifts) of lanthanide-based emitters, particularly terbium (Tb) and europium (Eu), make them uniquely attractive as TR-FRET donors9, 17, 18. While many luminescent lanthanide complexes have been reported, only a small number are compatible with biological assay conditions5, 9, 18. Few of these reagents are commercially available and those that are, are priced at a premium. The precise chemical structures of some of the commercial reagents are not disclosed and published structures generally require lengthy, inflexible, and difficult syntheses, which limits accessibility to these reagents and has hampered broader adaptation, particularly by academic labs. Furthermore, the generally poor membrane permeability renders most of these complexes unsuitable for studying intracellular targets in live cells and therefore has relegated their application primarily to homogenous assay platforms and assays for cell surface receptors19.
Among the commonly used TR-FRET donors, the octadentate tricyclic cryptate Lumi4-Tb™ (Fig. 1a) stands out with several favorable characteristics including good brightness, long luminescent lifetime, and broad compatibility with a wide variety of assay conditions compared to other lanthanide complexes20. However, high costs (~$500/μg) and a lengthy, challenging synthesis have limited access to this reagent class in the past, especially for experiments that require milligram quantities for further functionalization. Furthermore, the synthetic strategy poses challenges for the development of analogs with optimized photophysical and physicochemical properties, such as modulation of luminescent lifetimes for multiplexed applications, improved lipophilicity to enable cell permeability, and tuning of the absorbance spectrum to render analogs compatible with common microscopy equipment.
Figure 1. Chemical structures, photophysical and physicochemical characterization of representative CoraFluors.

a–d, Chemical structures of Lumi4™ ligand (Cisbio, PerkinElmer) (a), carboxylinker-modified ligands (1–3) and CoraFluors (4–6) (b), CoraFluors functionalized as HaloTag, SNAP-tag, and active ester derivatives (c), and linker-less core complexes 12–14 (d). e, Absorption and emission spectra for Cora-1-Halo (blue), Cora-2-Halo (orange), Cora-3-Halo (red) shown in comparison to 12 (black); absorbance maxima of halogenated CoraFluor analogs Cora-2-Halo and Cora-3-Halo are redshifted (λmax = 356 nm) compared to Cora-1-Halo and 12 (λmax = 340 nm). The emission spectra (solid green) are virtually identical for all complexes. f, Luminescence lifetime: all complexes display exponential decay with varying luminescence lifetimes (averaged signal of n = 50 independent measurements). g, Excitation/emission kinetics: complexes exhibit characteristically slow excitation rates when using LED excitation, with halogenated complexes displaying faster excitation kinetics and/or time to reach steady-state equilibrium (averaged signal of n = 10 independent measurements). h, Kinetic stability of Cora-½/3-Halo and 12 (5 nM) toward 1 mM EDTA in 50 mM Tris, pH 7.5. i, Stability profiling of Cora-½/3-Halo and 12 (5 nM) after 7 d exposure to 50 mM PBS, acetic acid (pH 3), sodium acetate (pH 5), MES (pH 6), or Tris buffer (pH 7.5) supplemented with various additives (DTPA, Ca2+, Mg2+, DTT, TCEP = 1 mM; Mn2+, Cu2+ = 0.5 mM). All stability experiments were performed at room temperature. Data in h-i are expressed as the mean ± SD (n = 3 technical replicates) and are representative of at least two independent experiments.
We here report the development of CoraFluors, a class of macrotricyclic terbium complexes that have been optimized for chemogenomic applications. CoraFluors offer improved sensitivity and stability in biological settings. The modular synthetic approach provides straightforward access to orthogonally functionalized analogs and allows for rational tuning of the photophysical and physicochemical properties. We have validated the versatility of CoraFluors based on the development of highly specific homogenous assay formats, including in crude lysates, and identified analogs that are cell-permeable. Finally, we have demonstrated that CoraFluors enable quantitative target engagement assays in living cells.
Results
CoraFluor design and synthetic methodology development
When we evaluated a 3D-model of the Lumi4-Tb™ complex we noticed that, in contrast to crystal structure for the protected macrocyclic precursor, four of the eight amides are oriented with the N-H hydrogens pointing outward (Extended Data Fig. 1)20. We hypothesized that the previously unexplored alkylation of one of the amide nitrogens would be tolerated and potentially even stabilize the complex, providing an alternative linker attachment point. This strategy, combined with additional methodological changes, considerably simplified the synthesis, offering access to the carboxylinker-modified macrocyclic ligand (1, Fig. 1b) in just 11 overall steps (outlined in Extended Data Fig. 2), compared to 22 steps reported for Lumi4-Tb™ (Supplementary Fig. 1)20. Furthermore, our approach also enabled facile access to novel core-substituted analogs, including the chlorinated (2) and brominated (3) derivatives, allowing for systematic modulation of the physical properties of the final terbium complexes (CoraFluor-½/3 (4–6); Fig. 1b).
The free carboxylate can be further functionalized to produce, as examples, HaloTag21 (HT), SNAP-tag22, and active esters such as pentafluorophenyl (Pfp) – CoraFluor-½/3-Halo (7–9, Cora-½/3-Halo), CoraFluor-1-SNAP (10, Cora-1-SNAP), and CoraFluor-1-Pfp (11, Cora-1-Pfp), respectively (Fig. 1c). The direct labeling of proteins through amine-acylation is often the preferred approach for chemical tagging using active esters. However, this is challenging for lanthanide complexes containing multiple chelating carboxylates23. Following the same strategy we also synthesized analogs with modified isophthalamides to access the linker-less reference complexes (X = H, (12); Cl (13); Br (14); Fig. 1d) to serve as comparisons to Lumi4-Tb™ in our studies20.
Photophysical and physicochemical characterization
We first determined the photophysical properties of CoraFluors-½/3 relative to the linker-less complexes 12–14. The emission spectra of all compounds (example Cora-1-Halo; Fig. 1e) displayed the characteristic line-like Tb emission bands arising from the 5D4 ➔ 7FJ transitions of the lanthanide center9. Notably, the absorbance maxima of the halogenated derivatives exhibited a bathochromic shift of ~15–16 nm relative to the unsubstituted complexes that are centered around 340 nm, therefore enabling more efficient excitation at 365 nm and even extending to 405 nm, two channels more commonly found in imaging settings (Fig. 1e, Extended Data Fig. 3, Table 1). CoraFluors possess quantum yields and luminescence lifetimes ranging from 0.13 to 0.58 and 0.89 to 2.68 ms, respectively (Fig. 1f, Extended Data Fig. 4, Table 1). Cora-2-Halo and Cora-3-Halo showed faster excitation kinetics when compared to Cora-1-Halo (Fig. 1g). When using pulsed lasers or high-powered xenon-flash lamps, which can deliver high excitation light energy within < 1 μs, near quantitative excitation can be accomplished even for complexes with slow excitation rate constants (kex). However, when using other illumination methods, such as incandescent light sources or LEDs, which are commonly used in microscopy setups or low-end spectrophotometers and plate readers, the signal intensity will directly depend on kex.5, 24 Importantly, the CoraFluor derivatives Cora-2-Halo and Cora-3-Halo were more lipophilic and exhibited logD values close to 1–3, a range that is generally considered optimal for cell membrane permeability25 (Table 1).
Table 1.
Summary of photophysical and physicochemical properties of linker-less complexes 12–14 and select CoraFluors.
| Complex | λmax (nm) | ε (M−1cm−1) | ϕtot | Brightness | τd (ms) | τd(D2O) (ms) | q | q’corr | logD (pH 7.4) |
|---|---|---|---|---|---|---|---|---|---|
|
| |||||||||
| 12 | 340 | 20,550 | 0.50 | 10,275 | 2.28 | 2.95 | 0.4 | 0.2 | −1.6 |
| 13 | 354 | 19,450 | 0.30 | 5,857 | 1.75 | 1.70 | −0.1 | −0.4 | 0.1 |
| 14 | 352 | 20,400 | 0.19 | 3,966 | 1.25 | 1.28 | 0.1 | −0.2 | 1.3 |
| CoraFluor-1 | 338 | 23,100 | 0.58 | 13,310 | 2.65 | 3.06 | 0.2 | 0.0 | −2.3 |
| CoraFluor-1-Halo | 340 | 21,500 | 0.58 | 12,507 | 2.68 | 3.06 | 0.2 | −0.1 | −0.7 |
| CoraFluor-1-SNAP | 340 | 18,000 | 0.49 | 8,773 | 2.33 | 2.81 | 0.3 | 0.1 | −1.9 |
| CoraFluor-2-Halo | 356 | 15,900 | 0.35 | 5,488 | 1.69 | 1.88 | 0.3 | 0.0 | 0.7 |
| CoraFluor-3-Halo | 355 | 15,950 | 0.13 | 2,074 | 0.89 | 1.15 | 1.1 | 1.0 | 0.9 |
Introduction of the tertiary amide linker was not detrimental but rather improved the photophysical properties of most complexes, and we observed a universally beneficial effect when we assessed CoraFluor stability towards commonly used biological buffers compared to their linker-less counterparts (Fig. 1h–i, Supplementary Figs. 2–6). CoraFluors are compatible with a wide range of biologically-relevant buffer conditions over several days at room temperature, including strong chelators, reducing agents, acidic pH, and bivalent metal ions such as Cu2+ and Mn2+, which are not tolerated by most other TR-FRET donor ligands23. The CoraFluor complexes also displayed much higher kinetic stability to chelators such as ethylenediaminetetraacetic acid (EDTA) and diethylenetriaminepentaacetic acid (DTPA), which we hypothesize is due to the rigidification of the ligand scaffold by the tertiary amide linker.
CoraFluors are suited for homogenous biochemical assays
To evaluate CoraFluors in cell-free biochemical assays, we developed a robust benchmarking platform that uses self-labeling protein tags. Specifically, we cloned and expressed an engineered HaloTag-SNAP-tag fusion protein containing a C-terminal hexa-histidine tag (HSFP6xHis, Fig. 2a).21, 22, 26 The modular design enables the orthogonal labeling of individual domains with small molecule probes (e.g. fluorophores, affinity handles) in defined stoichiometries, resembling ligand binding events and/or protein-protein interactions without potentially confounding effects due to ligand dissociation. Both Cora-1-Halo and Cora-1-SNAP efficiently reacted with their respective fusion protein partner (Supplementary Fig. 7). Furthermore, specific TR-FRET signal was observed in orthogonal experiments employing either Cora-1-SNAP or CoraFluor-1 labeled anti-6xHis IgG (Tb-anti-6xHis IgG), with both HaloTag-ligand functionalized FITC (15, FITC-Halo) and TMR (16, TMR-Halo) as fluorescent acceptors, where signal could be depleted upon addition of TEV protease (Fig. 2b–c, Supplementary Fig. 8). To gauge the limit of detection of Cora-1-SNAP in combination with FITC-Halo, we performed a dose-titration experiment which showed that specific signal was robustly quantified at sub-picomolar concentrations (Fig. 2d).
Figure 2. Biochemical validation of CoraFluors with HSFP6xHis test system.

(a) Schematic of HaloTag-SNAP-tag-6xHis (HSFP6xHis) fusion construct used in biochemical assays for validation of CoraFluors and respective labeled protein conjugates. (b) Detection of specific, TEV protease-cleavable TR-FRET signal between Cora-1-SNAP and both FITC- and TMR-Halo ligands using HSFP6xHis platform. (c) Validation of Cora-1-Pfp labeled anti-6xHis antibody (Abcam, 18184), displaying specific TR-FRET signal between the donor-labeled conjugate and FITC- and TMR-Halo ligands. (d) Limit of detection of donor emission (blue) and Tb/FITC TR-FRET signal (520/490 nm; orange) for a dose-titration of HSFP6xHis conjugate labeled with Cora-1-SNAP and FITC-Halo, showing accurate quantification of TR-FRET signal at femtomolar levels using a monochromator-based plate reader (Tecan SPARK; n = 8 technical replicates). (e) Saturation binding of HSFP6xHis-FITC-Halo to IgG monoclonal anti-6xHis CoraFluor-1 conjugates (0.5 nM) reveals significantly differential binding affinities for two commercial antibody clones (Abcam, 18184 and BioXCell, RT0266). (f) Saturation binding of FITC-Halo or Cora-1-SNAP-labeled HSFP6xHis to CoraFluor-1- or AF488-labeled anti-HaloTag nanobodies (0.5 nM; ChromoTek, HaloTrap), respectively. No significant change of binding affinity was observed. Data are presented as mean ± SD of n = 3 (b-c) or n = 2 (e-f) technical replicates and are representative of at least two independent experiments.
Because of the high costs and/or limited availability of lanthanide complexes that are suitable for direct protein labeling, indirect methods are generally used to install TR-FRET donors on a given protein of interest (e.g. antibodies or biotin/streptavidin). However, direct labeling of the target can be desirable as it allows for better-defined stoichiometry of ligand-target complexes, simplifying the quantitative determination of biochemical constants. For example, when using a monoclonal IgG antibody against a single epitope, two equivalent binding sites (or four in the case of streptavidin) are formed. Occupation of either site with an acceptor-labeled tracer will generally result in maximum TR-FRET signal, which needs to be accounted for in the regression analysis. Polyclonal antibodies can result in higher order complexes, which may enable more sensitive detection, but are difficult to model quantitatively. Regardless, care must be taken that the antibody exhibits sufficiently tight binding to its antigen. To this extent we used a pairwise labeling strategy to compare two commercial anti-6xHis antibodies (Abcam and BioXCell) using our HSFP6xHis profiling platform and found substantial differences between the Abcam (Kd = 6.8 ± 0.4 nM) and BioXCell antibody (Kd = 127 ± 7 nM) (Fig. 2e). Similarly, we used Cora-1-Pfp to label an anti-HaloTag nanobody (HaloTrap; ChromoTek), which binds HSFP6xHis even more tightly (Kd = 3.8 ± 0.4 nM, Fig. 2f). Since nanobodies consist of a single monomeric variable antibody domain they cannot dimerize or oligomerize the target protein, retaining the original target stoichiometry and therefore will serve as useful tools in TR-FRET assay development.
Domain-specific characterization of Keap1 ligands
We next set out to employ CoraFluors for the development of a multimodal biochemical TR-FRET assay platform for Keap1 (Kelch-like ECH-associated protein 1; Fig. 3a–b). Keap1 is a redox-regulated member of a CRL3 (Cullin-RING E3 ligase) complex and forms a homodimer via its N-terminal BTB domain, which also contributes to the binding of Cul3 (Cullin 3). The C-terminal Kelch domains of the homodimer function as a substrate adaptor for the transcription factor Nrf2 (Nuclear factor erythroid 2-related factor 2). During cellular homeostasis, Keap1 recruits Nrf2 and thereby promotes its ubiquitination and subsequent proteasomal degradation. This process is disrupted by oxidative stress or by small molecules, including thiophilic compounds, that can covalently bind to cysteine-rich Keap1, resulting in stabilization and subsequent nuclear translocation of Nrf2, where it regulates the expression of antioxidant response element (ARE) dependent genes27.
Figure 3. CoraFluors enable versatile and domain-specific interrogation of Keap1-Keap1 and Keap1-small molecule interactions.

(a) Schematic representation of Keap1/CRL3 complex. Keap1 forms a homodimer through its BTB domain and binds to Cul3. Nrf2 is recruited via binding to both Kelch domains. (b) Depiction of multimodal TR-FRET assay design principle organized around differentially donor- and acceptor-labeled Keap1 ligands and/or with labeled anti-epitope tag antibodies. (c) Chemical structures of Keap1 tracers and small molecule inhibitors used in this study. Thiophilic sites are represented by orange dots. (d) Saturation binding experiment to determine Keap1 dimer equilibrium dissociation constant. Kd,dimer was determined by linear regression extrapolation of background-corrected, log-transformed equilibrium TR-FRET ratios (solid red circles). Open red circles and open black triangles represent non-corrected, log-transformed and background-corrected, linear-plotted TR-FRET ratios, respectively. Data are presented as mean ± SD (n = 4 technical replicates). (e) Dose-response titration of inhibitor set in Assay-1 with FITC-KL9/Cora-1-KL9 as tracers using untagged, full-length, wildtype Keap1, with Kelch binders displaying predicted potency and thiophilic inhibitors showing lower albeit significant binding at higher concentration. (f) In Assay-2, using Cora-1-KL9 and CDDO-FITC to complete the FRET pair, Kelch binders retain activity and the potency of thiophiles is significantly shifted, indicating more potent binding to Cys151. Highly differential activity (>250-fold) was observed between CDDO/CDDO-Me and CDDO-JQ1. Data in e-f are expressed as mean ± SD (n = 3 technical replicates) and are representative of at least two independent experiments.
In recent years, pharmacological targeting of Keap1 with small molecules for the treatment of neurodegenerative, inflammatory and malignant disorders has received increasing attention27. More recently, recruitment of neosubstrates to the Keap1/CRL3 complex for targeted protein degradation via heterobifunctional degraders has been reported28, 29. Most rational ligand design, in particular for non-covalent inhibitors, has focused on the development of Kelch domain binders to directly block Nrf2 recruitment. In contrast, electrophilic compounds have been proposed to exert their activity mostly through binding to the BTB domain, targeting the regulatory Cys-151 residue30. However, the lack of robust assays, specifically for reversible covalent ligands, that readily enable the profiling of both binding affinities and kinetics has hampered inhibitor development and has limited mechanistic understanding of Keap1. Only very recently have TR-FRET assays based on recombinant, epitope-tagged, truncated Keap1 been developed31, 32. Although these strategies were shown to greatly improve sensitivity over other assay technologies, they were limited to interrogating the Kelch domain and did not offer the ability probe other, more elusive aspects of Keap1.
The nonspecific binding of covalent ligands to reporter antibodies can result in measurement artifacts that are difficult to control for. We hypothesized that the pairwise combination of orthogonally donor/acceptor labeled small molecule ligands would circumvent these potential limitations and pitfalls. By eliminating the requirement for antibodies, streamlined TR-FRET assays, and even previously intangible experiments, are readily enabled with tag-free, full-length, wild-type Keap1 (Fig. 3b). In addition to a fluorescently-labeled 9-mer peptide (17, FITC-KL9) derived from residues 76–84 of Nrf2 (LDEETGEFL)32, we synthesized the analogous CoraFluor labeled peptide (18, Cora-1-KL9) and developed a BTB domain-specific tracer based on the semi-synthetic triterpenoid bardoxolone (19, CDDO-FITC; Fig. 3c). CDDO has been shown qualitatively to bind with high affinity via formation of a reversible covalent adduct with Cys-151.33
We first validated the FITC-KL9 and CDDO-FITC tracers. Employing our CoraFluor-labeled anti-6xHis antibody (see above) and recombinant, full-length Keap1 with N-terminal 6xHis/GST tags, dose titration of the respective tracer ligands yielded apparent equilibrium dissociation constants (Kd,app) of 1.7 ± 0.1 and 6.8 ± 1.1 nM for FITC-KL9 and CDDO-FITC, respectively (Extended Data Fig. 5). While we are not aware of any applicable reference data for CDDO, our determined Kd,app value for FITC-KL9 was comparable to literature values of similar tracers32, 34. Measurement of the first-order dissociation rate constant (koff) by ligand displacement yielded koff values of 0.206 ± 0.006 min−1 and 0.051 ± 0.002 min−1 (Extended Data Fig. 5f), establishing a minimum incubation time of ~15 min and ~60 min for equilibrium conditions (5 half-lives) for FITC-KL9 and CDDO-FITC, respectively35.
Next, we performed a saturation binding experiment using an equimolar mixture of FITC-KL9/Cora-1-KL9 and wildtype, full-length Keap1, which we reasoned would exist to some fraction as a homodimer in solution and therefore result in productive complexes with an acceptor and donor ligand bound. Indeed, we observed a dose-dependent increase that matched a two-site binding model and yielded a Kd-value of 4.0 ± 0.7 nM (Extended Data Furthermore, rapid dilution of Keap1 at constant ligand concentrations allowed facile Fig. 5c). determination of the dimer dissociation rate constant koff,dimer = 0.158 ± 0.016 min−1 (Extended Data Fig. 5g). Similarly, when profiling Keap1 in dose response against an equimolar mixture of FITC-KL9/Cora-1-KL9 at saturation binding concentrations (300 nM each), we determined the equilibrium dissociation constant of the Keap1 dimer to be Kd,dimer = 246 ± 17 nM (Fig. 3d)36, 37. Last, we performed a saturation binding experiment with CDDO-FITC at fixed concentrations of Cora-1-KL9 and Keap1 to establish a dissociation binding constant for CDDO-FITC. Since monomeric Keap1 will be the dominant species at low nanomolar concentrations we fit a one-site binding model, yielding a Kd = 164.4 ± 37.1 nM (Extended Data Fig. 5e).
Figure 5. CoraFluors enable TR-FRET based target engagement profiling in live cells.

(a) Overnight treatment of HEK293T cells transiently transfected with HDAC1-HT in medium supplemented with as low as 12.5 μM Cora-2-Halo labeled > 70% of HDAC1-HT protein relative to DMSO control. Blot is representative of two independent experiments. (b) Optimization of SAHA-NCT tracer concentration in live-cell TR-FRET target engagement assays with Cora-2-Halo labeled HEK293T cells expressing HDAC1-HT. Labeled cells were treated with varying doses of SAHA-NCT (blue) or M344-FITC (orange; cell-impermeable negative control) in the presence or absence of 25 μM panobinostat. In live cells (solid shapes), specific TR-FRET signal was detected with cell-permeable SAHA-NCT, but not with cell-impermeable M344-FITC. Upon addition of lysis buffer and permeabilization of cellular membranes, both tracers displayed specific TR-FRET signal (open shapes). (c) Cellular dose-dependent inhibition of Cora-2-Halo labeled HDAC1-HT in HEK293T cells by various HDAC inhibitors (treatment 4 h at 37°C, 1 μM SAHA-NCT. Data in b-c are presented as mean ± SD (n = 6 technical replicates) and are representative of two independent experiments.
To establish robust assay parameters, we optimized the ligand and protein concentrations and found that 3.5 nM of each KL9 tracer (FITC-KL9, Cora-1-KL9) and 5 nM wildtype Keap1 (Assay-1) provided excellent assay performance (Z’ = 0.71), while 5 nM Cora-1-KL9, 150 nM CDDO-FITC and 5 nM wildtype Keap1 (Assay-2) exhibited similar robustness (Z’ = 0.73). Assay-2 is unique and offers the distinct advantage to simultaneously probe two-binding sites, with the signal originating from the domain for which the corresponding small molecule exhibits the higher affinity, while Assay-1 can potentially identify ligands that disrupt or stabilize Keap1 dimers.
We first used these assay systems to profile the relative affinities and domain-selectivity of a series of thiophilic small molecules, including the cysteine-reactive para-quinone methide obtusaquinone (20, OBT), which we have recently shown to be a reversible covalent thiophile that targets Keap1 and induces its degradation38, dimethyl fumarate (21, Tecfidera), the pentacyclic triterpenoid celastrol (22, CS) that is known to form reversible covalent thiol-adducts39, and finally a CDDO-derived heterobifunctional degrader (23, CDDO-JQ1), for which a close analog has been reported recently,29 to establish evidence for direct Keap1 engagement and to provide a comparison to CDDO (24) and bardoxolone methyl (25, CDDO-Me), which is currently undergoing Phase 3 clinical trials (NCT03550443) for diabetic kidney disease. Our inhibitor set furthermore included the acetylated (26, Ac-KL9) and free N-terminal (27, N-KL9) LDEETGEFL peptides, as well as the potent small molecule Kelch ligand KI-696 (28), all of which are noncovalent ligands (Fig. 3c)40.
As expected, the three Kelch-targeted ligands were the most potent inhibitors in Assay-1, accurately reflecting their reported affinities (Fig. 3e; Supplementary Table 1). Surprisingly, CDDO, OBT and celastrol also exhibited micromolar activity in this assay, while CDDO-Me, CDDO-JQ1 and dimethyl fumarate did not show any appreciable affinity below 100 μM. These results can be rationalized by the presence of a cysteine residue (Cys-434) in the Nrf2 binding site, which, if sterically permitted, can react with the more thiophilic ligands. We hypothesize that this feature can potentially be exploited for rational ligand design.
Conversely, when we tested our Keap1 informer set in Assay-2, the Kelch ligands exhibited virtually identical activities as in Assay-1 (Fig. 3f). These results also confirm that the activity observed in Assay-1 is not the result of ligand-induced disruption of the Keap1 homodimer. Additionally, all thiol-reactive ligands were active in this assay. CDDO and CDDO-Me were the most potent competitors of CDDO-FITC, with the other cysteine-reactive compounds displaying significantly lower albeit differential potencies. However, the heterobifunctional degrader CDDO-JQ1 was >500-fold less potent than CDDO and comparable to the affinity of CDDO-FITC. These findings highlight the importance of optimizing the linker attachment strategy when employing CDDO as an E3-targeting warhead for degrader development and, based on the BTB-CDDO co-crystal structure (PDB: 4CXT), suggest that some of CCDO’s methyl groups, while synthetically more challenging, might provide better vectors for linker attachment when developing degraders with high selectivity for Keap1. Interestingly, celastrol, which displayed the highest affinity in Assay-1, was only slightly more potent in Assay-2, suggesting it has comparable affinity to both Kelch and BTB domains (also see Extended Data Fig. 5 and Supplementary Table 1). To validate the BTB domain selectivity of the inhibitor set, we also performed a single ligand-displacement assay using 6xHis/GST-Keap1 in combination with CoraFluor-labeled anti-6xHis antibody and CDDO-FITC (Assay-3), which further confirmed the activity of OBT and celastrol, and showed that Ac-KL9, N-KL9, and KI-696 are highly specific for the Kelch-domain (Extended Data. Fig. 5h–i).
CoraFluors enable target engagement studies in live cells
The ability to interrogate the interaction of small molecule ligands with their target proteins in living cells with spatiotemporal resolution is of great interest in biomedical research. Only recently we and others have developed suitable technology platforms based on fluorescence polarization microscopy or bioluminescence resonance energy transfer (BRET) that enable such studies41–43. TR-FRET holds great promise in combining the strengths of both platforms to offer high sensitivity, tight spatial control and high-throughput. However, to the best of our knowledge, no generally suitable TR-FRET donors for intracellular application have been reported to date. While Lumi4™ has been used in live cells, those strategies have required conjugation to cell penetrating peptides or harsh conditions such as microinjections or electroporation, which preclude a more generalized experimental approach44, 45.
To evaluate the potential of CoraFluors for intracellular application we first tested their ability to label EGFP-HT in HEK293T cells. Consistent with the improved lipophilicity we found that Cora-2-Halo (logD = 0.7) but not Cora-1-Halo (logD = −0.7) efficiently labeled intracellular EGFP-HT in a dose-dependent manner (Extended Data Fig. 6a). These results provide further support that the observed TMR-Halo competition with Cora-2-Halo is not generated from membrane-compromised cells. Furthermore, we were able to measure specific TR-FRET signal between Cora-2-Halo and EGFP that was competed by pre-treatment with a non-fluorescent HaloTag ligand (29, Ac-Halo) (Extended Data Fig. 6b).
Encouraged by these findings we sought to apply our system to quantify target engagement of small molecule ligands. We selected HDAC1 (histone deacetylase 1) as a model system, which has previously been used for the development of intracellular BRET target engagement assays for HDAC inhibitors42. We cloned HDAC1 into a C-terminal HaloTag expression vector and optimized transient transfection of the construct in HEK293T cells46. Transfection and expression efficiency of HDAC1-HT was validated via treatment with TMR-Halo and fluorescence microscopy (Supplementary Fig. 9). To better quantify the intracellular expression levels of HDAC1-HT, we analyzed lysates of TMR-Halo labeled HDAC1 by SDS-PAGE, followed by fluorescence gel imaging (Extended Data Fig. 7a), which provided an estimated concentration in the mid-micromolar range.
Although fluorescence gel imaging is widely applied for protein quantification, the throughput is limited, and most labs are not equipped with suitable laser gel imagers due to their high costs, which often leaves a lengthier Western Blot analysis as the default option. A more facile and less expensive method that would enable the quantification of HaloTag (or other) fusion proteins directly in lysates would therefore be highly desirable. We rationalized that the pairwise combination of a HaloTag-ligand and HaloTrap nanobody could enable a homogenous assay platform suitable for high-throughput. Using an AlexaFluor488-labeled HaloTrap nanobody (AF488-HaloTrap, see above) in combination with Cora-1-Halo, we determined the lysate concentration of HDAC1-HT to be ~400 nM, which is well in agreement with our results obtained from gel and fluorescence-based quantification (Extended Data Fig. 7b)36.
Next, we determined the equilibrium binding constants of the fluorescent HDAC inhibitors SAHA-NCT and M344-FITC (30 and 31, respectively; Fig. 4a) for recombinant HDAC1 under cell-free conditions to validate their applicability as TR-FRET tracers. Both tracers provided good spectral overlap between donor emission and acceptor absorbance (Fig. 4b). SAHA-NCT has been reported as an optimized probe for cellular HDAC target engagement studies using NanoBRET and was selected to allow for better comparison between the two platforms42. M344-FITC has previously been developed by our group as ligand for fluorescence polarization-based biochemical HDAC assays and was included as a cell-impermeable control compound47. The IC50/Kd values obtained with our representative inhibitor set (SAHA, 32; panobinostat, 33; CI-994, 34; Cpd-60, 35; Fig. 4a) using recombinant, purified protein were consistent with related inhibitors as determined in homogenous TR-FRET and HDAC activity assays using the same construct (Extended Data Fig. 8, Supplementary Table 2)48, 49. Notably, a distinct advantage of TR-FRET assays over traditional enzyme activity and fluorescence polarization-based assays is their compatibility with lysates, enabling the selective interrogation of a specific HDAC target in the direct presence of other HDAC isoforms (Fig. 4c). Taking advantage of the highly specific nature of the HaloTag we used Cora-1-Halo labeled lysate from transient expression of HEK293T cells for the characterization of HDAC tracers and inhibitors. This strategy readily allowed us to determine Ki values and monitor the binding kinetics for slow-binding inhibitors, as exemplified with the well-characterized Cpd-6050 – all without the need for further purification or enrichment of the target protein (Fig. 4c–f).
Figure 4. CoraFluor performance in TR-FRET ligand-displacement assays for HDAC1-HaloTag in crude lysate from transiently transfected HEK293T cells.

(a) Structures of HDAC tracers (M344-FITC, SAHA-NCT) and representative HDAC inhibitors (SAHA, panobinostat, CI-994, Cpd-60) used in this study. (b) Spectral overlap of Tb emission (black, solid) with M344-FITC (orange, dashed) and SAHA-NCT (blue, dashed) absorbance, alongside M344-FITC (orange, solid) and SAHA-NCT (blue, solid) emission. (c) Schematic showing the TR-FRET assay principle wherein covalently bound CoraFluor HaloTag-ligands produce specific TR-FRET signal with fluorescent HDAC tracers M344-FITC and SAHA-NCT, which can be depleted by unlabeled HDAC inhibitors. Here, the specific nature of the HaloTag renders this assay format compatible with cell lysates, where binding to HDAC1 can be measured in the direct presence of other HDAC isoforms. (d) Saturation binding of M344-FITC (orange) and SAHA-NCT (blue) to Cora-1-Halo-labeled HDAC1-HT in HEK293T lysate. (e) Dose-response titration of test compounds in HEK293T lysate using M344-FITC (open shapes) or SAHA-NCT (solid shapes) as tracers at concentrations near their respective Kd values. Ki-values obtained with both tracers are virtually identical and match inhibitory constants determined by other assay platforms (see Supplementary Table 2). (f) Kinetic profiling of HDAC1 inhibition by Cpd-60 (tracer: M344-FITC), confirms time-dependent activity and slow-binding kinetics, resulting in > 100-fold differential apparent Ki over the course of 24 h. Data in d-f are presented as mean ± SD (n = 3 technical replicates) and are representative of at least two independent experiments.
Having demonstrated the robustness and versatility of our methodology in a cell-free system we next sought to validate the approach for intracellular target engagement studies. Following further optimization of our labeling protocol, we achieved efficient (> 70%) intracellular Tb-tagging of HDAC1-HT with Cora-2-Halo (Fig. 5a, Supplementary Fig. 10). As shown in Fig. 5b, in live cells we were able to measure specific and ligand concentration-dependent TR-FRET signal for SAHA-NCT but not M344-FITC, consistent with the poor cell-permeability of M344-FITC. However, concentration-dependent TR-FRET signal was detected for both tracer compounds following cell lysis, further validating that the observed signal is derived from uncompromised cells. In all cases the specific TR-FRET signal was abolished by addition of excess panobinostat.
Finally, we evaluated the utility of our TR-FRET platform for the profiling of intracellular target engagement of our representative inhibitor set with HDAC1. We incubated HDAC1-HT-expressing, Cora-2-Halo labeled HEK293T cells with 1 μM SAHA-NCT and measured TR-FRET signal in the absence and presence of varying concentrations of HDAC inhibitors. As shown in Fig. 5c, we were able to observe dose-dependent decrease in signal for the inhibitors, recapitulating the relative potencies determined in cell-free and biochemical assays (Supplementary Table 2). Importantly, lower concentrations of SAHA-NCT resulted in the expected relative decrease of cellular EC50 values (Extended Data Fig. 9). Correction of the cellular EC50 values according to Cheng-Prusoff51 provided absolute constants that closely matched both our cell-free (lysate) values, as well as literature Ki values obtained in biochemical activity assays using the immunoaffinity-purified dominant nuclear HDAC1 corepressor complex52 (Supplementary Table 2).
Discussion
TR-FRET synergistically combines high sensitivity with exquisite specificity, offering many distinct advantages over other assay modalities commonly employed in biomedical research. However, the lack of affordable, readily available, and high-performance TR-FRET donors, which are compatible with a wide range of biological conditions and are cell permeable, has precluded a broader adaptation of this methodology into the chemical biology toolbox as a default assay platform.
CoraFluors address many of the existing shortcomings of current TR-FRET donors and will facilitate previously elusive experimental approaches. Importantly, CoraFluors are readily compatible with most tracers of existing FRET, BRET and FP platforms, enabling seamless integration while providing improved assay performance. CoraFluors are easily accessible via a concise, robust, modular, and scalable synthesis that is compatible with late-stage functionalization toward almost any conceivable bio-orthogonal handle, including amine-reactive esters, which are more challenging to prepare with aminocarboxylate-derived chelators. Furthermore, their compatibility and stability characteristics in biological media outperform commercially marketed products.
We have exemplified the versatility of CoraFluors by developing a sensitive TR-FRET assay platform for Keap1 that allows for comprehensive and site-specific characterization of ligands using full-length, untagged protein. Our strategy eliminates the requirement for antibodies or streptavidin-based techniques for the installation of the TR-FRET donor, which greatly reduces the complexity of the system, and enables the precise measurement of binding affinities and kinetic parameters not only for BTB-targeted cysteine-reactive small molecules, but also for interactions between Keap1 monomers, all of which have not been possible before. Together, this has provided important mechanistic insights in the activity of Keap1 inhibitors and will support the discovery and development of next generation ligands. Importantly, similar strategies will be readily adaptable to other biomolecules for the detailed characterization of small molecules, including reversible covalent ligands.
Most notably, we have demonstrated that CoraFluors enable the quantitative measurement of small molecule target engagement in living mammalian cells. The ability to measure the interaction of small molecules with their cellular targets is critical to establishing a comprehensive understanding of drug action. In this respect, the cellular thermal shift assay (CETSA) provides a straightforward approach to not only establish experimental support for specific ligand-protein interactions, but also to identify secondary protein targets of a small molecule of interest. However, CETSA is a destructive endpoint assay and does not allow for the direct, quantitative and kinetic measurement of drug binding, but rather requires cell lysis and consecutive analysis by other analytical platforms (e.g. ELISA or quantitative proteomics)53–55. We have previously established a fluorescence polarization microscopy approach to address this need41, 56. More recently, BRET-based methods have been developed. In particular the development of small, efficient, and stable luciferases, with blue shifted emissions and increased brightness such as the NanoLuc (NanoBRET, Promega) have increased the sensitivity and popularity of the technology57. While potential advantages of BRET include genetic encoding of the energy transfer donor and obviating the need for an excitation light source, BRET ultimately depends on the activity of a luciferase for signal generation and is therefore confined by several fundamental limitations inherent to enzymatic reactions. Besides the need for continuous supply of a substrate, the luciferase activity requires oxygen and is affected by temperature, pH and ionic strength, amongst others57. Consequently, BRET is incompatible with both low and high temperatures, unsuitable for anaerobic processes, and sensitive to pH and salt concentration. Total signal intensity is limited by the turnover rate of the luciferase and the emission spectrum limits the number of compatible acceptor fluorophores, which restricts the ability to multiplex. In contrast to TR-FRET, which allows for tight, spatiotemporally controlled excitation of the donor fluorophore, BRET also does not provide meaningful control in these dimensions. Furthermore, the Förster radius of lanthanide TR-FRET pairs is generally larger than that afforded by both conventional FRET and BRET, which enables the probing of larger protein complexes. Lastly, the requirement for the productive spatial orientation of donor and acceptor transition dipoles can critically limit the use of BRET and require lengthy optimization of the linker employed for luciferase fusion protein constructs. As Tb-donor emission is not polarized as in BRET58, TR-FRET also provides greater topological flexibility between donor and acceptor.
Despite the advances in TR-FRET probe development presented here, there are still some existing limitations that have not been addressed by our work. Most desirable would be the ability to use TR-FRET probes in vivo. However, the current probes require UV excitation, which has very poor tissue penetration59. The development of complexes that can be directly excited by longer wavelength, ideally in the near-IR range, would be highly desirable. Unfortunately, this is not possible for Tb-based complexes, for which inherent photophysical properties predict a theoretical upper limit of ~445 nm60. However, 2-photon techniques, upconverting nanoparticles or fiber optics could potentially offer suitable solutions.
Last, while gel-based TMR-Halo labeling competition experiments provide direct evidence of cellular uptake of Cora-2-Halo, they do not establish the mode(s) by which this complex enters cells and if it preferentially partitions into specific subcellular compartments45. The near quantitative labeling of both cytosolic and nuclear target proteins with Cora-2-Halo but not Cora-1-Halo suggests sufficiently broad distribution of the former. Although the requirement for overnight incubation to achieve a high degree of labeling could be the result of intracellular scavenging in subcellular compartments such as lysosomes, we believe that the relatively large size of the core complex is responsible for comparatively slow passive membrane diffusion. This hypothesis of passive uptake is further supported by the fact that Cora-1-Halo exhibits a similar size and overall charge, but less desirable logD. Future time-resolved luminescent imaging studies will be critical to interrogate these processes.
Methods
Photophysical characterization
UV-VIS absorption, fluorescence emission and quantum yield measurements were performed on a Horiba Dual FL spectrophotometer (Dual FL software version V3.7, Horiba Instruments, Kyoto, Japan) using 1 cm pathlength quartz cuvettes. For quantum yield measurements, the total quantum yield (Φtot) values were measured using 12 in 50 mM HEPES buffer, pH 7.4 as the reference (Φtot,ref = 0.50), which was previously determined20 relative to quinine sulfate in 1.0 N H2SO4 (Φr = 0.546). Specifically, five separate dilutions of the respective terbium complexes in 50 mM HEPES, pH 7.4 were prepared within the optically dilute limit (OD340 ranging from ~0.25 to 0.04). The OD340 and fluorescence emission spectra (450 – 700 nm, λex = 340 nm) were recorded for all complexes and their respective serial dilutions with identical instrument parameters. Plots of integrated fluorescence intensity (450 – 700 nm) versus OD340 for each dilution series were generated in Prism 8 (GraphPad Software, San Diego, CA) and the slope of the resulting linear regression analysis was solved for Φtot in Equation 1 below:
| (1) |
where Φtot,ref = 0.50 (12) and η = ηref are identical refractive indices of water.
Lifetime measurements in either 50 mM HEPES, pH 7.4 or D2O were performed using a custom photometer setup. Briefly, samples were excited using a mounted 365 nm LED (M365LP1, Thorlabs Inc., Newton, NJ) that was coupled to a cuvette holder (CVH100, Thorlabs Inc.) via an adjustable collimation adapter (ACP2520-A, Thorlabs Inc.). The mounted LED was powered by a pulse modulated LED driver (DC2100, Thorlabs Inc.). Luminescence intensity was detected using an orthogonally mounted amplified high-speed, switchable-gain silicon detector (PDA36A, Thorlabs Inc.) equipped with a long-path filter (FGL610, Thorlabs Inc.) and coupled to a combined oscilloscope and waveform generator (Analog Discovery 2, Digilent Inc., Pullman, WA), which was used to both record the PDA signal and control the LED driver. Data acquisition was performed at a frequency of 1 Hz and 2% duty cycle for n = 50 measurements using 1 cm pathlength quartz cuvettes. Individual measurements were combined and averaged in Matlab R2020b (MathWorks, Natick, MA) and further processed in Prism 8 (GraphPad Software). To calculate the lifetime, the negative inverse of the slope of the plot of ln(intensity) versus time in ms was taken.
q and , which estimate the number of bound water molecules to the metal center of the terbium complexes, were calculated using the lifetime values of each complex in either water (50 mM HEPES, pH 7.4) or D2O. The calculation of q, which does not correct for the effect of closely diffusing OH oscillators61, was achieved via Equation 2:
| (2) |
where A = 4.2 ms is the proportionality constant for terbium and denotes its sensitivity to quenching by OH oscillators, τH2O and τD2O are the lifetimes of the complexes in 50 mM HEPES, pH 7.4 (H2O) and D2O, respectively, and Δk is the difference of the radiative rate constants in H2O and D2O. The calculation of , which corrects for the effect of closely diffusing OH oscillators62, was achieved via Equation 3:
| (3) |
where A′ = 5 ms is the proportionality constant for terbium and Δkcorr is the corrected value for Δk that takes the effect of closely diffusing OH oscillators into account.
logD measurements
For the measurement of logD (pH 7.4), which is the partition coefficient at a specific pH, 1 μL of a 10 mM DMSO stock of a given terbium complex was injected into the lower, aqueous layer of a 500 μL/500 μL partition between 50 mM sodium phosphate buffer, pH 7.4 + 150 mM NaCl and 1-octanol in a 1.5 mL Eppendorf tube. The partition was vigorously vortexed for 1 min then the emulsified solution was centrifuged at 21,000 × g for 30 seconds to separate the layers. 1 μL of each layer was then added to 39 μL of DMSO (triplicate measurements) in a white, 384-well plate (Corning 3572) and the fluorescence intensity at 548/10 nm (340/50 nm excitation, 100 μs delay, 400 μs integration) was measured on a SPARK plate reader (Tecan, Grödig, Austria). The logD (pH 7.4) was calculated using Equation 4:
| (4) |
where fl. int. octanol/PBS correspond to the 548 nm fluorescence intensities measured for each layer (octanol or 50 mM sodium phosphate, pH 7.4 + 150 mM NaCl).
Stability profiling of select terbium complexes
A D300 digital dispenser (Hewlett-Packard; Palo Alto, CA) was used to dispense terbium complexes (Cora-½/3-Halo, 12–14) into 50 μL of respective buffer solution in a white, 384-well plate (Corning 3572, triplicate measurements) to a final concentration of 5 nM. Initial fluorescence reads were taken on a Tecan SPARK plate reader (340/50 nm excitation, 548/10 nm emission, 100 μs delay, 400 μs integration). The plates were left at room temperature (sealed in between measurements), and fluorescence emission reads were taken over the course of 7 d to monitor the decrease in intensity with respect to time.
Bacterial protein expression
HaloTag-SNAP-tag-6xHis fusion protein (HSFP6xHis)
Plasmid pGW-Halo-SNAP-6xHis (custom cloned by Genscript, Piscataway, New Jersey; whole plasmid sequence data is provided in Supplementary Note 1) was transformed into chemically competent BL21 Star™ (DE3) pLysS One Shot™ E. coli cells (ThermoFisher C602003). A single transformed colony from a Luria-Bertani (LB)-Ampicillin agar plate was used to inoculate 10 mL of LB Broth (MilliporeSigma™ 71–753-5) containing Ampicillin (0.1 mg/mL) and the culture was incubated at 37°C overnight at 225 rpm. The following day, 1 mL of starter culture was used to inoculate 100 mL LB Broth containing Ampicillin (0.1 mg/mL), which was incubated at 37°C with shaking at 225 rpm until OD600 reached ~0.3. The culture was cooled to 20°C in an ice/water slurry then expression of HSFP6xHis was induced with 0.3 mM Isopropyl β-d-1-thiogalactopyranoside (IPTG) and growth was continued for 16 h at 20°C with agitation at 225 rpm. Cells were harvested by centrifugation at 3,000 × g for 20 minutes at 4°C and washed once with Dulbecco’s PBS (DPBS). Cell pellets were snap-frozen in liquid nitrogen and stored at −80°C until lysis was performed.
Frozen cell pellets were quickly thawed in a room temperature water bath and the cells were lysed with 2–3 pellet volumes of ice-cold lysis buffer [per 10 mL: 25 mM HEPES, 500 mM NaCl, 10 mM MgSO4, 10% glycerol, 10 mM imidazole, 1 mM dithiothreitol (DTT), 1 mM 4-(2-aminoethyl)benzenesulfonyl fluoride hydrochloride (AEBSF, MilliporeSigma™ 10–150-050MG), 2 mM ATP, 250 U benzonase nuclease (Sigma E1014), and 90,000 U lysozyme (Lucigen R1804M) in B-PER™ (ThermoFisher 78248), pH 7.0]. Cells were homogenized with a serological pipette and kept on ice for 10 min, then the insoluble fraction was removed via centrifugation at 3,000 × g for 20 min at 4°C. The soluble fraction was taken and incubated with 250 μL Ni-NTA resin (ThermoFisher 88223) that had been pre-equilibrated with wash buffer (25 mM HEPES, 500 mM NaCl, 10 mM Imidazole, 1 mM DTT, 10% glycerol, pH 7.0) for 1 h at 4°C with slow, end-over-end mixing. The fraction containing non-bound proteins was removed via centrifugation at 700 × g for 2 min. The resin was washed 2 × 400 μL with wash buffer containing 20 mM imidazole followed by 3 × 400 μL with wash buffer containing 40 mM imidazole. The bound protein was eluted with 2 × 400 μL elution buffer containing 300 mM imidazole. Small aliquots (~5–10 μL) of wash/elution fractions were labeled with 100 μM TMR-Halo for 10 min at room temperature and subjected to SDS-PAGE analysis to check for purity (1.0 mm NuPAGE™ 4–12% Bis-Tris Protein Gels, NuPAGE™ MOPS running buffer, 140 V). Fluorescence gel images were taken on a Typhoon FLA 9500 scanner (Cy3 excitation/emission) and gels were subsequently stained with SimplyBlue™ SafeStain (ThermoFisher). Desired elution fractions were pooled and buffer exchanged into storage buffer (25 mM HEPES, 100 mM NaCl, 1 mM DTT, 5% glycerol, pH 7.0) using a PD-10 desalting column (GE 17–0851-01). Elutions were monitored via Nanodrop and desired fractions were pooled. The glycerol content was adjusted to 20%, then aliquots were snap-frozen in liquid nitrogen and stored at −80°C until further use.
HSFP6xHis competition experiments via SDS-PAGE
To 20 μL aliquots of HSFP6xHis at a concentration of 0.72 mg/mL (13 μM, MW 56.3 kDa) in storage buffer (25 mM HEPES, 100 mM NaCl, 1 mM DTT, 20% glycerol, pH 7.0) were added the appropriate volume of TMR-Halo or Cora-1-Halo to achieve a molar ratio of ~5x dye to protein (two labeling reactions were prepared for Cora-1-Halo). In parallel, labeling reactions were set up with TMR-SNAP or Cora-1-SNAP (again two labeling reactions prepared for Cora-1-SNAP). The labeling reactions were allowed to proceed for 2 h at room temperature. After, to one of the duplicate Cora-1-Halo or SNAP labeling reactions was added TMR-Halo or TMR-SNAP, respectively, at a molar ratio of 5x dye to protein and the reactions were incubated for an additional 2 h at room temperature. 10 μL of each reaction solution were subjected to SDS-PAGE analysis followed by Cy3 fluorescence imaging and Coomassie staining to assess the ability of the HaloTag (Cora-1-Halo) and SNAP-tag (Cora-1-SNAP) complexes to compete for TMR-Halo/TMR-SNAP binding to HSFP6xHis. The Tb complexes are not detectable with Cy3 fluorescence imaging.
HSFP6xHis TR-FRET experiments
HSFP6xHis purified conjugates labeled with Cora-1-SNAP and either FITC-Halo or TMR-Halo were diluted to 2.5 nM into buffer containing 50 mM Tris, 1 mM DTT, 0.05% v/v TWEEN-20, pH 7.4 in a white, 384-well plate (Corning 3572, 30 μL assay volume, triplicate measurements). To one set of wells was added HisTEV (~50x amount required to cleave amount of HSFP6xHis in each well according to manufacturer’s protocol, Genscript Z03030) and the plate was incubated at 30°C for 1 h. Cleavage of the TEV protease site between the two proteins results in separation of donor and acceptor fluorophore and, as a result, diminishes TR-FRET capacity. TR-FRET measurements were acquired on a Tecan SPARK plate reader: 340/50 nm excitation, 490/10 nm (Tb) and either 520/10 nm (FITC) or 568/10 nm (TMR) emission, 100 μs delay, 400 μs integration. The TR-FRET ratio was taken as either the 520/490 nm intensity ratio (FITC) or 568/490 nm intensity ratio (TMR).
Antibody and nanobody labeling
A 100 μL aliquot of respective IgG antibody (anti-6xHis; 18184, Abcam; RT0266, BioXCell) or nanobody (ChromoTek anti-Halo VHH OT-250; HaloTrap) at a concentration of ≥1 mg/mL was buffer exchanged into reaction buffer (100 mM sodium carbonate buffer, pH 8.5 + 0.05% (v/v) TWEEN-20) using a 0.5 mL, 7K MWCO Zeba™ Spin Desalting Column (ThermoFisher 89882) according to the manufacturer’s protocol. After buffer exchange into reaction buffer, the appropriate volume of Cora-1-Pfp (2.5 mM in dimethylacetamide, DMAc) was added to achieve a molar ratio of approximately 12–15x Cora-1-Pfp to antibody or 4–5x to nanobody (final DMAc content < 5%). The reaction mixture was briefly vortexed and allowed to stand at room temperature for 1 h. Organic solvent and unreacted Pfp ester complex was removed by buffer exchange into storage buffer (50 mM sodium phosphate buffer, pH 7.4, with 150 mM NaCl and 0.05% (v/v) TWEEN-20) using a 0.5 mL, 7K MWCO Zeba™ Spin Desalting Column according to the manufacturer’s protocol. The corrected A280 value (A280,corr) of antibody/nanobody conjugate was determined via Nanodrop (ND-1000 software version 3.8.1; ThermoFisher; 0.1 cm path length) by measuring A280 and A340, using Equation 5:
| (5) |
where cf is the correction factor for the terbium complex contribution to A280 and is equal to 0.157. The concentration of antibody/nanobody conjugate, cab/vhh (M) was determined using Equation 6:
| (6) |
where εab is the antibody extinction coefficient at A280, equal to 210,000 M−1cm−1 for standard IgG classes, εvhh is the nanobody extinction coefficient (HaloTrap) at A280, equal to 23,045 M−1cm−1, and b is path length in cm (0.1 cm). The concentration of terbium complex, cTb (M) covalently bound was determined using Equation 7:
| (7) |
where εTb is the complex extinction coefficient at A340, equal to 22,000 M−1cm−1 and b is path length in cm (0.1 cm). The degree of labeling (DOL) was calculated using Equation 8:
| (8) |
The antibody/nanobody conjugates were diluted with 50% glycerol. Aliquots were snap-frozen in liquid nitrogen and stored at −80°C.
HaloTrap nanobody was also labeled with AF488-Tfp ester (ThermoFisher A37570) using the same methodology, using a correction factor (A280/A495) of 0.11 and an extinction coefficient of 71,000 (A495) for AF488.
HSFP6xHis labeling
To 100 μL aliquots of HSFP6xHis at a concentration of 0.72 mg/mL (13 μM, MW 56.3 kDa) in storage buffer (25 mM HEPES, 100 mM NaCl, 1 mM DTT, 20% glycerol, pH 7.0) were added the appropriate volume of FITC-Halo, TMR-Halo, Cora-1-SNAP, or combinations of FITC-Halo/Cora-1-SNAP and TMR-Halo/Cora-1-SNAP (10 mM DMSO stock solutions) to achieve a molar ratio of ~5x dye(s) to protein (final DMSO content < 5%). The reaction mixtures were briefly vortexed and allowed to react for 16 h at 4°C. To purify the labeled conjugates away from organic solvent and unreacted dye derivatives, the labeling reaction was buffer exchanged into fresh storage buffer using a 0.5 mL, 7K MWCO Zeba™ Spin Desalting Column according to the manufacturer’s protocol. The corrected A280 values (A280,corr) of protein conjugates were determined via Nanodrop (0.1 cm path length) by measuring A280, along with A340 (Tb), A494 (FITC), and/or A554 (TMR). Modifications of Equation 5 were used to solve for A280,corr using correction factors of 0.157 (A280/A340) for Tb, 0.288 (A280/A494) for FITC, and 0.209 (A280/A554) for TMR. The extinction coefficient for HSFP6xHis at A280 is 82,640 M−1cm−1. Aliquots were snap-frozen in liquid nitrogen and stored at −80°C until further use.
Tb-Anti-6xHis (Abcam, 18184) validation with HSFP6xHis
HSFP6xHis purified conjugates labeled with either FITC-Halo or TMR-Halo were diluted to 2.5 nM into buffer containing 50 mM Tris, 1 mM DTT, 0.05% v/v TWEEN-20, pH 7.4 in a white, 384-well plate (Corning 3572, 30 μL assay volume, triplicate measurements). To one set of wells was added HisTEV (~50x amount required to cleave amount of HSFP6xHis in each well according to manufacturer’s protocol, Genscript Z03030) and the plate was incubated at 30°C for 1 h. Cleavage of the TEV protease site between the two proteins results in separation of the C-terminal 6xHis tag (donor binding site) and acceptor fluorophore and, as a result, diminishes TR-FRET capacity. To each well was then added 0.1 nM Tb-Anti-6xHis conjugate (Abcam, 18184) and the plate was incubated at room temperature for 1 h. TR-FRET measurements were acquired on a Tecan SPARK plate reader: 340/50 nm excitation, 490/10 nm (Tb) and either 520/10 nm (FITC) or 568/10 nm (TMR) emission, 100 μs delay, 400 μs integration. The TR-FRET ratio was taken as either the 520/490 nm intensity ratio (FITC) or 568/490 nm intensity ratio (TMR).
Equilibrium dissociation constant (Kd) measurements for Tb-Anti-6xHis conjugates
Tb-Anti-6xHis terbium conjugate (Abcam, 18184 or BioXCell, RT0266) was diluted to 0.5 nM into buffer containing 50 mM HEPES, 100 mM KCl, 0.5 mg/mL BSA, 0.001% (v/v) Tween-20, pH 7.5 in a white, 384-well plate (Corning 3572, 30 μL assay volume, triplicate measurements). A D300 digital dispenser was used to dispense a dose titration of HSFP6xHis purified conjugate labeled with FITC-Halo from 0 nM to 125 nM (1:2 titration, 15-point). The plate was incubated for 2 h at room temperature then TR-FRET measurements were acquired on a Tecan SPARK plate reader: 340/50 nm excitation, 490/10 nm (Tb) and 520/10 nm (FITC) emission, 100 μs delay, 400 μs integration. The TR-FRET ratio was taken as the 520/490 nm intensity ratio. Prism 8 was used to fit the data to a One Site – Total Binding model.
Equilibrium dissociation constant (Kd) measurements for Tb-HaloTrap and AF488-HaloTrap conjugates
Tb-HaloTrap
Tb-HaloTrap conjugate (ChromoTek OT-250) was diluted to 0.5 nM into buffer containing 50 mM HEPES, 100 mM KCl, 0.5 mg/mL BSA, 0.001% (v/v) Tween-20, pH 7.5 in a white, 384-well plate (Corning 3572, 30 μL assay volume, duplicate measurements). A D300 digital dispenser was used to dispense a dose titration of HSFP6xHis purified conjugate labeled with FITC-Halo from 0 nM to 125 nM (1:2 titration, 15-point). The plate was incubated for 2 h at room temperature then TR-FRET measurements were acquired on a Tecan SPARK plate reader: 340/50 nm excitation, 490/10 nm (Tb) and 520/10 nm (FITC) emission, 100 μs delay, 400 μs integration. The TR-FRET ratio was taken as the 520/490 nm intensity ratio. Prism 8 was used to fit the data to a One Site – Total Binding model.
AF488-HaloTrap
HSFP6xHis purified conjugate labeled with Cora-1-SNAP was diluted to 0.5 nM into buffer containing 50 mM HEPES, 100 mM KCl, 0.5 mg/mL BSA, 0.001% (v/v) Tween-20, pH 7.5 in a white, 384-well plate (Corning 3572, 30 μL assay volume, duplicate measurements). A D300 digital dispenser was used to dispense a dose titration of AF488-HaloTrap (1:2 titration, 15-point). The plate was incubated for 2 h at room temperature then TR-FRET measurements were acquired on a Tecan SPARK plate reader: 340/50 nm excitation, 490/10 nm (Tb) and 520/10 nm (AF488) emission, 100 μs delay, 400 μs integration. The TR-FRET ratio was taken as the 520/490 nm intensity ratio. Prism 8 was used to fit the data to a One Site – Total Binding model.
Keap1 tracer characterization
Saturation binding curves to determine Kd,app values for FITC-KL9 and CDDO-FITC against epitope-tagged Keap1 (6xHis/GST; 11981-H20B; Sino Biological Inc.) were performed with 1 nM Keap1 (6xHis/GST) and 0.5 nM Tb-Anti-6xHis (Abcam, 18184) in Keap1 assay buffer (25 mM HEPES, 150 mM NaCl, 1 mM DTT, 0.5 mg/mL BSA, 0.005% (v/v) TWEEN-20, pH 7.4). Dose-titration of tracers was performed using a D300 digital dispenser. Titration ranges of 0–31 nM (1:2, 13-point) and 0–125 nM (1:2, 15-point) were used for FITC-KL9 and CDDO-FITC, and nonspecific signal was determined with 25 μM Ac-KL9 or CDDO, respectively. For Cora-1-KL9, Kd,app values were determined using 1 nM Keap1 (6xHis/GST) and 0.5 nM AF488-Anti-6xHis in Keap1 assay buffer with a dose-titration range of 0–31 nM Cora-1-KL9 (1:2, 13-point). Nonspecific signal was determined with 25 μM Ac-KL9.
Saturation binding curves to determine Kd values for FITC-KL9/Cora-1-KL9 mixture and CDDO-FITC against wildtype Keap1 (tag-free; 11981-HCNB; Sino Biological Inc.) were performed with 1 nM or 4 nM Keap1 (tag-free) in Keap1 assay buffer, respectively, with no additional donor/acceptor present for FITC-KL9/Cora-1-KL9 mix and with 5 nM Cora-1-KL9 present for CDDO-FITC. Dose-titration ranges were 0 to 31 nM (1:1.5 titration, 13-point, total peptide concentration) and 0 to 500 nM (1:1.5 titration, 15-point) for FITC-KL9/Cora-1-KL9 mix and CDDO-FITC, and nonspecific signal was determined with 25 μM Ac-KL9 or CDDO, respectively.
For all experiments, plates (Corning 3572, 30 μL assay volume, triplicate measurements) were incubated for 4 h at room temperature. TR-FRET measurements were acquired on a Tecan SPARK plate reader (SPARKCONTROL software version V2.1, Tecan Group Ltd.): 340/50 nm excitation, 490/10 nm (Tb) and 520/10 nm (FITC) emission, 100 μs delay, 400 μs integration. The TR-FRET ratio was taken as the 520/490 nm intensity ratio. In cases where terbium concentration was dynamic, 490 nm emission was normalized to the dispensed concentration of terbium before the TR-FRET ratio was calculated. Data were fitted to a One Site – Specific Binding model using Prism 8 for all experiments except the FITC-KL9/Cora-1-KL9 mixture, in which case a four-parameter nonlinear regression fit model was used.
Measurement of FITC-KL9 and CDDO-FITC tracer off-rates (koff)
Keap1 (6xHis/GST; 11981-H20B; Sino Biological Inc.) was diluted to 1 nM into Keap1 assay buffer with 0.5 nM Tb-Anti-6xHis (Abcam, 18184) and either 10 nM FITC-KL9 (6.3x Kd,app) or 30 nM CDDO-FITC (4.5x Kd,app) in white 384-well plates (Corning 3572, 30 μL assay volume, triplicate measurements). The assay plate was allowed to equilibrate at room temperature for 4 h then an initial (t = 0) TR-FRET measurement was taken as described above. Following addition of 40 μM Ac-KL9 and 40 μM CDDO to wells containing FITC-KL9 and CDDO-FITC, respectively, the time-dependent change of TR-FRET intensity was recorded (in 10 s intervals) over the course of 85 min. Data were normalized and fitted to a one-phase decay model using Prism 8.
Measurement of equilibrium dissociation constant of Keap1 homodimer interaction (Kd,dimer)
FITC- and Cora-1-KL9 were diluted to 300 nM each (600 nM total tracer concentration) into Keap1 assay buffer in white 384-well plates (Corning 3572, 25 μL assay volume, quadruplicate measurements). Keap1 (tag-free; 11981-HCNB; Sino Biological Inc.) was added in serial dilution from 0 to 500 nM (1:1.4 titration, 7-point) using a D300 digital dispenser and allowed to equilibrate for 2 h at room temperature. TR-FRET measurements were acquired on a Tecan SPARK plate reader: 340/50 nm excitation, 490/10 nm (Tb) and 520/10 nm (FITC) emission, 100 μs delay, 400 μs integration. The TR-FRET ratio was taken as the 520/490 nm intensity ratio. Data were background subtracted, normalized to the concentration of dispensed protein, and log-transformed. The value of Kd,dimer was solved via linear regression extrapolation using Prism 8.36–37
Measurement of Keap1 dimer off-rate (koff,dimer)
Keap1 (tag-free; 11981-HCNB; Sino Biological Inc.) was diluted to 150 nM into Keap1 assay buffer containing 100 nM each of FITC- and Cora-1-KL9 (pre-mixed solution of peptides; 200 nM total tracer concentration). The solution was allowed to equilibrate at room temperature for 2 h. Following rapid dilution (1:20; Corning 3572) into buffer containing isomolar concentrations of peptide tracer mix, the time-dependent change of TR-FRET intensity was recorded (in 5 s intervals) over the course of 30 min. Data were normalized and fitted to a one-phase decay model using Prism 8.
Inhibitor dose responses with full length Keap1 (tag-free) and FITC/Cora-1-KL9 assay system (homo-dimerization of Keap1; Assay-1)
Keap1 (tag-free; 11981-HCNB; Sino Biological Inc.) was diluted to 5 nM into Keap1 assay buffer containing 3.5 nM Cora-1-KL9 and 3.5 nM FITC-KL9 (pre-mixed solution of peptide tracers) in white 384-well plates (Corning 3572, 30 μL assay volume, triplicate measurements). Test compounds were added in serial dilution (1:2 titration, 15-point, cmax = 10 μM KI-696/Ac-KL9 and 100 μM N-KL9/CDDO/CDDO-Me/CDDO-JQ1/OBT/celastrol/dimethyl fumarate) using a D300 digital dispenser and allowed to equilibrate for 4 h at room temperature. TR-FRET measurements were acquired on a Tecan SPARK plate reader: 340/50 nm excitation, 490/10 nm (Tb) and 520/10 nm (FITC) emission, 100 μs delay, 400 μs integration. The TR-FRET ratio was taken as the 520/490 nm intensity ratio. The assay floor (background) was defined with the 10 μM KI-696 dose, and the assay ceiling (top) was defined via a no-inhibitor control. Data were background corrected, normalized and fitted to a four-parameter dose response model using Prism 8.
Inhibitor dose responses with full length Keap1 (tag-free) construct and Cora-1-KL9/CDDO-FITC assay system (Assay-2)
Keap1 (tag-free; 11981-HCNB; Sino Biological Inc.) was diluted to 5 nM into Keap1 assay buffer containing 5 nM Cora-1-KL9 and 150 nM CDDO-FITC in white 384-well plates (Corning 3572, 30 μL assay volume, triplicate measurements). Test compounds were added in serial dilution (1:2 titration, 15-point, cmax = 10 μM KI-696/Ac-KL9/CDDO/CDDO-Me and 100 μM N-KL9/CDDO-JQ1/OBT/Celastrol/dimethyl fumarate) using a D300 digital dispenser and allowed to equilibrate for 4 h at room temperature. TR-FRET measurements were acquired on a Tecan SPARK plate reader: 340/50 nm excitation, 490/10 nm (Tb) and 520/10 nm (FITC) emission, 100 μs delay, 400 μs integration. The TR-FRET ratio was taken as the 520/490 nm intensity ratio. The assay floor (background) was defined with the 10 μM CDDO dose, and the assay ceiling (top) was defined via a no-inhibitor control. Data were background corrected, normalized and fitted to a four-parameter dose response model using Prism 8.
Inhibitor dose responses with full length Keap1 (6xHis/GST) construct and FITC-KL9/CDDO-FITC assay systems (Assays 3 and 4)
Keap1 (6xHis/GST; 11981-H20B; Sino Biological Inc.) was diluted to 1 nM into buffer containing 25 mM HEPES, 150 mM NaCl, 1 mM DTT, 0.5 mg/mL BSA, 0.005% (v/v) TWEEN-20, pH 7.4 with 0.5 nM Tb-Anti-6xHis (Abcam, 18184) and either 5 nM FITC-KL9 (Assay 4) or 40 nM CDDO-FITC (Assay 3) in a white, 384-well plate (Corning 3572, 30 μL assay volume, triplicate measurements). Test compounds were added in serial dilution (1:2 titration, 15-point, cmax = 10 μM KI-696/Ac-KL9 and 100 μM N-KL9/OBT/CDDO/CDDO-Me/CDDO-JQ1/Celastrol/dimethyl fumarate in the FITC-KL9 assay or 10 μM CDDO/CDDO-Me/CDDO-JQ1 and 100 μM KI-696/Ac-KL9/N-KL9/OBT/Celastrol/dimethyl fumarate in the CDDO-FITC assay) using a D300 digital dispenser and allowed to equilibrate for 4 h at room temperature. TR-FRET measurements were acquired on a Tecan SPARK plate reader: 340/50 nm excitation, 490/10 nm (Tb) and 520/10 nm (FITC) emission, 100 μs delay, 400 μs integration. The TR-FRET ratio was taken as the 520/490 nm intensity ratio. The assay floor (background) was defined with the 10 μM KI-696 dose in the FITC-KL9 assay; the assay floor was defined with the 10 μM CDDO dose in the CDDO-FITC assay. The assay ceiling (top) was defined via a no-inhibitor control. Data were background corrected, normalized and Prism 8 was used to fit the data to a four-parameter dose response curve.
Mammalian cell culture
HEK293T cells (ATCC) were propagated in DMEM medium supplemented with 10% FBS, and 1% pen-strep at 37°C and 5% CO2.
Plasmid propagation and production
Plasmids were transformed into chemically competent DH5α (Fisher FEREC0111) according to manufacturer’s protocol. A single transformed colony from a Luria-Bertani (LB)-Ampicillin agar plate was used to inoculate 10 mL of LB Broth (MilliporeSigma 71–753-5) containing Ampicillin (0.1 mg/mL) and the culture was incubated at 37°C overnight at 225 rpm. The following day, 1 mL of starter culture was used to inoculate 250 mL LB Broth containing Ampicillin (0.1 mg/mL), which was incubated at 37°C with shaking at 225 rpm for 16 h. Cells were harvested by centrifugation at 3,000 × g for 20 minutes at 4°C and washed once with Dulbecco’s PBS (DPBS). Cell pellets were snap-frozen in liquid nitrogen and stored at −80°C until plasmid isolation performed.
Transfection-quality plasmid preparations were performed using Qiagen HiSpeed Plasmid Maxi kits (Qiagen 12662) according to manufacturer’s protocol. Plasmid DNA was concentrated to > 500 ng/μL for mammalian transfection.
Preparation of PEI-MAX transfection reagent
PEI-MAX (Polysciences 24765–1) was dissolved in water to a concentration of 1 mg/mL. The pH of the solution was neutralized to pH 7 with NaOH, then sterile filtered (0.22 μm), aliquoted, and stored at −20°C until further use.
Mammalian protein expression
HDAC1-HaloTag (HDAC1-HT)
Plasmid pFC14A-HDAC1-HaloTag was custom cloned by Genscript (Piscataway, New Jersey; whole plasmid sequence data is provided in Supplementary Note 1). HEK293T cells were seeded into 15 cm dishes (~8–10 million cells) to reach ~70–80% confluency one day prior to transfection. Separately, stock solutions of plasmid DNA (pFC14A-HDAC1-HaloTag; 16 μg/mL) and PEI-MAX (48 μg/mL) were prepared in PBS such that the final volume of each stock solution was 1:20 of the volume of culture media (1:3 w/w DNA:PEI-MAX). The solutions were thoroughly mixed, then the DNA solution was added slowly to the PEI solution and the resulting transfection cocktail (1:10 volume of culture media) was incubated for 20 min at room temperature. The transfection cocktail was added dropwise to the cells (final concentrations: 0.8 μg/mL DNA, 2.4 μg/mL PEI-MAX) and cells were grown for 48 h at 37°C and 5% CO2 (fresh media provided to cells 24 h post-transfection). Cells were harvested via trypsinization, washed twice with PBS, and cell pellets snap-frozen in liquid nitrogen and stored at −80°C until further use.
Lysis, Cora-1-Halo labeling, and quantification of HDAC1-HT in HEK293T lysate
A cell pellet from one 15 cm dish (~25 M cells) of pFC14A-HDAC1-HT transfected HEK293T cells was allowed to thaw on ice and cells were suspended in 400 μL lysis buffer (50 mM Tris, 150 mM NaCl, 2 mM DTT, 1% (v/v) Triton X-100, 0.1% (w/v) sodium deoxycholate, pH 7.5 supplemented with 250 U Benzonase (Sigma E1014) and 1x protease inhibitor cocktail (Promega G6521)). Cells were homogenized via passage through a 27.5-gauge needle 5 times, and the resulting mixture was incubated with slow, end-over-end mixing at 4°C for 30 min. The lysate was clarified via centrifugation at 16,100 × g for 20 min at 4°C then 800 μL (1:3 dilution) 1x TBS (50 mM Tris, 150 mM NaCl, pH 7.5) was added and the lysate was re-clarified at 16,100 × g for 20 min at 4°C.
The resulting diluted, clarified lysate was incubated with 10 μM Cora-1-Halo for 16 h at 4°C with slow, end-over-end mixing. The labeled lysate was then gel filtrated through a PD-10 desalting column (GE) with exchange buffer (1x TBS + 1 mM DTT + 0.005% (v/v) TWEEN-20, pH 7.5) to remove excess Cora-1-Halo. PD-10 fractions were tested for protein concentration (Bradford assay, ThermoFisher 23246) and terbium fluorescence (Tecan SPARK plate reader; 340/50 nm excitation, 548/10 nm emission, 100 μs delay, 400 μs integration). Fractions containing both substantial protein and terbium fluorescence were pooled, and total protein concentration was determined via Bradford assay.
Because HaloTag labeling is stoichiometric (1:1 Cora-1-Halo:HDAC1-HT), the concentration of the Cora-1-Halo labeled HDAC1-HT protein in the pooled, gel-filtrated lysate can be determined via a calibration curve of Cora-1-Halo (0–230 nM, 10 nM increments, 23-step; see Extended Data Fig. 7a). In our experience, the yield of HDAC1-HT from a single 15 cm dish of transfected HEK293T cells was 25–50 μg, resulting in protein concentrations in the pooled, desalted lysate between 275 nM and 550 nM (HDAC1-HT MW = 90.6 kDa). Pooled, desalted lysate was diluted 1:5 to remain within the standard curve for quantification, and HDAC1-HT concentration was back-calculated. The labeled lysate was aliquoted, flash frozen in liquid nitrogen, and stored at −80°C until further use.
We also further quantified the concentration of Cora-1-Halo labeled HDAC1-HT in the lysate via titration with AF488-HaloTrap (Extended Data Fig. 7b). For these experiments, labeled, desalted lysate was diluted 1:12 (~20–40 nM in HDAC1-HT, 275 μg/mL total protein) and dispensed into white 384-well plates (Corning 3572; 30 μL assay volume, duplicate measurements). AF488-HaloTrap was added in serial dilution from 0 to 150 nM (1:2 titration, 15-point) using a D300 digital dispenser allowed to equilibrate for 24 h at 4°C. TR-FRET measurements were acquired on a Tecan SPARK plate reader: 340/50 nm excitation, 490/10 nm (Tb) and 520/10 nm (AF488) emission, 100 μs delay, 400 μs integration. The TR-FRET ratio was taken as the 520/490 nm intensity ratio. Data were fit according to Equation 9 below, solving for [HaloTag] (HDAC1-HaloTag in this case):
| (9) |
Where Y are the observed, normalized TR-FRET ratios, Kd is the equilibrium binding constant for HaloTrap (4 nM), and [HaloTrap] is the concentration of AF488-HaloTrap.
Note: We noticed inefficient HaloTag labeling when using Roche cOmplete™, Mini, EDTA-free Protease Inhibitor Cocktail tablets during the course of our experiments. As a result, we profiled HaloTag labeling efficiency over a wide range of buffer and additive conditions (see Supplementary Fig. 11). We observed significant HaloTag inhibition from Roche protease inhibitor tablets, as well as an unknown component(s) of LB-Miller broth. However, protease inhibitor cocktail from Promega (G6521) did not significantly inhibit HaloTag activity and was therefore chosen as the product of choice.
HDAC1 activity assay with recombinant protein
Recombinant HDAC1 (6xHis/FLAG; 50051; BPS Bioscience Inc, San Diego, CA) was diluted to 6 nM (1.2x) into buffer containing 50 mM HEPES, 100 mM KCl, 0.5 mg/mL BSA, 0.001% (v/v) Tween-20, pH 7.5 in a white, 384-well plate (Corning 3572, 25 μL initial assay volume, triplicate measurements). Test compounds were added in serial dilution (1:2 titration, 15-point, cmax = 10 μM SAHA/Cpd-60/SAHA-NCT/M344-FITC, 1 μM panobinostat, and 100 μM CI-994) using a D300 digital dispenser and allowed to equilibrate for 3 h at at room temperature. Then, 5 μL of 6x MAZ1600 HDAC substrate48 was added (final concentration 18 μM, 3x KM) and deacetylase activity was allowed to proceed for 45 min at room temperature. After, 5 μL of 7x developer solution was added (150 nM trypsin + 40 μM SAHA final concentrations) and the plate was incubated for 30 min at room temperature. 7-Amino-4-methyl coumarin fluorescence was measured on a Tecan SPARK plate reader: 350/20 nm excitation, 460/10 nm emission. The assay floor (background) was defined with the 1 μM panobinostat dose, and the assay ceiling (top) was defined via a no-inhibitor control. Data was background corrected, normalized and Prism 8 was used to fit the data to a four-parameter dose response curve.
Equilibrium dissociation constant (Kd) measurements for SAHA-NCT and M344-FITC toward HDAC1 recombinant protein
HDAC1 (6xHis/FLAG; 50051; BPS Biosciences Inc) was diluted to 5 nM with 2.5 nM Tb-Anti-6xHis (Abcam, 18184) in buffer containing 50 mM HEPES, 100 mM KCl, 0.5 mg/mL BSA, 0.001% (v/v) Tween-20, pH 7.5 in a white, 384-well plate (Corning 3572, 30 μL assay volume, triplicate measurements). A D300 digital dispenser was used to dispense dose titrations of either SAHA-NCT or M344-FITC (1:2 titration, 15-point) from 0 nM to 250 nM. Wells were incubated for 2 h at room temperature then TR-FRET measurements were acquired on a Tecan SPARK plate reader: 340/50 nm excitation, 490/10 nm (Tb) and 520/10 nm (FITC) for M344-FITC emission, 548 nm (Tb) and 640 nm (NCT) for SAHA-NCT emission, 100 μs delay, 400 μs integration. The TR-FRET ratio was taken as either the 520/490 nm (M344-FITC) or 640/548 nm (SAHA-NCT) intensity ratio. Nonspecific signal was determined from wells that had been treated with 50 μM SAHA. Prism 8 was used to fit the data to a One Site – Specific Binding model.
Inhibitor dose responses using recombinant HDAC1 protein and SAHA-NCT/M344-FITC assay systems
HDAC1 (6xHis/FLAG; 50051; BPS Biosciences Inc) was diluted to 5 nM with 2.5 nM Tb-Anti-6xHis (Abcam, 18184) and either 20 nM SAHA-NCT or 70 nM M344-FITC in buffer containing 50 mM HEPES, 100 mM KCl, 0.5 mg/mL BSA, 0.001% (v/v) Tween-20, pH 7.5 in a white, 384-well plate (Corning 3572, 30 μL assay volume, triplicate measurements). Test compounds were added in serial dilution (1:2 titration, 15-point, cmax = 10 μM SAHA/Cpd-60, 1 μM panobinostat, and 100 μM CI-994) and allowed to equilibrate for 3 h at room temperature. TR-FRET measurements were acquired on a Tecan SPARK plate reader: 340/50 nm excitation, 490/10 nm (Tb) and 520/10 nm (FITC) for M344-FITC emission, 548 nm (Tb) and 640 nm (NCT) for SAHA-NCT emission, 100 μs delay, 400 μs integration. The TR-FRET ratio was taken as either the 520/490 nm (M344-FITC) or 640/548 nm (SAHA-NCT) intensity ratio. The assay floor (background) was defined with the 1 μM panobinostat dose, and the assay ceiling (top) was defined via a no-inhibitor control. Data was background corrected, normalized and Prism 8 was used to fit the data to a four-parameter dose response curve.
Equilibrium dissociation constant (Kd) measurements for SAHA-NCT and M344-FITC toward HDAC1-HT (Cora-1-Halo labeled) in cell lysate
Cora-1-Halo labeled HDAC1-HT cell lysate was diluted to 1 nM in HDAC1-HT in buffer containing 50 mM HEPES, 100 mM KCl, 0.5 mg/mL BSA, 0.001% (v/v) Tween-20, pH 7.5 in a white, 384-well plate (Corning 3572, 30 μL assay volume, triplicate measurements). The total protein concentration was 15 μg/mL. A D300 digital dispenser was used to dispense dose titrations of either SAHA-NCT or M344-FITC (1:2 titration, 15-point) from 0 nM to 250 nM. Wells were incubated for 2 h at room temperature then TR-FRET measurements were acquired on a Tecan SPARK plate reader: 340/50 nm excitation, 490/10 nm (Tb) and 520/10 nm (FITC) for M344-FITC emission, 548 nm (Tb) and 640 nm (NCT) for SAHA-NCT emission, 100 μs delay, 400 μs integration. The TR-FRET ratio was taken as either the 520/490 nm (M344-FITC) or 640/548 nm (SAHA-NCT) intensity ratio. Nonspecific signal was determined from wells that had been treated with 50 μM SAHA. Prism 8 was used to fit the data to a One Site – Specific Binding model.
Inhibitor dose responses using HDAC1-HT (Cora-1-Halo labeled), and SAHA-NCT/M344-FITC assay systems in cell lysate
Cora-1-Halo-labeled HDAC1-HT cell lysate was diluted to 1 nM in HDAC1-HT with either 12.5 nM SAHA-NCT or 75 nM M344-FITC in HDAC assay buffer (50 mM HEPES, 100 mM KCl, 0.5 mg/mL BSA, 0.001% (v/v) Tween-20, pH 7.5) in white 384-well plates (Corning 3572, 30 μL assay volume, triplicate measurements). The total protein concentration was 15 μg/mL. Test compounds were added in serial dilution (1:2 titration, 15-point, cmax = 10 μM SAHA/Cpd-60, 1 μM panobinostat, and 100 μM CI-994) using a D300 digital dispenser and allowed to equilibrate for 3 h at room temperature. TR-FRET measurements were acquired on a Tecan SPARK plate reader: 340/50 nm excitation, 490/10 nm (Tb) and 520/10 nm (FITC) for M344-FITC emission, 548 nm (Tb) and 640 nm (NCT) for SAHA-NCT emission, 100 μs delay, 400 μs integration. The TR-FRET ratio was taken as either the 520/490 nm (M344-FITC) or 640/548 nm (SAHA-NCT) intensity ratio. The assay floor (background) was defined with the 1 μM panobinostat dose, and the assay ceiling (top) was defined via a no-inhibitor control. Data were background corrected, normalized and fitted to a four-parameter dose response model using Prism 8.
Cell permeability profiling of CoraFluors toward cytosolic HA-EGFP-HaloTag2 construct as determined via competition of TMR-Halo labeling and SDS-PAGE analysis
HEK293T cells from donor dish were trypsinized, trypsin was neutralized with DMEM + 10% FBS, cells were counted, and cell density was adjusted to 450,000 cells/mL. Separately, stock solutions of plasmid DNA (HA-EGFP-HaloTag2 – Addgene 41742; 16 μg/mL)63 and PEI-MAX (48 μg/mL) were prepared in PBS such that the final volume of each stock solution was 1:20 of the volume of suspension cells in culture media (1:3 w/w DNA:PEI-MAX). The solutions were thoroughly mixed, then the DNA solution was added slowly to the PEI solution and the resulting transfection cocktail (1:10 volume of suspension) was incubated for 20 min at room temperature. The transfection cocktail was added to the cell suspension (final concentrations: 0.8 μg/mL DNA, 2.4 μg/mL PEI-MAX, 400,000 cells/mL) and 0.45 mL suspension was added to wells of a 24-well plate (Corning; 180,000 cells per well). Cells were grown for 24 h at 37°C and 5% CO2.
After, media was aspirated and replaced with 0.4 mL phenol red-free Opti-MEM (Gibco) containing DMSO control (0.5%), 50 μM Ac-Halo ligand, or a varying dose of Cora-1-Halo or Cora-2-Halo (6.3, 12.5, 25, or 50 μM). Cells were treated for 4 h at 37°C and 5% CO2 then media was aspirated and cells were washed with 0.5 mL DPBS. Cells were then lysed in lysis buffer (50 μL) containing 50 mM Tris, 150 mM NaCl, 2 mM DTT, 1% (v/v) Triton X-100, 0.1% (w/v) sodium deoxycholate, pH 7.5 supplemented with 250 U benzonase, 1x protease inhibitor cocktail (Promega G6521), and 10 μM TMR-Halo ligand for 1 h at room temperature. To the lysate was added 20 μL 4x LDS loading buffer followed by 8 μL 10x reducing agent and samples were heated to 85°C for 7 min. 20 μL were loaded onto an SDS-PAGE gel and analyzed via Cy3 fluorescence imaging on a Typhoon scanner. TMR-Halo competition from Ac-Halo and Cora-1/Cora-2-Halo treatments was assessed relative to DMSO control.
Detection of intracellular TR-FRET signal between Cora-2-Halo and HA-EGFP-HaloTag2
HEK293T cells from donor dish were trypsinized, trypsin was neutralized with DMEM + 10% FBS, cells were counted, and cell density was adjusted to 325,000 cells/mL. Separately, stock solutions of plasmid DNA (HA-EGFP-HaloTag2; 16 μg/mL) and PEI-MAX (48 μg/mL) were prepared in PBS such that the final volume of each stock solution was 1:20 of the volume of suspension cells in culture media (1:3 w/w DNA:PEI-MAX). The solutions were thoroughly mixed, then the DNA solution was added slowly to the PEI solution and the resulting transfection cocktail (1:10 volume of suspension) was incubated for 20 min at room temperature. The transfection cocktail was added to the cell suspension (final concentrations: 0.8 μg/mL DNA, 2.4 μg/mL PEI-MAX, 300,000 cells/mL) then 2.5 mL suspension was added to wells of a 6-well plate (Corning; 750,000 cells per well). For non-transfected cell control, an identical volume of PBS alone was added to a separate suspension and cells were plated identically. Cells were grown for 24 h at 37°C and 5% CO2.
After, media was aspirated and replaced with 1 mL phenol red-free Opti-MEM (Gibco) containing 50 μM Ac-Halo ligand + 50 μM Cora-2-Halo (1 h pre-treatment with Ac-Halo before Cora-2-Halo addition), or 50 μM Cora-2-Halo alone (for both transfected & non-transfected cells). Cells were treated for 4 h at 37°C and 5% CO2 then media was aspirated and cells were quickly washed with 3 mL phenol red-free Opti-MEM, followed by two 30 min washes at 37°C. Media was aspirated and cells were trypsinized, then trypsin was neutralized with phenol red-free DMEM + 10% FBS and cells were counted. Cells were pelleted at 200 × g for 5 min, media was aspirated and cell density was adjusted to 1,000,000 cells/mL in phenol red-free Opti-MEM. 50 μL of cell suspension were plated into a 384w plate (Corning 3574; 50,000 cells/well; 16 replicates) and TR-FRET measurements were acquired on a Tecan SPARK plate reader: 340/50 nm excitation, 490/10 nm (Tb) and 520/10 nm (EGFP) emission, 100 μs delay, 400 μs integration. Because terbium signal was dynamic due to excess, free Cora-2-Halo being washed out of pre-blocked (Ac-Halo) and non-transfected cells, the 520 nm FRET-sensitized EGFP emission signal was plotted and positive signal was compared to control conditions (Ac-Halo pre-block and non-transfected control).
Cell permeability profiling of Cora-2-Halo toward HDAC1-HaloTag construct as determined via competition of TMR-Halo labeling and SDS-PAGE analysis
HEK293T cells from donor dish were trypsinized, trypsin was neutralized with DMEM + 10% FBS, cells were counted, and cell density was adjusted to 450,000 cells/mL. Separately, stock solutions of plasmid DNA (pFC14A-HDAC1-HaloTag; 16 μg/mL) and PEI-MAX (48 μg/mL) were prepared in PBS such that the final volume of each stock solution was 1:20 of the volume of suspension cells in culture media (1:3 w/w DNA:PEI-MAX). The solutions were thoroughly mixed, then the DNA solution was added slowly to the PEI solution and the resulting transfection cocktail (1:10 volume of suspension) was incubated for 20 min at room temperature. The transfection cocktail was added to the cell suspension (final concentrations: 0.8 μg/mL DNA, 2.4 μg/mL PEI-MAX, 400,000 cells/mL) and 0.45 mL suspension was added to wells of a 24-well plate (Corning; 180,000 cells per well).
For 24 h treatments in cell culture medium, 50 μL of 10x Cora-2-Halo, Ac-Halo, or DMSO solution was added to select wells to achieve concentrations of 12.5, 25, or 50 μM Cora-2-Halo, 50 μM Ac-Halo or 0.5% DMSO control. Cells were grown for 24 h at 37°C and 5% CO2.
After, media was aspirated from select untreated wells and replaced with 0.5 mL phenol red-free Opti-MEM (Gibco) containing DMSO control (0.5%), 50 μM Ac-Halo ligand, or a varying dose of Cora-2-Halo (12.5, 25, or 50 μM). Cells were treated for 4 h at 37°C and 5% CO2 then media was aspirated from all wells and cells were washed with 0.5 mL DPBS. Cells were then lysed in lysis buffer (see above) supplemented with 10 μM TMR-Halo ligand for 1 h at room temperature. To the lysate was added 20 μL 4x LDS loading buffer followed by 8 μL 10x reducing agent and samples were heated to 85°C for 7 min. 20 μL were loaded onto an SDS-PAGE gel and analyzed via Cy3 fluorescence imaging on a Typhoon FLA 9500 fluorescence gel scanner (Amersham Typhoon, software version 1.0.0.7, GE Healthcare). TMR-Halo competition from Ac-Halo and Cora-2-Halo treatments was assessed relative to DMSO control.
Optimization of tracer dose for intracellular target engagement assay with HDAC1-HaloTag construct and Cora-2-Halo complex
HEK293T cells from donor dish were trypsinized, trypsin was neutralized with DMEM + 10% FBS, cells were counted, and cell density was adjusted to 400,000 cells/mL in 10.8 mL media containing 12.5 μM Cora-2-Halo. Separately, stock solutions of plasmid DNA (pFC14A-HDAC1-HaloTag; 16 μg/mL) and PEI-MAX (48 μg/mL) were prepared in PBS such that the final volume of each stock solution was 1:20 of the volume of suspension cells in culture media (1:3 w/w DNA:PEI-MAX). The solutions were thoroughly mixed, then the DNA solution was added slowly to the PEI solution and the resulting transfection cocktail (1:10 volume of suspension) was incubated for 20 min at room temperature. The transfection cocktail was added to the cell suspension (final concentrations: 0.8 μg/mL DNA, 2.4 μg/mL PEI-MAX, 350,000 cells/mL) and the 12 mL suspension was added to a 10 cm dish. Cells were grown for 24 h at 37°C and 5% CO2.
After, media was aspirated and cells were quickly washed with 12 mL phenol red-free DMEM + 10% FBS, followed by one 30 min wash at 37°C and 5% CO2. Cells were washed with PBS, trypsinized, counted, and pelleted. Cell culture medium was aspirated from the cell pellet and cells (now labeled with Cora-2-Halo) were resuspended to a density of 400,000 cells/mL in phenol red-free Opti-MEM (Gibco). The cell suspension was split in two and to one batch was added DMSO control (0.25%) and to the other 25 μM panobinostat. 50 μL of either cell suspension were plated into a 384w plate (Corning 3574; 20,000 cells/well; 6 replicates). A D300 digital dispenser was used to dispense dose titrations of SAHA-NCT and M344-FITC from 0 μM to 2 μM (1:1.5 titrations, 15-point, 2% DMSO maximum). The plate was incubated for 4 h at 37°C and 5% CO2 then TR-FRET measurements were acquired on a Tecan SPARK plate reader: 340/50 nm excitation, 490/10 nm (Tb) and 520/10 nm (FITC) for M344-FITC emission, 548 nm (Tb) and 640 nm (NCT) for SAHA-NCT emission, 100 μs delay, 400 μs integration. The TR-FRET ratio was taken as either the 520/490 nm (M344-FITC) or 640/548 nm (SAHA-NCT) intensity ratio. Signal to background ratio on a per-dose basis was calculated relative to 25 μM panobinostat control.
After live-cell measurements were taken, 25 μL of lysis buffer containing 50 mM Tris, 150 mM NaCl, 2 mM DTT, 1% v/v Triton X-100, 0.1% w/v sodium deoxycholate, pH 7.5 was added to all wells of the 384w plate. The plate was spun at 3000 × g for 3 min and was further incubated for 2 h before identical TR-FRET measurements were taken. Because cell membranes were compromised, the biochemically validated, but cell impermeable FITC-M344 tracer now showed positive TR-FRET signal that could be abolished by 25 μM panobinostat.
Intracellular target engagement assay with HDAC1-HaloTag construct and Cora-2-Halo complex
HEK293T cells from donor dish were trypsinized, trypsin was neutralized with phenol red-free DMEM + 10% FBS, cells were counted, and cell density was adjusted to 400,000 cells/mL in 10.8 mL phenol red-free media containing 12.5 μM Cora-2-Halo. Separately, stock solutions of plasmid DNA (pFC14A-HDAC1-HaloTag; 16 μg/mL) and PEI-MAX (48 μg/mL) were prepared in PBS such that the final volume of each stock solution was 1:20 of the volume of suspension cells in culture media (1:3 w/w DNA:PEI-MAX). The solutions were thoroughly mixed, then the DNA solution was added slowly to the PEI solution and the resulting transfection cocktail (1:10 volume of suspension) was incubated for 20 min at room temperature. The transfection cocktail was added to the cell suspension (final concentrations: 0.8 μg/mL DNA, 2.4 μg/mL PEI-MAX, 350,000 cells/mL) and the 12 mL suspension was added to a 10 cm dish. Cells were grown for 24 h at 37°C and 5% CO2.
After, media was aspirated and cells were quickly washed with 12 mL phenol red-free DMEM + 10% FBS, followed by one 30 min wash at 37°C and 5% CO2. Cells were washed with PBS, trypsinized, counted, and pelleted. Cell culture medium was aspirated from the cell pellet and cells (now labeled with Cora-2-Halo) were resuspended to a density of 400,000 cells/mL in phenol red-free Opti-MEM (Gibco) containing either 250 nM or 1 μM NCT-SAHA tracer (0.25% or 1% DMSO, respectively). The 1 μM NCT-SAHA (1% DMSO) conditions were chosen to reflect the standard conditions used in an intracellular NanoBRET target engagement assay42 for HDAC1-NanoLuc FL (also see Promega TM483 https://www.promega.com/-/media/files/resources/protocols/technical-manuals/101/nanobret-target-engagement-intracellular-hdac-assay-protocol.pdf?la=en). 50 μL of cell suspension were plated into white 384-well plates (Corning 3574; 20,000 cells/well; 6 replicates). Test compounds were added in serial dilution (1:2 titration, 15-point, cmax = 100 μM SAHA/Cpd-60/CI-994, and 25 μM panobinostat; 1% DMSO [1.25% or 2% final]) using a D300 digital dispenser and allowed to equilibrate for 4 h at 37°C and 5% CO2. TR-FRET measurements were acquired on a Tecan SPARK plate reader: 340/50 nm excitation, 548 nm (Tb) and 640 nm (NCT) emission, 100 μs delay, 400 μs integration. The TR-FRET ratio was taken as the 640/548 nm intensity ratio. The assay floor (background) was defined with the 25 μM panobinostat dose, and the assay ceiling (top) was defined via a no-inhibitor control. Data were background corrected, normalized and fitted to a four-parameter dose response model using Prism 8.
Chemical synthesis
Synthetic procedures and small molecule characterization data are provided in Supplementary Note 2.
Data availability statement
The authors declare that the main data, including raw data, supporting the findings of this study are available within the article and its Supplementary Information files. Extra data (NMR and LC/MS data files) are available from the corresponding author upon request.
Reporting Summary
Further information on research design is available in the Nature Research Reporting Summary linked to this article.
Extended Data
Extended Data Fig. 1. Three-dimensional representation of CoraFluor complex.

Model of macrotricyclic terbium complex with tertiary amide linker attachment (upper left). The model was generated in Chem-3D (ChemDraw, PerkinElmer, Waltham, MA). The terbium center is shown as a green sphere.
Extended Data Fig. 2. Synthetic scheme to access CoraFluor ligands.

Reagents and conditions: (a) TsCl, K2CO3, H2O, rt, 48 h; (b) NaOH, H2O, 4°C, 2 h (43% over 2 steps); (c) ethylenediamine, 10 mol% p-TsOH, MePh, 60°C, 24 h (92%); (d) HBr, AcOH, 115°C, 24 h (> 95%); (e) ethyl 6-bromohexanoate, K2CO3, ACN, 80°C, 12 h then KOH, H2O, 95°C, 2 h; (f) HBr, AcOH, 115°C, 24 h then EtOH, HBr (cat.), 85°C, 2 h (54% over 2 steps); (g) 46, 47, or 48, DIPEA, N,N-dimethylformamide, rt, 12 h (> 95%); (h) 40, PyBOP, DIPEA, N,N-dimethylformamide, rt, 1–3 h, 2–5 mM (40–70%); (i) HBr, AcOH, 100°C, 30 min then NaOH, H2O, rt, 10 min then aqueous HBr (> 95%); (j) isobutyl chloroformate, DIPEA, DCM, rt, 10 min then tetrafluorophenol, DMAP (cat.), rt, 12 h (60–80%).
Extended Data Fig. 3. CoraFluor-2 exhibits improved excitability at 405 nm.

(a) Visual comparison of luminescence intensities of CoraFluors under constant illumination with a 365 nm LED (left image) or a 405 nm laser diode (right image) demonstrates significantly enhanced luminescence intensity of Cora-2-Halo compared to Cora-1-Halo with 405 nm but not 365 nm excitation. Excitation light is passed through the adjacent samples from the left, eliminating potential light filtering effects from Cora-2-Halo, which exhibits a higher molar absorptivity at the tested wavelengths. (10 μM CoraFluor in 50 mM HEPES buffer, pH 7.4). (b) Comparative quantitative analysis of excitation wavelength-dependent, time-resolved luminescence intensity of CoraFluors demonstrates that Cora-2-Halo offers superior signal intensity following 405 nm excitation (200 nM CoraFluors in 50 mM HEPES buffer, pH 7.4, constant photomultiplier gain, acquisition delay = 100 μs, and integration time = 50 μs). Excitation wavelength (bandwidth = 5 nm) was varied in 5 nm increments, and the TR-fluorescence response of Cora-1-Halo and Cora-2-Halo was measured relative to background (buffer alone). Data were background-corrected, normalized and are presented as mean ± SD (n = 16 technical replicates). Data were acquired on a Tecan SPARK plate reader in a white 384-well plate (Corning 3572).
Extended Data Fig. 4. Select photophysical characterization data for CoraFluors and linker-less complexes.

(a) Quantum yield plots for select terbium complexes. Data are representative of two independent experiments. (b) Background-corrected decay curves and calculated luminescence lifetimes for linker-less (12–14) and select CoraFluor complexes. Luminescence intensity values were normalized, ln-transformed and linear regression analysis was performed in Prism 8. Data are presented as the averaged signal of n = 50 independent measurements.
Extended Data Fig. 5. Characterization of Keap1 fluorescent tracers and their use in single-ligand displacement TR-FRET assays.

(a-e) Saturation binding of (a) FITC-KL9 against Keap1 (6xHis/GST) construct (1 nM) with 0.5 nM Tb-Anti-6xHis, (b) Cora-1-KL9 against Keap1 (His/GST) construct (1 nM) with 0.5 nM AF488-Anti-6xHis, (c) FITC/Cora-1-KL9 mixture against Keap1 (tag-free) construct (1 nM), (d) CDDO-FITC against Keap1 (6xHis/GST) construct (1 nM) with 0.5 nM Tb-Anti-6xHis, and (e) CDDO-FITC against Keap1 (tag-free) construct (5 nM) with 5 nM Cora-1-KL9. The equilibration dissociation constants (Kd and Kd,app) were calculated in Prism 8 (GraphPad Software) using a one-site-binding (a-d) or four-parameter (e) nonlinear regression fit model. (f) Off-rate measurements (koff) for FITC-KL9 (black) and CDDO-FITC (grey) tracers. (g) Keap1-Keap1 dimer off-rate (koff,dimer) measurement, determined by rapid dilution of FITC-KL9/Cora-1-KL9-saturated homodimer into buffer containing isomolar FITC-KL9/Cora-1-KL9 concentrations. (h-i) Dose-response curves for Keap1 inhibitor test set as measured in TR-FRET assays with recombinant, full-length Keap1 with N-terminal 6xHis/GST tags and FITC-KL9 tracer (h) or CDDO-FITC tracer (i). Conditions: 1 nM Keap1 (6xHis/GST) construct, 0.5 nM Tb-Anti-6xHis, and either (h) 5 nM FITC-KL9 or (i) 40 nM CDDO-FITC, 4 h incubations. See Supplementary Table 1 for measured IC50 values. In these dose-response assays, due to the formation of higher-order oligomeric complexes, we did not attempt to determine true Kd values of inhibitors from the measured IC50 values. However, relative potencies between the inhibitors profiled remained constant. Data are presented as mean ± SD (n = 3 technical replicates) and are representative of at least two independent experiments.
Extended Data Fig. 6. Cell permeability profiling of select CoraFluors with EGFP-HaloTag expression construct.

(a) Labeling of intracellular EGFP-HaloTag construct in HEK293T cells by Cora-2-Halo, but not Cora-1-Halo, in a dose-dependent manner. Cells were treated with the indicated concentrations of HaloTag-ligands (or DMSO control) in phenol red-free Opti-MEM for 4 h at 37°C before being washed, lysed in the presence of 10 μM TMR-Halo, and assessed for competition of TMR-Halo labeling via SDS-PAGE. Blot is representative of two independent experiments. (b) Detection of specific TR-FRET signal between EGFP-HaloTag and Cora-2-Halo in live cells after treatment with 50 μM Cora-2-Halo for 4 h at 37°C. Data are presented as mean ± SD (n = 16 technical replicates) and are representative of two independent experiments.
Extended Data Fig. 7. Mammalian expression and lysate-based quantification of HDAC1-HaloTag construct.

(a) Expression, Cora-1-Halo labeling, and TR-fluorescence-based quantification of HDAC1-HaloTag construct in HEK293T expression lysate. After incubation with 10 μM Cora-1-Halo, the lysate is gel filtrated to remove excess HaloTag ligand. Because labeling is stoichiometric (1:1 Cora-1-Halo:HDAC1-HaloTag), the concentration of Cora-1-Halo labeled HDAC1-HaloTag in the lysate can accurately be determined via a reference calibration curve (see Methods). In our experience, the yield of HDAC1-HaloTag from a single 15 cm dish of transfected HEK293T cells (~25 million cells) was between 25–50 μg, giving protein concentrations between 200–500 nM and, therefore, samples were diluted ~1:5 to remain within the standard curve (green square). Data are presented as mean ± SD of (n = 3 technical replicates) (b) Quantification of HDAC1-HaloTag (Cora-1-Halo labeled) in HEK293T cell overexpression lysate with AF488-HaloTrap. The labeled lysate was diluted 1:12 (275 μg/mL total protein) and incubated with varying concentrations of HaloTrap-AF488 (0–150 nM, 16-point). The concentration of Cora-1-Halo labeled HDAC1-HaloTag in the diluted lysate was determined by nonlinear regression analysis following a quadratic equilibrium-binding equation (see Methods). Data are presented as mean ± SD (n = 2 technical replicates). Data in a-b are representative of at least two independent experiments.
Extended Data Fig. 8. Biochemical validation of HDAC fluorescent tracers and inhibitors with purified, recombinant protein.

(a) Saturation binding curves for fluorescent HDAC tracers (SAHA-NCT, M344-FITC) using recombinant HDAC1. Conditions: 5 nM HDAC1 (6xHis/FLAG; 50051; BPS Biosciences Inc), 2.5 nM Tb-Anti-6xHis IgG, 2 h incubation. (b) Dose-response curves for HDAC inhibitor test set as measured in TR-FRET assay with recombinant HDAC1. Conditions: 5 nM HDAC1 (6xHis/FLAG; 50051; BPS Biosciences Inc), 2.5 nM Tb-Anti-6xHis IgG, 20 nM SAHA-NCT or 70 nM M344-FITC, 3 h incubation. (c) HDAC activity dose-response curves for HDAC inhibitor test set, as well as fluorescent HDAC tracers (SAHA-NCT, M344-FITC) used in this study toward recombinant HDAC1. Conditions: 5 nM HDAC1 (6xHis/FLAG; 50051; BPS Biosciences Inc), 18 μM MAZ1600 substrate (3x KM), 3 h incubation. See Supplementary Table 2 for measured IC50 and determined Kd values. Data are presented as mean ± SD (n = 3 technical replicates) and are representative of at least two independent experiments.
Extended Data Fig. 9. Profiling cellular response of HDAC inhibitors with 0.25 μM SAHA-NCT.

Cellular dose-response curves for HDAC inhibitor test set as measured in TR-FRET assay with Cora-2-Halo labeled HEK293T cells expressing HDAC1-HaloTag, with 0.25 μM SAHA-NCT tracer present. Conditions: 25,000 cells/well (384-well plate; Corning 3574), 4 h incubation at 37°C and 5% CO2. See Supplementary Table 2 for measured EC50 and apparent Ki (Ki,app) values. Data are presented as mean ± SD (n = 6 technical replicates) and are representative of two independent experiments.
Supplementary Material
Acknowledgements
This work was supported by NSF 1830941, NIH R21AI13298, NIH R01AI143723 to R.M. N.C.P. was supported by a National Science Foundation Graduate Research Fellowship (DGE1745303). A.S.K. was supported by Research Travel Grant (Karlsruhe House of Young Scientists, Karlsruhe Institute of Technology, Germany). K.S. was supported by a Goldwater Scholarship and by the Northeastern University Office of Undergraduate Research and Fellowships.
We thank Dr. Stephen J. Haggarty for generosity in providing access to tissue culture space and instrumentation, and Dr. Surya A. Reis and Zachary Rosenthal for guidance and helpful discussion. HA-EGFP-HaloTag2 was a gift from Craig Crews (Addgene plasmid #41742).
Footnotes
Competing interests statement
R.M. is a scientific advisory board (SAB) member and equity holder of Regenacy Pharmaceuticals, ERX Pharmaceuticals, and Frequency Therapeutics. R.M., N.C.P., and A.S.K. are inventors on patent applications related to this work.
References
- 1.Wegner KD, Jin Z, Lindén S, Jennings TL & Hildebrandt N Quantum-Dot-Based Förster Resonance Energy Transfer Immunoassay for Sensitive Clinical Diagnostics of Low-Volume Serum Samples. ACS Nano 7, 7411–7419 (2013). [DOI] [PubMed] [Google Scholar]
- 2.Blay V, Tolani B, Ho SP & Arkin MR High-Throughput Screening: today’s biochemical and cell-based approaches. Drug Discovery Today 25, 1807–1821 (2020). [DOI] [PubMed] [Google Scholar]
- 3.Busby SA et al. Advancements in Assay Technologies and Strategies to Enable Drug Discovery. ACS Chemical Biology 15, 2636–2648 (2020). [DOI] [PubMed] [Google Scholar]
- 4.Sanderson MJ, Smith I, Parker I & Bootman MD Fluorescence Microscopy. Cold Spring Harbor Protocols 2014, pdb.top071795 (2014). [DOI] [PMC free article] [PubMed] [Google Scholar]
- 5.Cho U et al. Ultrasensitive optical imaging with lanthanide lumiphores. Nature Chemical Biology 14, 15 (2017). [DOI] [PMC free article] [PubMed] [Google Scholar]
- 6.Cho U & Chen JK Lanthanide-Based Optical Probes of Biological Systems. Cell Chemical Biology 27, 921–936 (2020). [DOI] [PMC free article] [PubMed] [Google Scholar]
- 7.Francés-Soriano L et al. In Situ Rolling Circle Amplification Förster Resonance Energy Transfer (RCA-FRET) for Washing-Free Real-Time Single-Protein Imaging. Analytical Chemistry 93, 1842–1850 (2021). [DOI] [PubMed] [Google Scholar]
- 8.Moore EG, Samuel APS & Raymond KN From Antenna to Assay: Lessons Learned in Lanthanide Luminescence. Accounts of Chemical Research 42, 542–552 (2009). [DOI] [PMC free article] [PubMed] [Google Scholar]
- 9.Bünzli J-CG Lanthanide Luminescence for Biomedical Analyses and Imaging. Chemical Reviews 110, 2729–2755 (2010). [DOI] [PubMed] [Google Scholar]
- 10.Ergin E, Dogan A, Parmaksiz M, E Elcin A & M Elcin Y Time-resolved fluorescence resonance energy transfer [TR-FRET] assays for biochemical processes. Current Pharmaceutical Biotechnology 17, 1222–1230 (2016). [DOI] [PubMed] [Google Scholar]
- 11.Zwier JM & Hildebrandt N in Reviews in Fluorescence 2016. (ed. Geddes CD) 17–43 (Springer International Publishing, Cham; 2017). [Google Scholar]
- 12.Wu Y-T et al. Quantum Dot–Based FRET Immunoassay for HER2 Using Ultrasmall Affinity Proteins. Small 14, 1802266 (2018). [DOI] [PubMed] [Google Scholar]
- 13.Cardoso Dos Santos M et al. Time-Gated FRET Nanoprobes for Autofluorescence-Free Long-Term In Vivo Imaging of Developing Zebrafish. Advanced Materials 32, 2003912 (2020). [DOI] [PubMed] [Google Scholar]
- 14.Degorce F et al. HTRF: A technology tailored for drug discovery - a review of theoretical aspects and recent applications. Current chemical genomics 3, 22–32 (2009). [DOI] [PMC free article] [PubMed] [Google Scholar]
- 15.Algar WR, Hildebrandt N, Vogel SS & Medintz IL FRET as a biomolecular research tool — understanding its potential while avoiding pitfalls. Nature Methods 16, 815–829 (2019). [DOI] [PubMed] [Google Scholar]
- 16.Coussens NP et al. in Assay Guidance Manual [Internet] (Eli Lilly & Company and the National Center for Advancing Translational Sciences, 2020). [PubMed] [Google Scholar]
- 17.Hildebrandt N, Wegner KD & Algar WR Luminescent terbium complexes: Superior Förster resonance energy transfer donors for flexible and sensitive multiplexed biosensing. Coordination Chemistry Reviews 273–274, 125–138 (2014). [Google Scholar]
- 18.Sy M, Nonat A, Hildebrandt N & Charbonnière LJ Lanthanide-based luminescence biolabelling. Chemical Communications 52, 5080–5095 (2016). [DOI] [PubMed] [Google Scholar]
- 19.Zwier JM et al. A Fluorescent Ligand-Binding Alternative Using Tag-lite® Technology. Journal of Biomolecular Screening 15, 1248–1259 (2010). [DOI] [PubMed] [Google Scholar]
- 20.Xu J et al. Octadentate Cages of Tb(III) 2-Hydroxyisophthalamides: A New Standard for Luminescent Lanthanide Labels. Journal of the American Chemical Society 133, 19900–19910 (2011). [DOI] [PMC free article] [PubMed] [Google Scholar]
- 21.Los GV et al. HaloTag: A Novel Protein Labeling Technology for Cell Imaging and Protein Analysis. ACS Chemical Biology 3, 373–382 (2008). [DOI] [PubMed] [Google Scholar]
- 22.Juillerat A et al. Directed Evolution of O6-Alkylguanine-DNA Alkyltransferase for Efficient Labeling of Fusion Proteins with Small Molecules In Vivo. Chemistry & Biology 10, 313–317 (2003). [DOI] [PubMed] [Google Scholar]
- 23.Mathis G & Bazin H in Lanthanide Luminescence: Photophysical, Analytical and Biological Aspects. (eds. Hänninen P & Härmä H) 47–88 (Springer Berlin Heidelberg, Berlin, Heidelberg; 2011). [Google Scholar]
- 24.Rodenko O, Fodgaard H, Tidemand-Lichtenberg P, Petersen PM & Pedersen C 340 nm pulsed UV LED system for europium-based time-resolved fluorescence detection of immunoassays. Opt. Express 24, 22135–22143 (2016). [DOI] [PubMed] [Google Scholar]
- 25.Johnson TW, Dress KR & Edwards M Using the Golden Triangle to optimize clearance and oral absorption. Bioorganic & Medicinal Chemistry Letters 19, 5560–5564 (2009). [DOI] [PubMed] [Google Scholar]
- 26.Peterson SN & Kwon K The HaloTag: Improving Soluble Expression and Applications in Protein Functional Analysis. Current Chemical Genomics 6, 8–17 (2012). [DOI] [PMC free article] [PubMed] [Google Scholar]
- 27.Cuadrado A et al. Therapeutic targeting of the NRF2 and KEAP1 partnership in chronic diseases. Nature Reviews Drug Discovery 18, 295–317 (2019). [DOI] [PubMed] [Google Scholar]
- 28.Lu M et al. Discovery of a Keap1-dependent peptide PROTAC to knockdown Tau by ubiquitination-proteasome degradation pathway. European Journal of Medicinal Chemistry 146, 251–259 (2018). [DOI] [PubMed] [Google Scholar]
- 29.Tong B et al. Bardoxolone conjugation enables targeted protein degradation of BRD4. Scientific Reports 10, 15543 (2020). [DOI] [PMC free article] [PubMed] [Google Scholar]
- 30.Dayalan Naidu S et al. C151 in KEAP1 is the main cysteine sensor for the cyanoenone class of NRF2 activators, irrespective of molecular size or shape. Scientific Reports 8, 8037 (2018). [DOI] [PMC free article] [PubMed] [Google Scholar]
- 31.Poore DD et al. Development of a High-Throughput Cul3-Keap1 Time-Resolved Fluorescence Resonance Energy Transfer (TR-FRET) Assay for Identifying Nrf2 Activators. SLAS DISCOVERY: Advancing the Science of Drug Discovery 24, 175–189 (2019). [DOI] [PubMed] [Google Scholar]
- 32.Lee S, Abed DA, Beamer LJ & Hu L Development of a Homogeneous Time-Resolved Fluorescence Resonance Energy Transfer (TR-FRET) Assay for the Inhibition of Keap1–Nrf2 Protein–Protein Interaction. SLAS DISCOVERY: Advancing the Science of Drug Discovery, 2472555220935816 (2020). [DOI] [PMC free article] [PubMed] [Google Scholar]
- 33.Cleasby A et al. Structure of the BTB Domain of Keap1 and Its Interaction with the Triterpenoid Antagonist CDDO. PLOS ONE 9, e98896 (2014). [DOI] [PMC free article] [PubMed] [Google Scholar]
- 34.Tran KT et al. A Comparative Assessment Study of Known Small-Molecule Keap1−Nrf2 Protein–Protein Interaction Inhibitors: Chemical Synthesis, Binding Properties, and Cellular Activity. Journal of Medicinal Chemistry 62, 8028–8052 (2019). [DOI] [PubMed] [Google Scholar]
- 35.Hulme EC & Trevethick MA Ligand binding assays at equilibrium: validation and interpretation. British Journal of Pharmacology 161, 1219–1237 (2010). [DOI] [PMC free article] [PubMed] [Google Scholar]
- 36.Jarmoskaite I, AlSadhan I, Vaidyanathan PP & Herschlag D How to measure and evaluate binding affinities. eLife 9, e57264 (2020). [DOI] [PMC free article] [PubMed] [Google Scholar]
- 37.Wilson BD & Soh HT Re-Evaluating the Conventional Wisdom about Binding Assays. Trends in Biochemical Sciences 45, 639–649 (2020). [DOI] [PMC free article] [PubMed] [Google Scholar]
- 38.Badr CE et al. Obtusaquinone: A Cysteine-Modifying Compound That Targets Keap1 for Degradation. ACS Chemical Biology (2020). [DOI] [PMC free article] [PubMed] [Google Scholar]
- 39.Liu J, Lee J, Hernandez Salazar, Mario A, Mazitschek R & Ozcan U Treatment of Obesity with Celastrol. Cell 161, 999–1011 (2015). [DOI] [PMC free article] [PubMed] [Google Scholar]
- 40.Davies TG et al. Monoacidic Inhibitors of the Kelch-like ECH-Associated Protein 1: Nuclear Factor Erythroid 2-Related Factor 2 (KEAP1:NRF2) Protein–Protein Interaction with High Cell Potency Identified by Fragment-Based Discovery. Journal of Medicinal Chemistry 59, 3991–4006 (2016). [DOI] [PubMed] [Google Scholar]
- 41.Dubach JM et al. In vivo imaging of specific drug–target binding at subcellular resolution. Nature Communications 5, 3946 (2014). [DOI] [PMC free article] [PubMed] [Google Scholar]
- 42.Robers MB et al. Target engagement and drug residence time can be observed in living cells with BRET. Nature Communications 6, 10091 (2015). [DOI] [PMC free article] [PubMed] [Google Scholar]
- 43.Vinegoni C, Feruglio PF, Gryczynski I, Mazitschek R & Weissleder R Fluorescence anisotropy imaging in drug discovery. Advanced Drug Delivery Reviews 151–152, 262–288 (2019). [DOI] [PMC free article] [PubMed] [Google Scholar]
- 44.Mohandessi S, Rajendran M, Magda D & Miller LW Cell-Penetrating Peptides as Delivery Vehicles for a Protein-Targeted Terbium Complex. Chemistry – A European Journal 18, 10825–10829 (2012). [DOI] [PMC free article] [PubMed] [Google Scholar]
- 45.Chen T, Pham H, Mohamadi A & Miller LW Single-Chain Lanthanide Luminescence Biosensors for Cell-Based Imaging and Screening of Protein-Protein Interactions. iScience 23, 101533 (2020). [DOI] [PMC free article] [PubMed] [Google Scholar]
- 46.Banks CAS et al. Differential HDAC½ network analysis reveals a role for prefoldin/CCT in HDAC½ complex assembly. Scientific Reports 8, 13712 (2018). [DOI] [PMC free article] [PubMed] [Google Scholar]
- 47.Mazitschek R, Patel V, Wirth DF & Clardy J Development of a fluorescence polarization based assay for histone deacetylase ligand discovery. Bioorganic & Medicinal Chemistry Letters 18, 2809–2812 (2008). [DOI] [PMC free article] [PubMed] [Google Scholar]
- 48.Bradner JE et al. Chemical phylogenetics of histone deacetylases. Nature Chemical Biology 6, 238 (2010). [DOI] [PMC free article] [PubMed] [Google Scholar]
- 49.Marks BD, Fakhoury SA, Frazee WJ, Eliason HC & Riddle SM A Substrate-Independent TR-FRET Histone Deacetylase Inhibitor Assay. Journal of Biomolecular Screening 16, 1247–1253 (2011). [DOI] [PubMed] [Google Scholar]
- 50.Methot JL et al. Exploration of the internal cavity of histone deacetylase (HDAC) with selective HDAC1/HDAC2 inhibitors (SHI-1:2). Bioorganic & Medicinal Chemistry Letters 18, 973–978 (2008). [DOI] [PubMed] [Google Scholar]
- 51.Yung-Chi C & Prusoff WH Relationship between the inhibition constant (Ki) and the concentration of inhibitor which causes 50 per cent inhibition (I50) of an enzymatic reaction. Biochemical Pharmacology 22, 3099–3108 (1973). [DOI] [PubMed] [Google Scholar]
- 52.Fuller NO et al. CoREST Complex-Selective Histone Deacetylase Inhibitors Show Prosynaptic Effects and an Improved Safety Profile To Enable Treatment of Synaptopathies. ACS Chemical Neuroscience 10, 1729–1743 (2019). [DOI] [PMC free article] [PubMed] [Google Scholar]
- 53.Dai L et al. Horizontal Cell Biology: Monitoring Global Changes of Protein Interaction States with the Proteome-Wide Cellular Thermal Shift Assay (CETSA). Annual Review of Biochemistry 88, 383–408 (2019). [DOI] [PubMed] [Google Scholar]
- 54.Asawa RR et al. A Comparative Study of Target Engagement Assays for HDAC1 Inhibitor Profiling. SLAS DISCOVERY: Advancing the Science of Drug Discovery 25, 253–264 (2020). [DOI] [PMC free article] [PubMed] [Google Scholar]
- 55.Seashore-Ludlow B, Axelsson H & Lundbäck T Perspective on CETSA Literature: Toward More Quantitative Data Interpretation. SLAS DISCOVERY: Advancing the Science of Drug Discovery 25, 118–126 (2020). [DOI] [PubMed] [Google Scholar]
- 56.Vinegoni C et al. Measurement of drug-target engagement in live cells by two-photon fluorescence anisotropy imaging. Nature Protocols 12, 1472–1497 (2017). [DOI] [PMC free article] [PubMed] [Google Scholar]
- 57.England CG, Ehlerding EB & Cai W NanoLuc: A Small Luciferase Is Brightening Up the Field of Bioluminescence. Bioconjugate Chemistry 27, 1175–1187 (2016). [DOI] [PMC free article] [PubMed] [Google Scholar]
- 58.Selvin PR Principles and Biophysical Applications of Lanthanide-Based Probes. Annual Review of Biophysics and Biomolecular Structure 31, 275–302 (2002). [DOI] [PubMed] [Google Scholar]
- 59.Ash C, Dubec M, Donne K & Bashford T Effect of wavelength and beam width on penetration in light-tissue interaction using computational methods. Lasers in Medical Science 32, 1909–1918 (2017). [DOI] [PMC free article] [PubMed] [Google Scholar]
- 60.Latva M et al. Correlation between the lowest triplet state energy level of the ligand and lanthanide(III) luminescence quantum yield. Journal of Luminescence 75, 149–169 (1997). [Google Scholar]
- 61.Horrocks WD & Sudnick DR Lanthanide ion probes of structure in biology. Laser-induced luminescence decay constants provide a direct measure of the number of metal-coordinated water molecules. Journal of the American Chemical Society 101, 334–340 (1979). [Google Scholar]
- 62.Beeby A et al. Non-radiative deactivation of the excited states of europium, terbium and ytterbium complexes by proximate energy-matched OH, NH and CH oscillators: an improved luminescence method for establishing solution hydration states. Journal of the Chemical Society, Perkin Transactions 2, 493–504 (1999). [Google Scholar]
- 63.Neklesa TK et al. Small-molecule hydrophobic tagging–induced degradation of HaloTag fusion proteins. Nature Chemical Biology 7, 538–543 (2011). [DOI] [PMC free article] [PubMed] [Google Scholar]
Associated Data
This section collects any data citations, data availability statements, or supplementary materials included in this article.
Supplementary Materials
Data Availability Statement
The authors declare that the main data, including raw data, supporting the findings of this study are available within the article and its Supplementary Information files. Extra data (NMR and LC/MS data files) are available from the corresponding author upon request.