Abstract
Plasma lipids are known heritable risk factors for cardiovascular disease, but increasing evidence also supports shared genetics with diseases of other organ systems. We devised a comprehensive three-phase framework to identify novel lipid-associated genes and study the relationships between lipids, genotypes, gene expression and hundreds of complex human diseases from electronic Medical Records and Genomics (347 traits) and UK Biobank (549 traits) cohorts. Aside from 67 novel lipid-associated genes with strong replication, we found evidence for pleiotropic SNPs/genes between lipids and diseases across the phenome. These include discordant pleiotropy in the HLA region between lipids and multiple sclerosis and putative causal paths between triglycerides and gout, among several others. Our findings give insights into the genetic basis of the relationship between plasma lipids and diseases on a phenome-wide scale and can provide context for future prevention and treatment strategies.
Plasma lipids, including total cholesterol (TC), low-density lipoprotein cholesterol (LDL-C), high-density lipoprotein cholesterol (HDL-C), and triglycerides (TG), are heritable risk factors for atherosclerotic cardiovascular disease1,2. Previous meta-analyses3,4, electronic-health records-(EHR) based studies5, and large-scale biobanks6 have identified hundreds of loci associated with lipids using genome-wide association studies (GWAS). In addition, transcriptome-wide association studies (TWAS7,8) have identified several genes whose cis-expression levels have been implicated in lipid traits as well as a host of other complex traits and diseases6. However, one of the challenges has been validating the robustness of the results obtained using different methods across multiple cohorts.
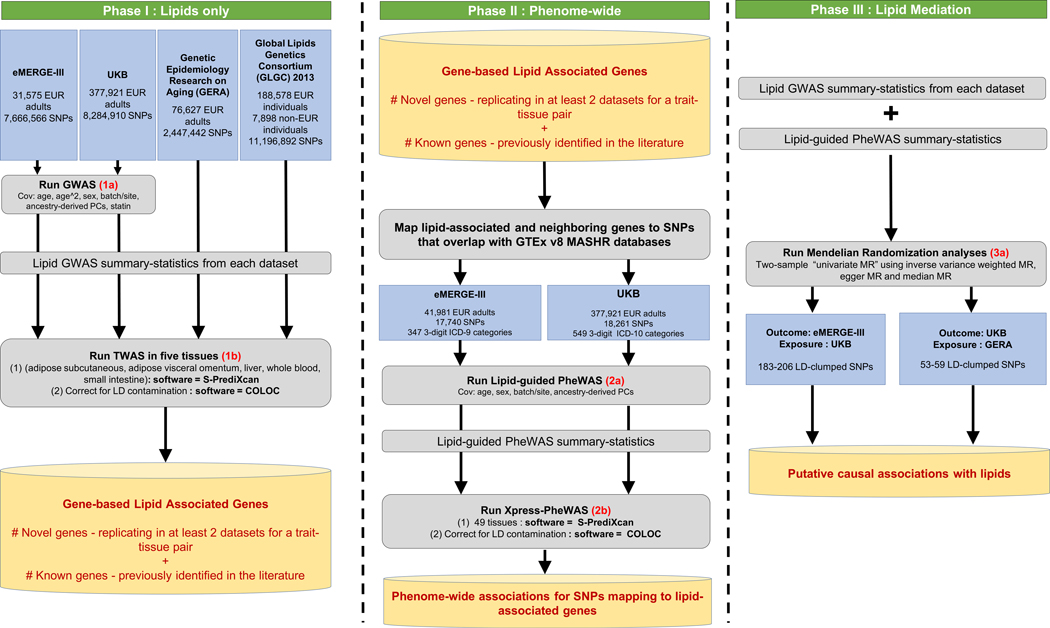
Our primary hypothesis was that we could identify a robust set of lipid-associated genes by integrating tissue-specific gene expression with genotype and examining the extent of their replication across multiple large-scale cohorts that adopted different study designs. We devised an integrative framework that combines TWAS with statistical colocalization and conditional analyses (using tissue-specific weights from the Genotype Tissue Expression (GTEx) project v89). As part of Phase I of our study (Fig. 1, left), we detected several lipid-associated genes that replicated across multiple cohorts for the same trait-tissue pair. These included a meta-analyzed cohort (Global Lipids Genetics Consortium (GLGC3)), an EHR-based cohort (Genetic Epidemiology Resource on Adult Health and Aging (GERA5)), a mega-analysis multisite cohort (electronic Medical Records and Genomics (eMERGE10)), and a population-based biobank (UK Biobank (UKB11)).
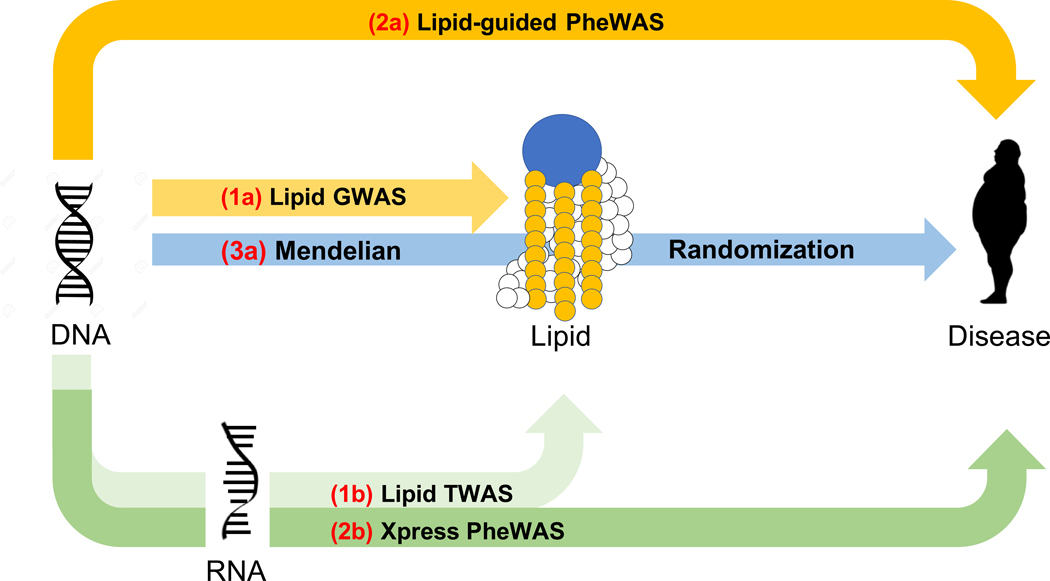
Figure 1 |. Study workflow to identify lipid-associated genes, suggestive pleiotropy between lipids and diseases, and putative diseases for which lipids are modifiable exposures.
The workflow has been divided into three phases: the first phase focuses on lipid-based analyses in four cohorts to identify novel and previously reported lipid genes; it comprises lipid GWAS (two-sided linear regression; 1a) and lipid TWAS across five tissues (1b). The second phase integrates results from lipid GWAS with gene expression and EHR; it focuses on variants mapping to significant lipid genes derived from Phase I and comprises lipid-guided PheWAS (two-sided logistic regression; 2a) and Xpress-PheWAS across all available tissues in PredictDB for MASHR models (2b). The third phase focuses on univariable two-sample MR analyses (3a) to identify diseases for which lipids are modifiable exposures.
Plasma lipids have also been known to be associated with diseases pertaining to multiple organ systems, including diseases of the musculoskeletal system (rheumatoid arthritis12), skin and subcutaneous tissue (psoriasis13), circulatory system (coronary heart disease14), and nervous system (multiple sclerosis15, Alzheimer’s disease16). Statistical pleiotropy (statistical association of a genetic variant with multiple traits) can dissect the genetic basis of interrelationships between lipids and diseases. Long established in model organisms, pleiotropy is pervasive among 90% of loci listed in the GWAS Catalog17,18. Aside from studies that present a global view of pleiotropy18–20, previous studies have identified pleiotropic relationships between lipids and coronary artery disease21, immune-related disorders22, cardiometabolic traits23, and chronic inflammation24 as well as between coronary artery disease and nervous system disorders25,26. However, the underlying genetic mechanisms that link lipid levels to the broad spectrum of diseases in Electronic Health Records (EHR), also known as electronic medical records, have not been comprehensively investigated in multiple large-scale cohorts using multi-omics data. To understand the genetic interrelationships between plasma lipids and diseases across the phenome, we devised a second integrative framework using data on adults of European ancestry from eMERGE and UKB cohorts as part of Phase II of this study (Fig. 1, middle). This additional framework incorporates lipid-guided phenome-wide association studies (PheWAS), gene expression-based phenome-wide association studies (Xpress-PheWAS), and statistical colocalization between EHR and GTEx v8-based gene expression summary statistics. Finally, as part of Phase III of this study, we performed two-sample Mendelian randomization (MR)27 with lipids (from GERA and UKB) as exposure and EHR (from UKB and eMERGE) as outcome (Fig. 1, right). This overall framework can (1) visualize the complete landscape of pleiotropy between lipids and diseases (including effects that are concordant, i.e. have the same direction of effect, and discordant, i.e. have opposite direction of effect) and (2) identify diseases for which lipids could be modifiable exposures. We present a comprehensive overview of the complex interplay between lipids, genetics, gene expression, and diseases in the EHR. The detected genes/variants could be used as targets for functional validation and downstream drug repurposing studies.
Results
Study workflow.
As outlined in the study workflow (Fig. 1), we first performed GWAS on lipid traits in eMERGE and UKB adults of European ancestry and used the summary statistics to conduct TWAS and statistical colocalization on lipid traits (S-PrediXcan7) in eMERGE, UKB, GERA and GLGC. We then conducted ‘lipid-guided’ PheWAS, Xpress-PheWAS and statistical colocalization on curated International Classification of Diseases (ICD) diagnosis codes from eMERGE and UKB using SNPs mapping within 1 Mb of lipid-associated genes derived from lipid TWAS. For the lipid-guided PheWAS and Xpress-PheWAS, we had predominantly ICD-9-CM codes (~82%) in eMERGE network and ICD-10 disease codes (~98%) in UKB, which we collapsed into three-character parent codes (see Extended Data Fig. 1 for case-control distribution). While the lipid-guided PheWAS and Xpress-PheWAS helped identify potential pleiotropic SNPs/genes between lipids and diseases, MR analyses helped identify diseases for which lipids could be modifiable exposures. Below, we describe results derived from each of the steps delineated above.
Phase I—Discovery and replication of novel lipid-associated genes.
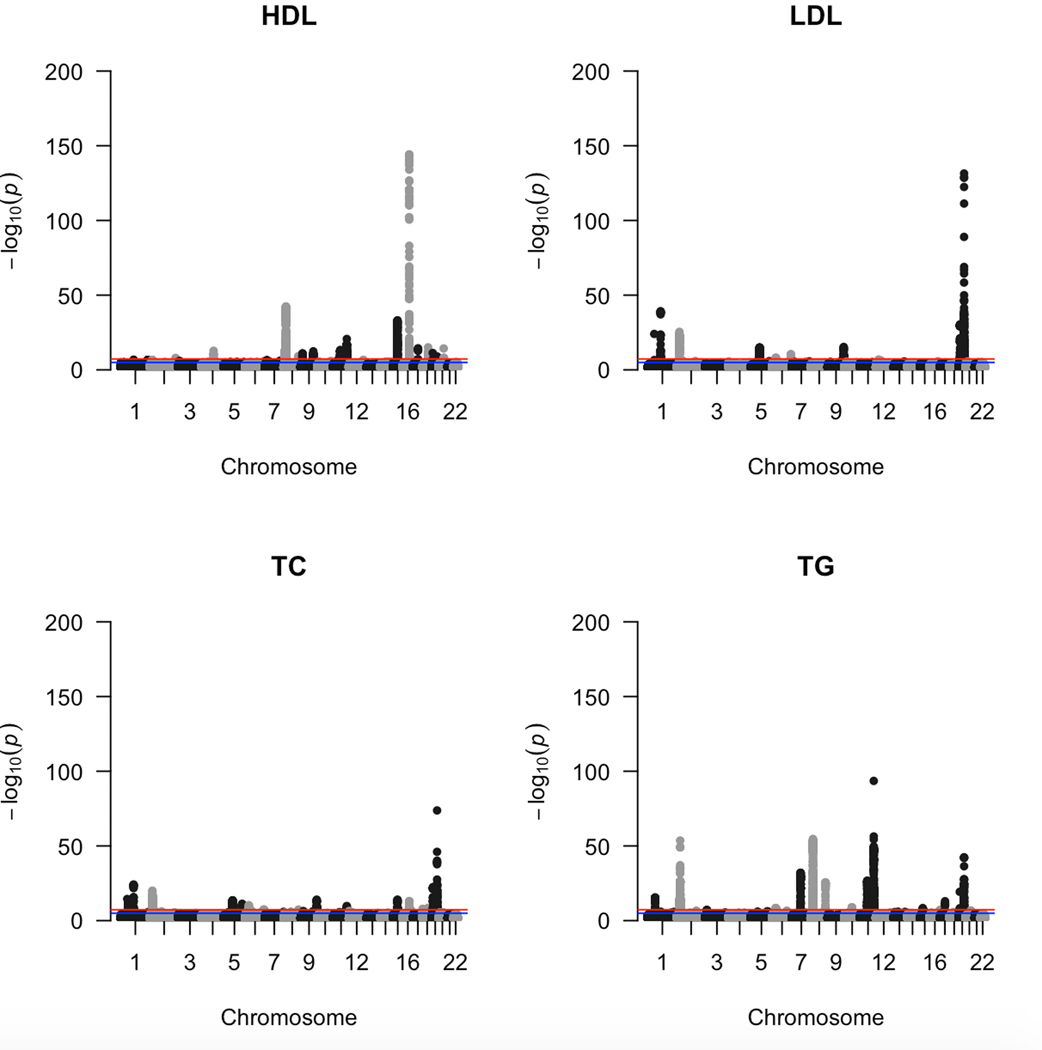
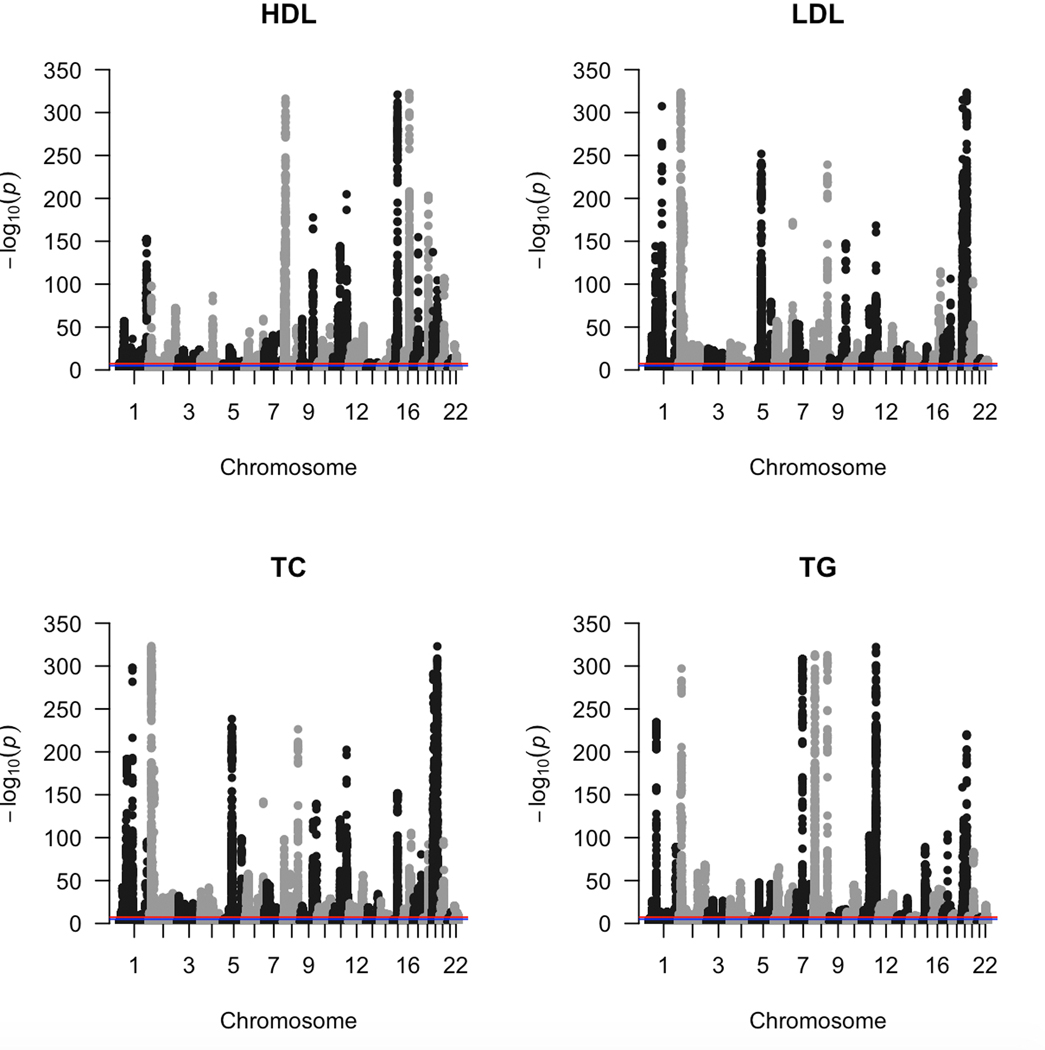
Lipid GWAS on adults of European ancestry from eMERGE (n = 31,575) and UKB (n = 377,921) cohorts revealed the breadth of signals across the four lipid traits (Extended Data Figs. 2 and 3). In addition, we also used pre-published lipid GWAS summary statistics from GERA (n = 76,627) and GLGC (n = 188,578) for the lipid TWAS. Supplementary Figs. 1 and 2 show the extent of overlap in GWAS and TWAS signals across the four lipid traits in the four cohorts. For lipid TWAS, we integrated summary statistics from each of the four cohorts with tissue-specific weights derived from four tissues most relevant to lipid metabolism (adipose subcutaneous, adipose visceral omentum, small intestine terminal ileum, and liver) and whole blood from GTEx v8 using MASHR-based prediction models28 from PredictDB. These models use multivariate adaptive shrinkage to calculate effect sizes on fine-mapped variants obtained using Deterministic Approximation of Posteriors (DAP-G). We devised a novel workflow built upon a previous study7 (see Online Methods) that could prioritize genes in downstream functional analyses to assess causality.
Figure 2 shows lipid-gene associations among autosomal chromosomes for each tissue-cohort combination. We obtained 1,033 Bonferroni-significant genes in total (P < 5.57 × 10⁻⁷). These included 79 novel genes and 954 previously reported genes (see Online Methods for how genes were classified into novel vs. previously reported). We subsequently filtered out the LD-contaminated genes7, a scenario in which gene expression-predictor SNPs (eQTL) and phenotype causal SNPs (GWAS) are different but in LD. Herein, we only retained genes that had at least one SNP with coloc29 H3 probability < 0.5 between GWAS and eQTL datasets for a given lipid-tissue combination. Further, we also conditioned the SNPs at a locus on the top eQTL at that locus (GCTA-COJO30) to detect if there are potential secondary independent associations at the locus. Code for identifying LD-contaminated genes and detecting secondary independent associations at a locus is shared on GitHub (https://github.com/RitchieLab/Gene-level-statistical-colocalization).
Figure 2 |. Replication of lipid-associated genes across four cohorts from lipid TWAS.
The size of the points indicates the extent of replication for novel (fill) and previously reported (no-fill) genes across the four cohorts (eMERGE, GERA, GLGC, UKB) for a lipid-tissue pair. The colors represent the five tissues: adipose subcutaneous (AS), adipose visceral omentum (AV), liver (LV), whole blood (WB), and small intestine (SI). The shape of each point represents the four lipid traits (circles for HDL-C, squares for LDL-C, upward triangles for total cholesterol, and downward triangle for triglycerides). The right-hand side plot is a blown-up version of part of the left-hand side plot (up to an upper −log(P) threshold of 125) but for novel genes only. The solid red line corresponds to the Bonferroni-significance threshold.
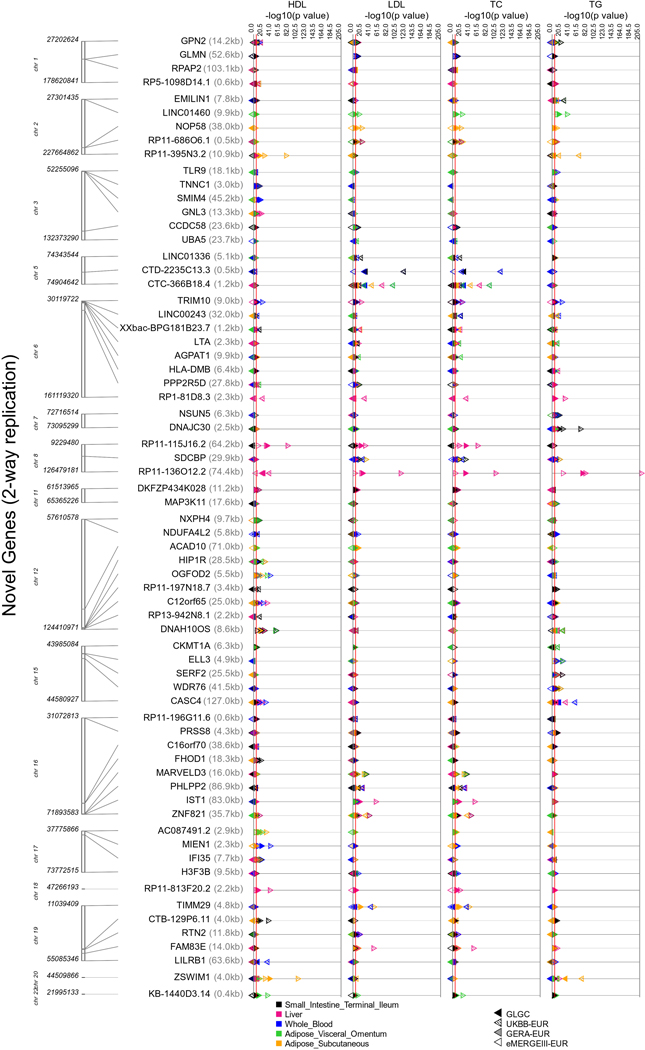
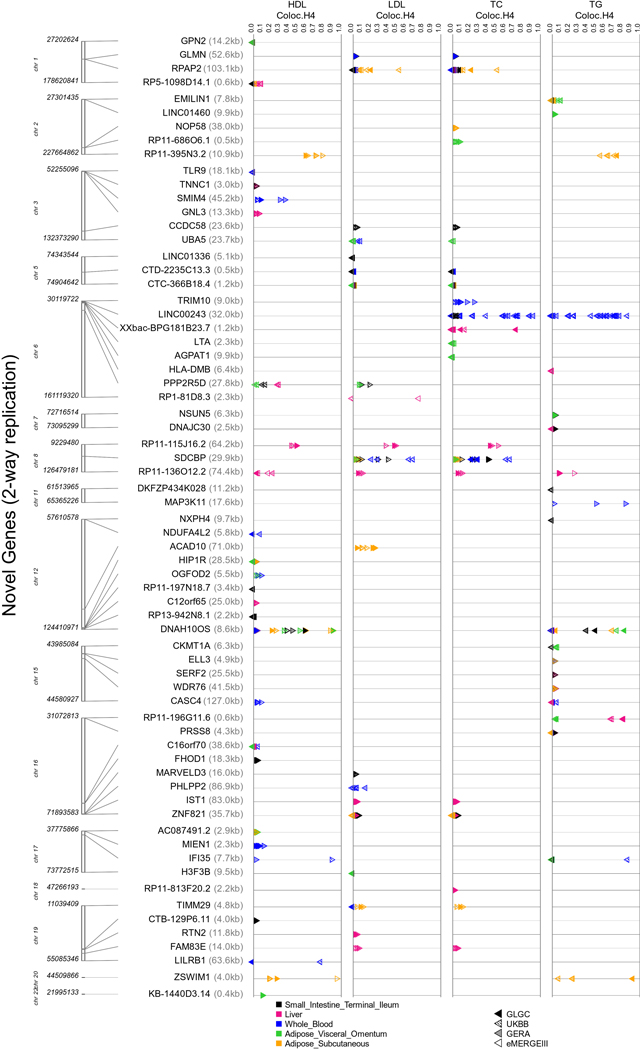
67 novel genes that replicated for the same lipid-tissue combination in at least two cohorts also cleared the coloc H3 filter in at least one cohort (Supplementary Table 1). Extended Data Figures 4 and 5 show across cohorts and tissues (a) the TWAS strength and direction of effects and (b) coloc H4 probabilities, respectively, for the 67 novel genes. Figure 2 and Supplementary Tables 1 and 2 also show the extent of replication of genes for a lipid-tissue pair across the four chosen cohorts. We were able to replicate well-known proof-of-concept genes such as CELSR2, SORT1, and PSRC1 on chromosome 1 (PSRC1 replicated in all four cohorts for the same lipid-tissue combination; Fig. 2) as well as ANGPTL3 and PCSK9 (chromosome 1), APOA1 locus (chromosome 11), and PLTP (chromosome 20). We also saw replication in all four cohorts across all five tissues for previously reported genes such as NRBP1 for TG (chromosome 2), APOA1 for HDL-C (chromosome 11), LPL for HDL-C and TG (chromosome 8), and TMEM258 for TC (chromosome 11). Finally, of the 67 novel genes from lipid TWAS with no LD contamination, 41 genes only “replicated” in two cohorts, 18 only in three cohorts, and 3 in all four cohorts with the same direction of effect for a lipid-tissue combination. The four-way replicating genes with coloc P[H4] > 0.2 were ZSWIM1 for HDL-C in adipose subcutaneous (chromosome 20) and RP11-136O12.2 for HDL-C in liver (chromosome 8). Novel genes with coloc P[H4] > 0.5 included DNAH10OS (chromosome 12), IFI35 (chromosome 17), LILRB1 (chromosome 19), LINC00243 (chromosome 6), RP1-81D8.3 (chromosome 6), RP11-115J16.2 (chromosome 8), RP11-136012.2 (chromosome 8), RP11-3N5N3.2 (chromosome 2), RPAP2 (chromosome 1), SDCBP (chromosome 8), XXbac-BPG181B23.7 (chromosome 6), and ZSWIM1 (chromosome 20). LocusZoom plots (Supplementary Figs. 3–14) reveal the strength of lipid and gene expression signal in the region surrounding the shared index SNP for each of these novel loci. Finally, among novel genes, we also observed evidence of secondary independent associations at the LILRB1 locus (chromosome 19) for HDL-C in whole blood/small intestine (Supplementary Table 1 and Supplementary Fig. 12). Among previously reported genes, we found evidence for secondary signals at ACP2, CCDC92, and FADS2, among others (Supplementary Table 2). Although the strength of signal for novel genes was lower than for previously reported genes, they replicated in two or more cohorts for the same lipid-tissue combination (Fig. 2), making them targets for further validation.
Phase II—Discovery and replication of ICD disease codes.
Once we had our list of 1,033 lipid-associated genes, we devised a workflow that only used SNPs mapping within a 1-Mb region of each of these genes and also overlapped MASHR-based prediction models28 from PredictDB on GTEx v8 release data7,31,32 across 49 available tissues. This resulted in 17,740 and 18,261 SNPs from eMERGE and UKB, respectively (see Online Methods). We collapsed the ICD codes into three-character parent codes (347 traits in eMERGE and 549 traits in UKB) after excluding non-heritable codes and those with fewer than 200 cases (see Online Methods). We then conducted lipid-guided PheWAS and used the summary statistics to conduct Xpress-PheWAS in both cohorts across 49 tissues available in PredictDB for GTEx v8.
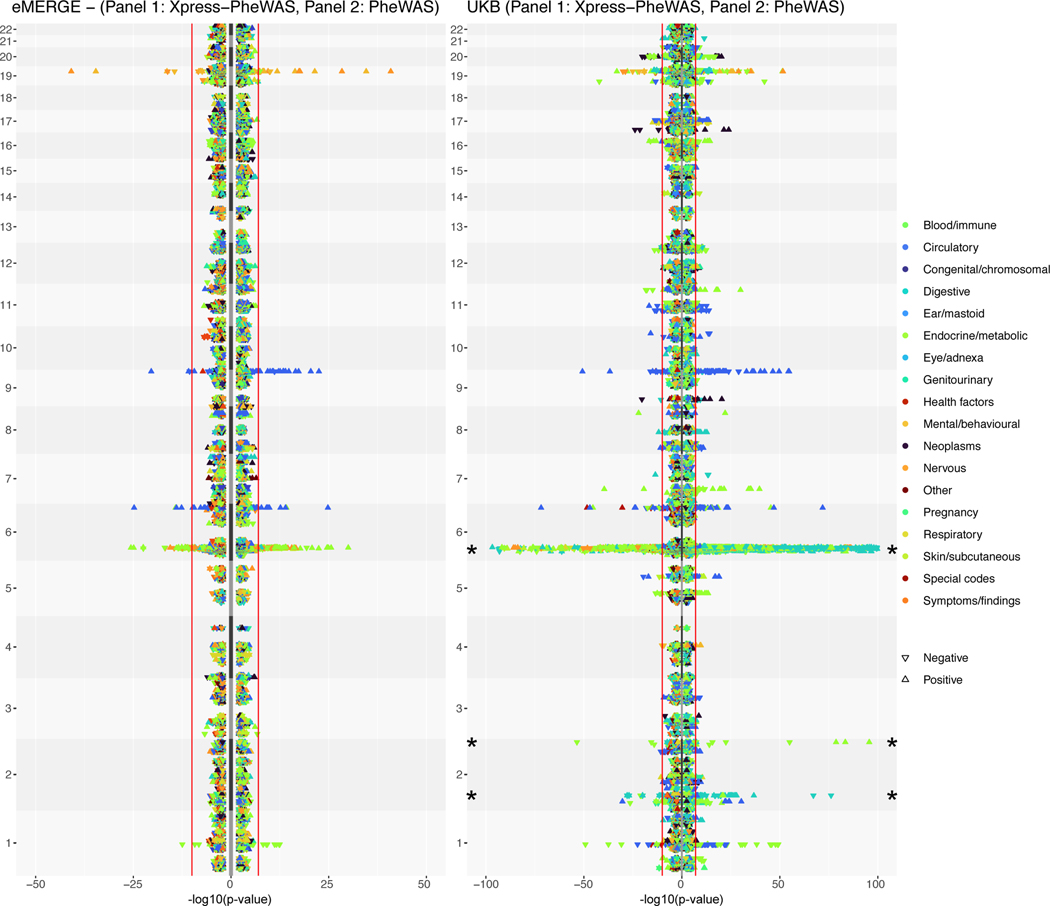
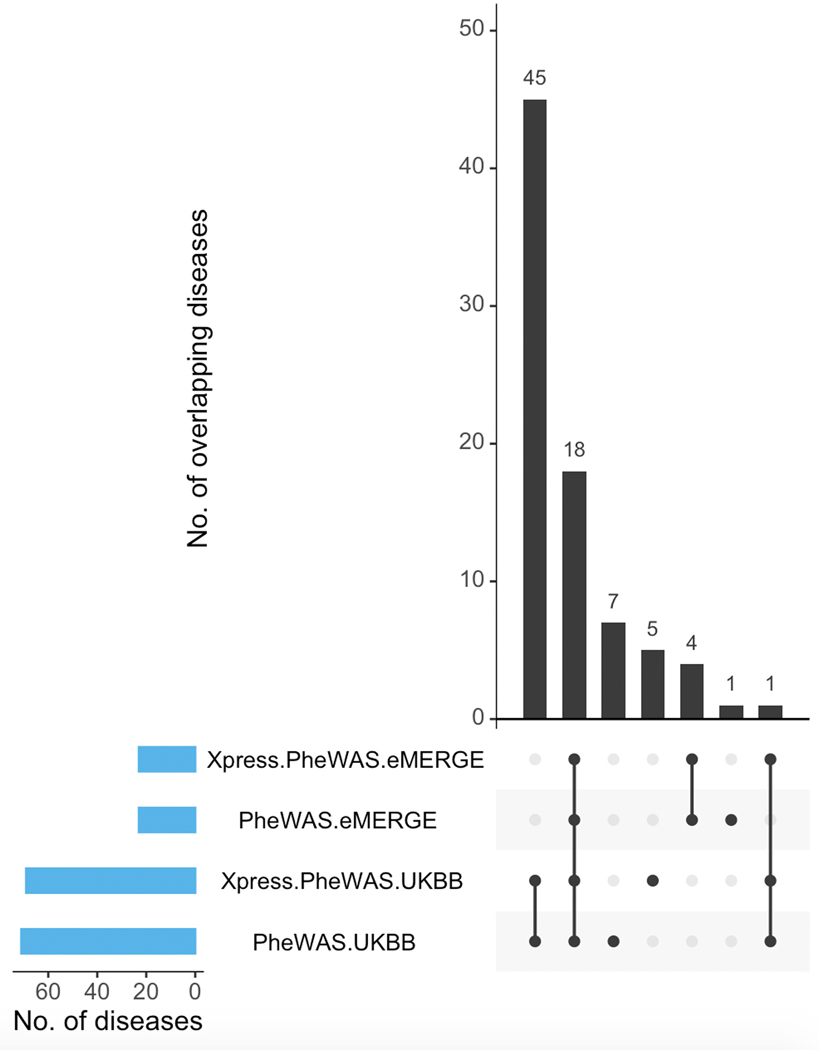
Figure 3 shows the lipid-guided PheWAS and Xpress-PheWAS results from eMERGE and UKB, respectively. In this rotated “Hudson” plot, we see SNP-based signals in the lipid-guided PheWAS plots for eMERGE and UKB (right-hand side of each rotated Hudson plot) and gene-based signals in the Xpress-PheWAS plots (left-hand side of each rotated Hudson plot). We also provide interactive versions of Figure 3 for eMERGE (https://ritchielab.org/nature_genetics/eMERGE_2020-12-11_scaled.html) and UKB (https://ritchielab.org/nature_genetics/UKB_2020-12-11_scaled.html). After mapping the eMERGE ICD-9 codes to ICD-10 using general equivalence mappings33, we observed strong replication of PheWAS signals at the Bonferroni threshold (8.265 × 10⁻⁹ for eMERGE and 4.987 × 10⁻⁹ for UKB; see Online Methods) in both cohorts. The replicated diseases/SNP variants spanned diseases of metabolic, nutritional and endocrine, musculoskeletal, circulatory and nervous systems. There were 18 ICD codes that were detected by lipid-guided PheWAS and Xpress-PheWAS in both eMERGE and UKB (Extended Data Fig. 6), of which six also cleared the coloc P[H3] < 0.5 filter in Xpress-PheWAS, i.e. they had no LD contamination (Supplementary Table 5). These included hypercholesterolemia/disorders of lipoprotein metabolism (chromosome 1), rheumatoid arthritis (chromosome 6 HLA region), pulmonary embolism (chromosome 6 LPA region), and Alzheimer’s disease and senile dementia (chromosome 19). Diseases replicating in the HLA region were all autoimmune diseases (see Supplementary Table 5 for a complete list of detected diseases).
Figure 3 |. Comparison of results between Xpress-PheWAS and lipid-guided PheWAS in eMERGE and UKB.
Plots indicate gene signals from Xpress-PheWAS (left) and SNP signals from lipid-guided PheWAS (right) for eMERGE (left panel) and UKB (right panel). In these rotated Hudson plots, the shape of the point indicates the direction of effect. The colors indicate the corresponding disease category. The red lines indicate the Bonferroni-significant thresholds in either cohort for PheWAS (two-sided logistic regression) and Xpress-PheWAS (see Online Methods). For clarity purposes, we truncated the results for UKB on chromosome 6 and 2 (indicated by asterisk). All indicated points in the plot map to SNPs that lie within 1 Mb of lipid-associated genes from lipid TWAS. See https://ritchielab.org/nature_genetics/eMERGE_2020-12-11_scaled.html and https://ritchielab.org/nature_genetics/UKB_2020-12-11_scaled.html for interactive versions of this plot.
Phase II—Lipid-disease pleiotropy in either cohort.
Lipid-guided PheWAS.
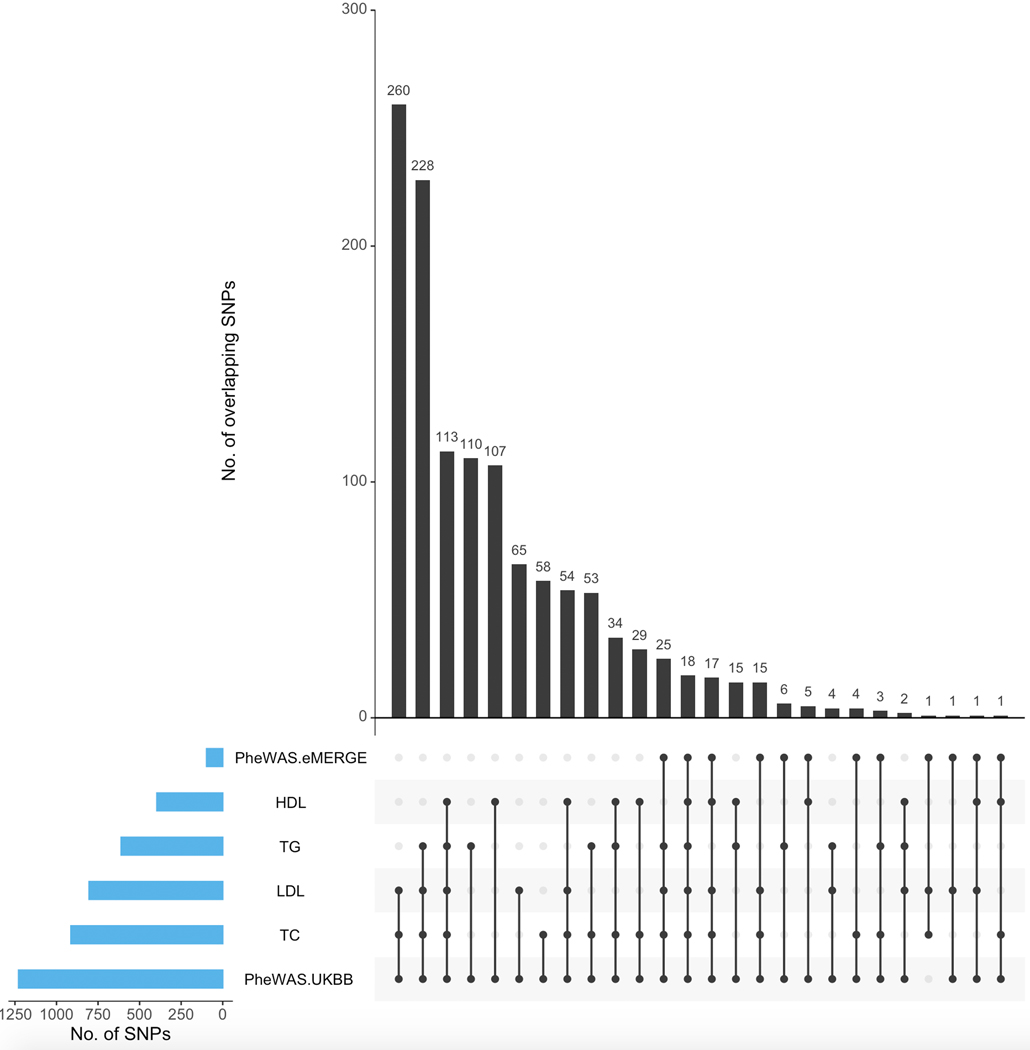
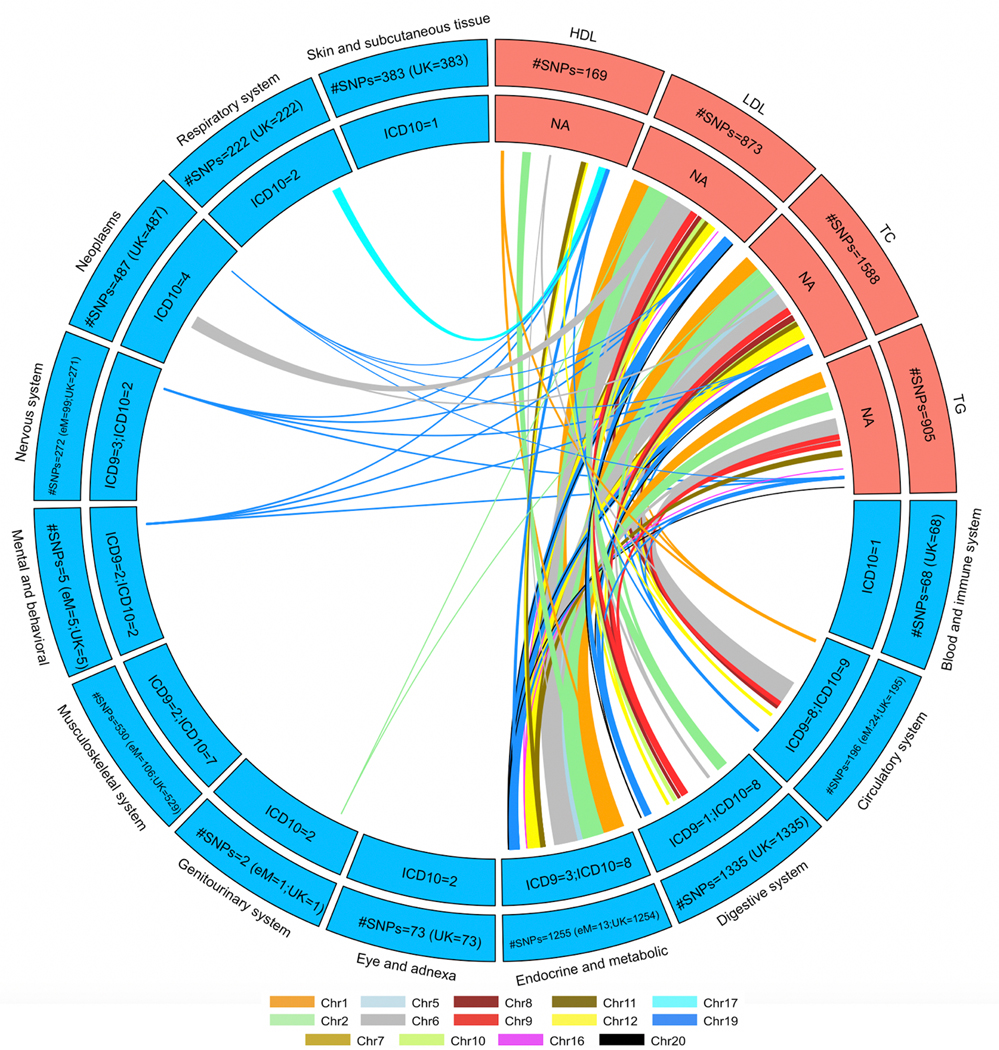
So far, our lipid-guided PheWAS resulted in SNPs that map not just to the lipid-associated genes (from lipid TWAS) but also to some genes neighboring them. Next, we considered lipid-associated SNPs that were also strictly associated with diseases in either eMERGE or UKB. Extended Data Figure 7 shows the number of Bonferroni-significant SNPs overlapping between lipid GWAS (eMERGE, GERA, GLGC, UKB) and lipid-guided PheWAS (eMERGE and UKB). Given its large sample size, the vast majority of these SNPs came from UKB, and pleiotropy between lipids and diseases was observed across the genome (Extended Data Fig. 8). We observed the greatest overlap between ICD codes and LDL-C/TC-associated SNPs, specifically for diseases of metabolic, endocrine, circulatory, and digestive systems (Extended Data Fig. 8). In addition, we also detected lipid-guided PheWAS associations (P < 4.987 × 10⁻⁹) between Bonferroni-significant lipid SNPs (P < 5.000 × 10⁻⁸) and 73 ICD codes from eMERGE or UKB. In addition to ICD codes specified in the previous section, detected diseases included gonarthrosis, nasal polyp, retinal disorders, benign neoplasms of colon, rectum, anus and anal canal, malignant neoplasms of skin, follicular non-Hodgkin’s lymphoma, female genital prolapse, hyperplasia of prostate, cholelithiasis, and asthma among others (Supplementary Tables 3 and 5).
Xpress-PheWAS.
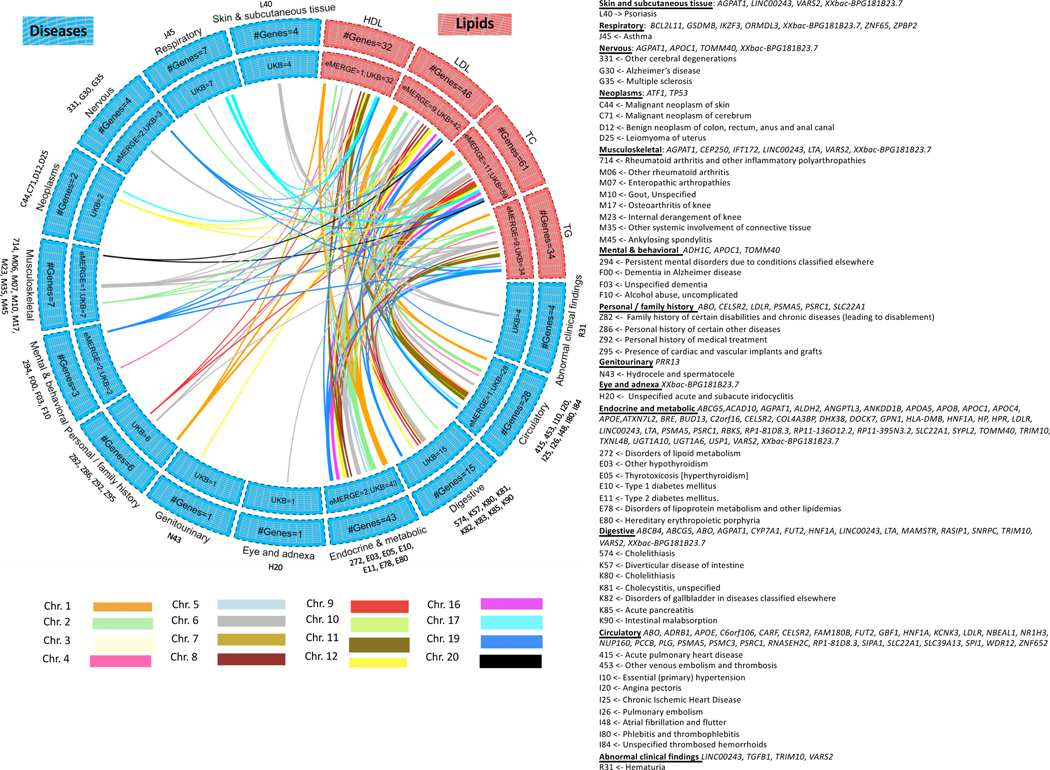
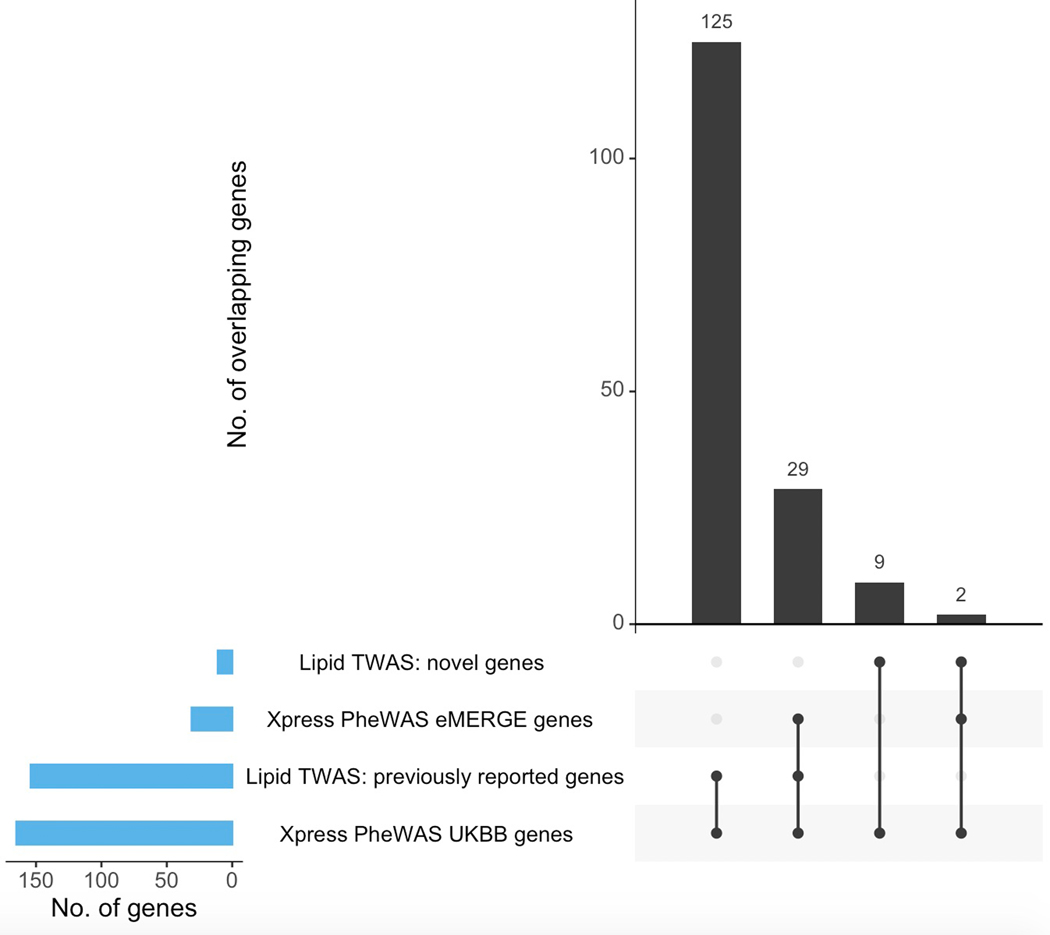
Figure 4 shows the Bonferroni-significant genes (rather than SNPs) from Xpress-PheWAS (P < 5.445 × 10⁻¹⁰ for eMERGE and P < 7.262 × 10⁻¹⁰ for UKB) that were associated with ICD codes in either eMERGE or UKB as well as lipid traits from lipid TWAS (P < 1.390 × 10⁻⁷). In addition, these genes also cleared the coloc P[H3] < 0.5 filter for lipid traits as well as ICD codes in at least one tissue. Similar to lipid-guided PheWAS, the majority of signal came from UKB; 125 genes detected from Xpress-PheWAS in UKB overlapped previously reported lipid genes without the coloc filter (Extended Data Fig. 9). Again, we found evidence of pleiotropy between lipids and a range of disease categories, most of which overlapped with lipid-guided PheWAS; 45 ICD codes were detected from lipid-guided PheWAS and Xpress-PheWAS in UKB (Extended Data Fig. 6). In addition, with the coloc P[H3] < 0.5 filter, Xpress-PheWAS exclusively detected Bonferroni-significant lipid genes also associated with hematuria, leiomyoma of uterus and family history of chronic diseases (Supplementary Tables 4 and 5). LocusZoom plots (Supplementary Figs. 15–23) reveal the strength of lipid/ICD code (top) and gene expression (bottom) signal in the region surrounding the shared index SNP for the loci that had P[H4] > 0.5. These plots help identify the likely causal variant colocalizing between (a) lipids and gene expression and (b) ICD codes and gene expression for a TWAS-significant lipid gene. We also detected putative secondary independent associations at ABO for hemorrhoids, and at novel lipid genes LINC00243 for intestinal malabsorption and Xxbac-BPG181B23.7 for hypothyroidism (Supplementary Table 4 and Supplementary Fig. 23).
Figure 4 |. Lipid-disease pleiotropy from Xpress-PheWAS and colocalization in either eMERGE or UKB.
Circos plots indicate Bonferroni-significant genes from lipid TWAS and Xpress-PheWAS in eMERGE or UKB. We have listed the genes with no LD contamination for both lipids and diseases (i.e. coloc P[H3] < 0.5). Furthermore, these genes also have P[H4] > 0.01 from Xpress-PheWAS. Outer track, number of genes; inner track, number of genes detected in either cohort; links, genes connecting lipids (in salmon) to diseases (in blue); link thickness, number of genes; link color, chromosome. On the right-hand side, we have delineated the list of the ICD-9 or ICD-10 codes corresponding to the disease categories, along with the genes associated with each disease category.
Phase II—Lipid-disease pleiotropy in both cohorts.
Lipid-guided PheWAS.
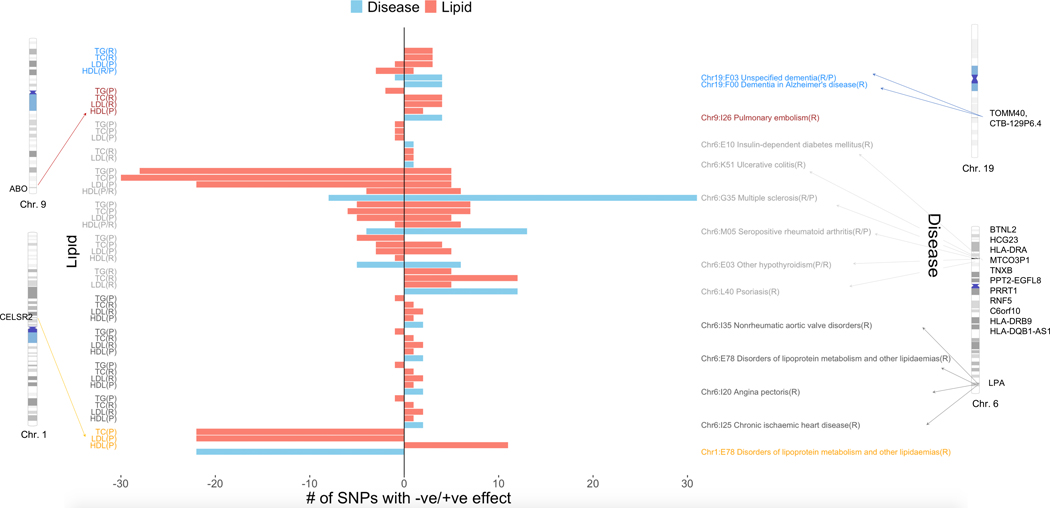
We found a smaller subset of ICD codes when we only considered suggestive pleiotropic variants that replicated in both eMERGE and UKB, on chromosomes 1, 6, 9 and 19 (Fig. 5). These included proof-of-concept SNPs on chromosome 1 that were associated with HDL-C, LDL-C and TC as well as disorders of lipoprotein metabolism and mapped to the previously known CELSR2, SORT1, and PSRC1 lipid genes on chromosome 1. These SNPs had the same direction of effect (protective) for the disease and the lipid traits (Fig. 5), consistent with previous studies34. We were also able to replicate SNPs associated with all four lipid traits and Alzheimer’s disease, mapping to the known APOE and TOMM40 genes on chromosome 19, as well as pulmonary embolism, mapping to the previously known ABO gene on chromosome 935,36. For both pulmonary embolism and Alzheimer’s disease, direction of effect was largely consistent between lipids and disease (concordant). Risk alleles for lipids (positive direction of SNP effect for LDL-C, TC, TG and negative direction of effect for HDL-C) were also seen to be risk alleles for Alzheimer’s disease and pulmonary embolism and likewise for protective alleles (Fig. 5). We also found SNPs in the HLA region on chromosome 6 that were jointly associated with lipids and autoimmune diseases (seropositive rheumatoid arthritis, multiple sclerosis, hypothyroidism, psoriasis and ulcerative colitis) and insulin-dependent diabetes mellitus. Of these we saw opposite direction of effect (risk vs protective) for multiple sclerosis (discordant) and same direction of effect (concordant) for seropositive rheumatoid arthritis (Fig. 5). In other words, SNPs that led to an increase in lipid levels (risk) were associated with decreased effect among multiple sclerosis cases (protective) whereas SNPs that led to a decrease in lipid levels (protective) led to an increased effect among multiple sclerosis cases (risk). The opposite was true for seropositive rheumatoid arthritis. Finally, SNP rs118039278 mapped to the LPA gene on chromosome 6 and was found to be associated with HDL-C, TG, TC, LDL-C as well as angina pectoris, nonrheumatic aortic valve disorders, chronic ischemic heart disease and disorders of lipoprotein metabolism.
Figure 5 |. Concordant/discordant pleiotropy for SNPs that replicate in both eMERGE and UKB for the same lipids/diseases.
Left-hand side y-axis corresponds to lipids whereas right-hand side y-axis corresponds to the diseases. The x-axis corresponds to number of SNPs with net positive vs. negative effect sizes from lipid GWAS (two-sided linear regression) and lipid-guided PheWAS (two-sided logistic regression). We have also shown the chromosomes and base pair positions corresponding to the replicating SNPs on chromosomes 1, 6, 9 and 19. The disease-lipid associations corresponding to different chromosomes are indicated in different colors (blue, chr. 19; maroon, chr. 9; dark gray, chr. 6 HLA region; light gray, chr. 6 LPA region; orange, chr. 1).
Xpress-PheWAS.
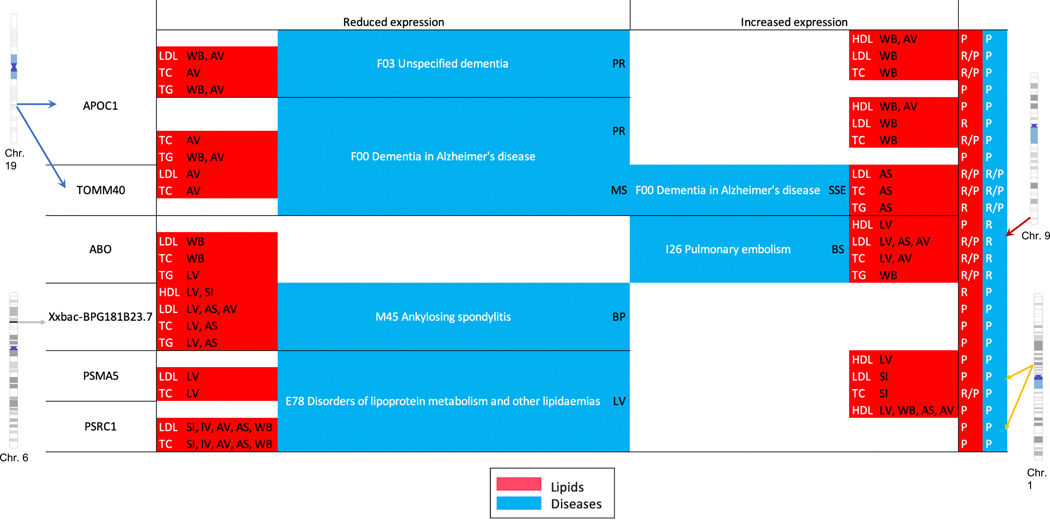
Next, we only considered suggestive pleiotropic ‘genes’ (as opposed to SNPs) that replicated at the Bonferroni-threshold in both eMERGE and UKB on a smaller subset on chromosomes 1, 6, 9 and 19, in addition to having coloc P[H3] < 0.5 (no LD contamination) in both, lipids and diseases (Fig. 6). Similar to our lipid-guided PheWAS, we were able to replicate protective effect of proof-of-concept lipid genes CELSR2, SORT1, and PSRC1 on disorders of lipoprotein metabolism. Finally, we were able to replicate many of the signals found on chromosome 6, 9 and 19 from lipid-guided PheWAS. These genes were associated with pulmonary embolism (ABO) and Alzheimer’s disease (TOMM40, APOC1). We were also able to replicate the (tissue-specific) protective/risk effect of genes for these diseases. Finally, we detected a novel lipid gene Xxbac-BPG181B23.7 on chromosome 6, which was also associated with ankylosing spondylitis in both cohorts (Fig. 6). This long non-coding gene in the HLA region was also found to be associated with 10 other diseases in UKB only (hypothyroidism, multiple sclerosis, psoriasis, asthma, rheumatoid arthritis, insulin-dependent diabetes mellitus, disorders of lipoprotein metabolism, psoriatic and enteropathic arthropathies, iridocyclitis, and intestinal malabsorption (Fig. 4 and Supplementary Figs. 17 and 18).
Figure 6 |. Protective/risk effect genes from Xpress-PheWAS and colocalization that replicate in both eMERGE and UKB for the same lipids/diseases.
Replication is at the Bonferroni threshold with coloc P[H3] < 0.5 and P[H4] > 0.01. Lipids are indicated in red and diseases in blue. The letters in parentheses indicate the tissue in which either reduced/increased expression was observed. AS, adipose subcutaneous; AV, adipose visceral omentum; L, liver; WB, whole blood; SI, small intestine terminal ileum; MS, muscle skeletal; PR, prostate; BS, brain spinal cord cervical c-1; BP, brain putamen basal ganglia; SSE, skin sun exposed lower leg.
Phase III—Lipids as modifiable exposures for disease.
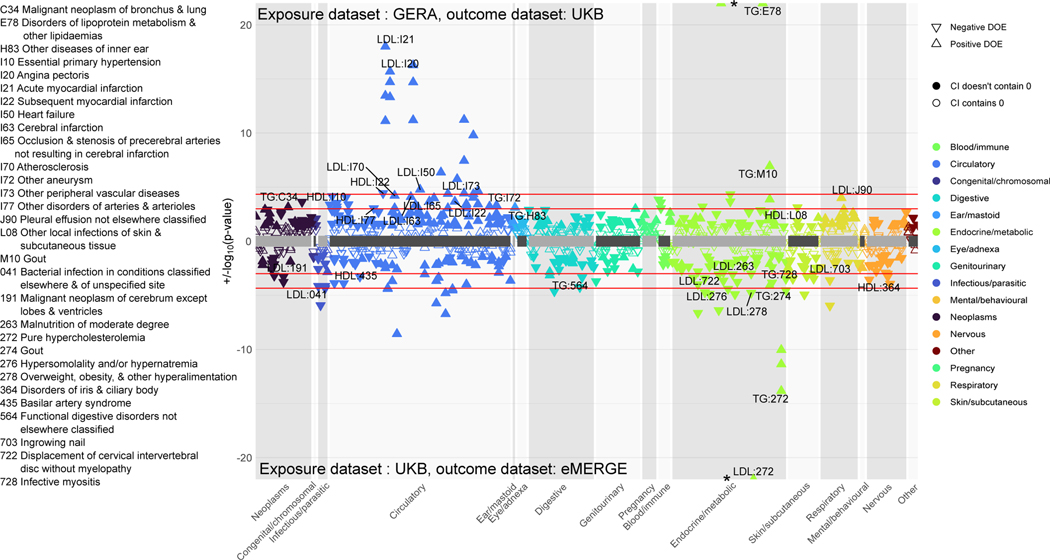
Thus far, we detected SNPs and genes that are suggestive of pleiotropy between lipids and diseases. However, many diseases (especially cardiovascular) are lipid-mediated using curated and independent genetic instruments (SNPs) across the genome. In order to better understand the role that plasma lipids play as modifiable exposures in diseases across the phenome, we conducted univariable two-sample MR on a chosen subset of diseases. As shown in the workflow (Fig. 1, right), we ran these analyses in two sets. In the first set, we used UKB as the exposure (lipid) and eMERGE as the outcome datasets, respectively, and in the second set, we used GERA as the exposure (lipid) and UKB as the outcome datasets, respectively. After LD clumping SNPs with P < 5 × 10⁻⁸ from exposure datasets, we had 183–206 SNPs in set 1 and 53–59 SNPs in set 2 across the selected disease codes (see Online Methods for protocol). Figure 7 shows the MR estimates and P-values for diseases that were Bonferroni-significant using at least one of three methods (inverse variance weighted, Egger and median-based), while Extended Data Figure 10 sheds light on all the SNP-specific MR effects for a chosen set of diseases from these analyses. Gout was a new disease code that we found to be putatively causally associated with lipids at the Bonferroni threshold in both sets. This association remained even after performing analyses upon excluding SNPs from the HLA region (Supplementary Fig. 24). Other novel putative causal associations included disorders of iris and ciliary body, hyperosmolality and hypernatremia, infective myositis, ingrown nails, and malignant neoplasms of bronchus and cerebrum. We also found the expected corroboration of lipid-mediated traits such as hypercholesterolemia/disorders of lipoprotein metabolism (Supplementary Table 6), as well as of other proof-of-concept diseases such as acute myocardial infarction, primary hypertension, acute ischemic heart disease and atherosclerosis (Fig. 7).
Figure 7 |. Two-sample univariable Mendelian randomization.
Top panel: exposure dataset is GERA and outcome dataset is UKB. Bottom panel: exposure dataset is UKB and outcome dataset is eMERGE. The diseases are grouped into different categories; direction of triangle corresponds to direction of MR effect. In each panel, the two red horizontal lines correspond to the Bonferroni and FDR thresholds. We label FDR-significant ICD codes from at least one of three two-sided tests (inverse-variance weighted, Egger, and median-based) with Egger pleiotropy (intercept) P > 0.05 to have evidence of minimal heterogeneity. Filled points have confidence intervals that do not contain 0 whereas non-filled points have confidence intervals that contain 0.
Discussion
In this study, we implemented a comprehensive integrative framework (Fig. 1) to shed light on the landscape of novel and previously reported genetic mechanisms linking lipids to phenome-wide diseases (Fig. 8) in two large cohorts (eMERGE and UKB). This study was conducted in three phases. In Phase I, we developed a framework that integrates TWAS based on fine-mapped eQTLs with statistical colocalization to identify novel genes associated with plasma lipids based on the extent of replication in a lipid-tissue pair across four different cohorts, eMERGE, GERA, GLGC, and UKB (Fig. 2). We detected 79 novel lipid genes from lipid TWAS (67 of which also cleared coloc H3 < 0.5 filter in at least one cohort) and 954 previously reported lipid genes, including proof-of-concept genes such as SORT1. Among the replicating novel genes with coloc P[H3] < 0.5 and coloc P[H4] > 0.5, DNAH10OS (Dynein Axonemal Heavy Chain 10 opposite strand) is a protein-coding gene that has been previously found to be associated with BMI and waist-hip ratio (note that DNAH10 is a known lipid gene); ZSWIM1 (phenylacetyl-glutamine) at the PLTP locus is a lymphocyte-expressed gene that has previously been detected as being lipid associated using a powerful gene-based test37; RP11-395N3.2 on chromosome 2 is a lincRNA that has recently been implicated in waist-hip-ratio/BMI38. The novel lipid-associated genes (Supplementary Table 1) could have evidence for causality and be selected as targets for validation using functional assays.
Figure 8 |. Pictorial depiction of suggestive genetic mechanisms underlying the analyses conducted in this study.
In all three phases, the figure shows the suggestive mechanisms when incorporating DNA, gene expression (RNA), lipids and diseases. The numbers in parentheses indicate the order in which the analyses were performed.
In the second phase of the study, we conducted lipid-guided PheWAS, Xpress-PheWAS (Figs. 3–6), and statistical colocalization to identify potentially pleiotropic associations between lipids and diseases, while in the third phase we conducted two-sample MR (Fig. 7) to detect diseases that are putatively causally associated with lipids. The study hypothesis was that plasma lipids are likely to have broad effects on complex human diseases across the phenome, given several previous studies that allude to direct links between lipids and diseases of multiple organ systems. To our knowledge, this is the most comprehensive study to date that has been carried out to test this hypothesis, and we used an extensive ensemble of methods that has previously not (a) been applied simultaneously on multiple large cohorts, (b) focused on detecting pleiotropy (concordant and discordant) between plasma lipids and diseases, (c) detected several novel and previously reported SNPs and genes as well as putative diseases with causal lipid associations at stringent multiple comparison thresholds with replication, and (d) integrated four types of data (genetics, gene expression, EHR, and plasma lipids). While a previous study investigated the overall landscape of genome-wide pleiotropy18, it had a high case threshold (>10,000) that resulted in several untested diseases. Also, it did not discuss extent of replication of results or focus on pleiotropy with lipids. Importantly, our analyses are very focused and time-effective as we only ran PheWAS on approximately 18,000 fine-mapped eQTLs that mapped to lipid (and neighborhood) genes. Finally, we also present a tool to conduct colocalization integrated with conditional analyses on a chosen set of genes of interest. Our tool can not only identify TWAS-significant genes with no LD contamination but also detect secondary signals at a locus mapping to any of the gene(s) of interest.
Many signals from the HLA region (as reported in a previous UKB study39) correspond to lipid and immune-related pathways (Supplementary Fig. 25). Notably, we saw opposite direction of effect for SNPs/genes between lipids and multiple sclerosis. One explanation for this could be that, since multiple sclerosis is a chronic inflammatory disease in which immune system attacks the fatty myelin sheaths surrounding nerve fibres40,41, reduced cholesterol synthesis (and secretion) could confer greater sensitivity of the myelin to T-cell attack, and thus multiple sclerosis. Also notable is that our two-sample MR analyses did not suggest a causal association between lipids and multiple sclerosis. We also detected two novel lipid genes LINC00243 and XXbac-BPG181B23.7 (also known as LINC01149) in the HLA region that mapped to several immune-related diseases with P[H4] > 0.5, with some diseases even having putative secondary independent associations at these loci. Long non-coding RNAs are non-protein coding RNA transcripts > 200 nucleotides in length but can also be classified by genomic location42. Although they are less conserved than protein-coding genes with relatively lower gene expression, they have high tissue specificity, and their promoter regions have high sequence conservation that often make them dysregulated in disease43. These two long non-coding genes have recently been implicated in cancer44,45.
Other novel findings include TG mediation for gout using two-sample MR; this result has been corroborated in a recent study46. MR analyses also revealed diseases with putative causal lipid effects such as neoplasms of bronchus and cerebrum; phospholipid profiles have shown alterations among non-small cell lung cancer patients47, while lung cancer tumor tissues have been found to have elevated levels of triacylglycerols48. A recent study also found that metastatic brain tumors alter lipid metabolism within metastases due to loss of Mfsd2a expression in tumor endothelium49. Other such MR results were found for skin and subcutaneous tissue infections, which have been known to be closely associated with glucose and lipid metabolism50 and hypernatremia (excessive sodium in blood); a previous study showed that elevated sodium levels in blood resulted in lipid accumulation in cultured adipocytes51 and suggested direct causal effects on lipid metabolism.
We detected several novel genes/SNPs suggestive of pleiotropy as well, especially for hitherto untested disease categories in UKB. For instance, Xpress-PheWAS analyses detected TP53 on chromosome 17 that was associated with HDL-C as well as leiomyomas of uterus (coloc P[H4] = 0.49) and malignant neoplasms of skin and brain in adipose subcutaneous tissue (among others; see Supplementary Table 4). p53 protein has been previously found to have a novel role in regulating lipid metabolism pathways52 as well as for its tumor suppressive functions53,54. However, in our study, SNPs mapping to these genes were not detected from lipid-guided PheWAS, indicating that integrating gene expression information with SNPs likely boosted our signal55. This helps us shed some light on the underlying genetic architecture of the relationship between HDL-C and neoplasms for TP53. On the other hand, lipid-guided PheWAS analyses detected three polymorphisms associated with female genetic prolapse (ICD code: N81) mapping to GDF7 on chromosome 2, of which one SNP rs9306894 has been previously associated with pelvic organ prolapse in UKB56. Although we also detected GDF7 from Xpress-PheWAS, colocalization analyses filtered out this gene, revealing that PheWAS-based associations found in the literature might not always colocalize with eQTLs.
Finally, the limitations of this study are that TWAS and Xpress-PheWAS cannot distinguish between horizontal pleiotropy and direct gene expression mediation between SNPs and trait. They can also result in false positive associations due to LD mismatch between GWAS and expression panel, underlying biases in expression panel, and sharing of eQTLs with truly causal genes57. We addressed this by using a comprehensive ensemble of methods in multiple cohorts with stringent multiple comparison filters to reduce false positive associations. Another caveat is that certain disease diagnosis codes are absent in one cohort and not the other, making it difficult to do equivalence mapping between ICD-9 and ICD-10 based cohorts (for replication). A third caveat is the absence of some genes in prediction models of some tissues in PredictDB. We also restrict our analyses to common variants in individuals of European ancestry only in order to avoid genetic heterogeneity. Future work should extend this framework to diverse ancestry groups as well as rare variants.
In conclusion, we have characterized the landscape of pleiotropy between plasma lipids and diseases from EHR using a comprehensive suite of methods. Our results provide fresh insights into the genetic relationships underlying lipids and diseases, while our integrative analytical framework can be applied to similarly study pleiotropy for other sets of traits.
Online Methods
Ethics.
Research conducted in this study complies with all ethical regulations laid out in the Declaration of Helsinki. This study was performed in the electronic Medical Records and Genomics (eMERGE) Network, which is a funded consortium sponsored by the National Human Genome Research Institute that combined biorepositories with EHR across leading medical institutions. All studies were approved by Institutional Review Boards of each respective institution. Each participant gave consent for being part of the DNA biobanks. Data from UKB for this project pertained to application 32133.
Datasets.
Individual-level data were obtained from the eMERGE network Phase III and the UK Biobank. eMERGE network Phase III comprises 99,185 genotyped samples across multiple platforms that were imputed to Haplotype Reference Consortium 1.1 and covered approximately 39 million SNP variants across 78 array genotype batches. The eMERGE sites included in our study were Marshfield Clinic Research Foundation, Vanderbilt University Medical Center, Washington University, Columbia University Health Sciences, Mayo Clinic, Northwestern University, Geisinger, Mt Sinai, Meharry Medical College, and Harvard University. Since we focused on adults only, we did not include individuals from Boston Children’s Hospital, Cincinnati Children’s Hospital Medical Center, and Children’s Hospital of Philadelphia. UK Biobank release 2 has deep genetic and phenotypic data on ~500,000 individuals across the United Kingdom that were genotyped on two genotype arrays across 106 batches and imputed to 96 million variants.
We used the ‘best-practice’ QC pipeline to clean eMERGE Phase III imputed genotypic data58. We included genetic variants with genotype call rate > 99% and sample call rate > 99%. We further removed monomorphic, duplicated, and palindromic variants and filtered variants with a mean imputation score < 0.3 compared to European population from 1000 Genomes Project. Finally, we removed variants with minor allele frequency (MAF) < 1%. We only retained European Americans and estimated identity-by-descent using PLINK 1.959. We dropped one of a pair of related individuals with pi_hat > 0.25. We also excluded SNPs with Hardy-Weinberg Equilibrium exact test P < 1 × 10⁻¹⁰ and removed individuals with ambiguous sex. There were 7,666,566 SNPs and 47,229 unrelated European American individuals remaining after quality control procedures.
For quality control in the UKB, we excluded individuals with poor quality genotyping according to a previous publication11. We dropped one of a pair of related individuals with pi-hat > 0.25 and those with mismatches between self-reported and genetically inferred sex. We also excluded variants with an imputation info score < 0.3 and MAF < 0.01 and with Hardy-Weinberg Equilibrium exact test P < 1 × 10⁻¹⁰. European ancestry individuals were extracted using self-reported white British ancestry. Since age at recruitment for the UKB cohort is 40–6911, we did not apply any age filter. After quality control, there were 377,921 individuals and 8,284,910 SNPs included for analysis. We used the first 20 PCs that were provided by the data release for the association analyses11.
Phenotypes were defined based on the International Statistical Classification of Diseases and Related Health Problems (ICD) diagnosis codes extracted from EHR. eMERGE has predominantly ICD-9 disease classification whereas UKB has predominantly ICD-10 disease classification. We converted ICD-9 codes to ICD-10 codes in UKB and vice versa for eMERGE using general equivalence mappings33 and manual curation. We first collapsed the ICD-9 and ICD-10 disease codes to three-character “parent-codes”. This was done to avoid shortcomings due to variability in coding practices across health systems, increase the sample size of cases per parent-code, and reduce the multiple comparison burden after statistical analyses. We will refer to these parent codes as ICD codes in this manuscript. For UKB, a person was either assigned as a “case” or as a “control” for an ICD code if that person was or was not given that ICD code diagnosis. For the longitudinal data in eMERGE, we applied a “rule of three” on ICD codes to define case status; in other words, a person would be assigned as a “case” for a certain ICD code if they had three or more occurrences of the ICD code on different clinic visits, they would be assigned an “NA” status with one or two occurrences of the ICD code, or a “control” status with no occurrences of the ICD code. We used this approach to assign case status for all available ICD codes. We excluded non-heritable ICD codes from both UKB and eMERGE; these included abnormal clinical laboratory signs and symptoms, injury, poisoning, burns, accidents, and other external causes or morbidity or mortality, and factors influencing contact with health services. We subsequently retained only those ICD codes that had at least 200 cases. There remained 549 ICD codes in UKB and 347 ICD codes in eMERGE after applying quality control procedures. Due to their low number of case-counts across ICD codes (which led to convergence issues), we removed Columbia University Health Sciences and Mt Sinai from lipid-guided PheWAS analyses, leaving us with a sample size of 41,981 unrelated individuals of European ancestry for lipid-guided PheWAS.
Summary-level data for the four lipid traits were obtained from (i) the Global Lipids Genetics Consortium (GLGC) 20133, which comprised 188,578 European-ancestry individuals and 7,898 non-European individuals, and (ii) the European population in the multi-ethnic Genetic Epidemiology Resource on Adult Health and Aging (GERA5) cohort. The GERA cohort comprised 76,627 non-Hispanic white individuals with 44,856 females and 31,771 males.
Phase I—Lipids only.
Lipid GWAS framework.
For eMERGE, the lipid data available to us had multiple measurements for each individual patient so we decided to use median lipid values for GWAS analyses. For individuals with an even number of measurements, the median lipid value was chosen as whichever of the two central measurements was closest to the mean, and the age at which that measurement was made was used as the associated age in subsequent analyses. For individuals with only one lipid measurement, that measurement was considered the median. For individuals who had only two measurements or identical measurements on different dates, the earliest date on which that value was measured was chosen as associated age. We filtered on age > 18. We removed individuals with phenotypic values greater than three times the standard deviation since they skewed the distribution, and we log transformed triglyceride values to approximate a normal distribution. We sex stratified the phenotypes and regressed them on age, age2, batch, statin medication, and first six ancestry-derived principal components. Statin medication was a binary variable corresponding to whether or not a patient received statin. We finally stacked together the sex-stratified inverse-normalized residuals and used them as the response in all subsequent GWAS analyses. All GWAS analyses were run on PLINK 2.059. The genomic control inflation was <1.1 for each of the four lipid traits with the lowest being 1.04 (for LDL-C). After QC assessments there only remained European American adults with n = 31,565 (14,775 males and 16,790 females) for HDL-C, n = 30,509 (14,374 males and 16,135 females) for LDL-C, n = 31,575 (14,747 males and 16,828 females) for TC, and n = 31,074 (14,638 males and 16,436 females) for TG in eMERGE.
For UKB, similar to eMERGE, we used medians of first two lipid measurements in our GWAS analyses. We again removed individuals with phenotypic values greater than three times the standard deviation since they skewed the distribution, and we log transformed triglyceride values to approximate a normal distribution. We sex stratified the phenotypes and regressed them on age, age2, batch, lipid medication (codes 6153 and 6177) and 20 ancestry-derived principal components. Lipid medication variable was dichotomized by setting all patients that received cholesterol lowering medication to one and the remaining patients to zero. Patients that did not know or chose not to respond were set to missing. Similar to eMERGE, we stacked together the sex-stratified inverse-normalized residuals and used them as the response in all subsequent GWAS analyses. All GWAS were run on PLINK 2.0. We subsequently adjusted for an LD score regression intercept60 of 1.1 since even very subtle stratification/polygenicity could be exacerbated with large sample sizes61 and we were more interested in robustness of our results and reduced number of false positive associations. After QC assessments, there only remained individuals (adults) of white British ancestry with n = 329,480 (153,509 males and 175,971 females) for HDL-C, n = 358,482 (165,546 males and 192,936 females) for LDL-C, n = 359,096 (165,876 males and 193,220 females) for TC, and n = 357,709 (164,797 males and 192,912 females) for TG.
Lipid TWAS framework.
We used tissue-specific weights from five tissues in the Genotype Tissue Expression (GTEx) Consortium v8: adipose subcutaneous (n = 581), adipose visceral omentum (n = 469), whole blood (n = 670), small intestine terminal ileum (n = 174), and liver (n = 208) using the MASHR model (www.predictdb.org). S-PrediXcan was used to perform TWAS for the four lipid traits in all four cohorts (eMERGE, UKB, GERA, and GLGC). We devised a new workflow by building upon the one proposed by Barbeira et al.7. Based on the protocol delineated here (https://github.com/hakyimlab/MetaXcan/wiki/Tutorial:-GTEx-v8-MASH-models-integration-with-a-Coronary-Artery-Disease-GWAS), we first harmonized our results with GTEx v8, imputed missing GWAS summary statistics in sub-batches using present GTEx v8 summary statistics in a region-based approach based on Berisa-Pickrell62 LD blocks, and finally merged the imputed results together prior to running S-PrediXcan on each of the five tissues.
Novel vs. previously reported genes.
We first obtained Bonferroni-significant TWAS associations in each cohort (across all lipid-tissue combinations). We then investigated the GWAS Catalog63 and GRASP64 as well as previous literature for TWAS, colocalization analyses, candidate-gene analyses, gene-based aggregate tests, and exome-WAS applied to lipid traits and divided the obtained signals into “novel” and “previously reported” categories. We subsequently looked for associations in the “novel” category that “replicate” at least twice; we defined as a “replication” any gene that cleared the Bonferroni threshold and had the same direction of effect for the same lipid-tissue pair in at least two cohorts.
LD-contaminated gene removal.
We removed LD-contaminated associations by performing statistical colocalization on the results obtained in the previous step on a gene-by-gene basis. For running colocalization29, we first identified a list of TWAS-significant genes and corresponding lipid traits and tissues across the four cohorts. Next, for each gene-lipid-tissue-GWAS cohort combination, we identified all the SNPs in the GWAS cohort that were within a 1-Mb region from the TSS and TES of the gene. Of these, we considered as “lead SNPs” all SNPs in the GWAS cohort with P < 0.0001 that were 200–400 kb apart from each other.
For primary signals, we collected the SNPs overlapping between GWAS and eQTL datasets in a 200-kb window on either side of each lead SNP. We subsequently estimated the coloc29 probability of H3 (alternative hypothesis that eQTL and GWAS associations correspond to independent signals) and H4 (alternative hypothesis that eQTL and GWAS associations correspond to the same signal) for the lead SNP. We assumed a prior probability that a SNP is associated with (1) lipid phenotype = 1 × 10⁻⁴, (2) gene expression = 1 × 10⁻⁴, and (3) both GWAS and gene expression = 1 × 10⁻⁶ for all coloc analyses. For the given gene, we then selected the lead SNP with the highest P[H4] and P[H3] < 0.5.
For secondary signals, we used the following GCTA-COJO (v1.26) protocol in the GWAS and eQTL datasets for each lead SNP to identify potential secondary independent associations at a locus. We ran GCTA-COJO to perform association analysis on all SNPs conditioned on the top-associated eQTL (P < 0.001) at that locus using the --cojo-cond option. We used 5,000 randomly chosen European American adults from eMERGE as the reference dataset to calculate pairwise LD in eMERGE, GERA, and GLGC; we used 5,000 randomly chosen adults of white British ancestry from UKB as a reference dataset for UKB. We then used the conditional P-values from COJO in coloc to identify potential secondary signals between the lipid trait and gene expression using the same protocol for primary signals as delineated above.
We repeated this protocol for TWAS-significant genes across all combinations of GWAS cohort, lipid trait and tissue and filtered out genes for which all lead SNPs had P[H3] ≥ 0.5, which were termed “LD-contaminated genes”. Code for this step is shared here (https://github.com/RitchieLab/Gene-level-statistical-colocalization). We prioritized “novel” TWAS-significant genes that cleared coloc filters for further functional assays to determine causality.
Phase II—Phenome-wide analyses.
Lipid-guided PheWAS.
We obtained the set of lipid-associated genes from TWAS and extracted the SNPs mapping to these genes that also overlapped the SNPs with non-zero weights in the PredictDB MASHR databases (GTEx v8). These SNPs mapped to 79 novel lipid-associated genes, 954 previously reported lipid-associated genes, and genes neighboring these that lie within a 1-Mb interval upstream and downstream from the transcription start and end sites of each of the 1,033 genes, in accordance with the protocols followed by S-PrediXcan. There were 17,740 such SNPs from eMERGE and 18,261 SNPs from UKB. We ran PheWAS on 347 ICD codes in eMERGE and 549 ICD codes in UKB using logistic regression in PLINK 2.059 with firth regression option. We used age, sex, site and first four marker-derived PCs as covariates for eMERGE and age, sex, genotyping batch and twenty marker-derived PCs as covariates for UKB across all ICD codes. Post QC, there remained 41,981 European American adults in eMERGE (19,556 males and 22,425 females) and 377,921 individuals of white British ancestry (203,087 females and 174,384 males) for PheWAS analyses. For codes that were sex-specific, we ran sex-stratified logistic regression analyses after excluding sex as a covariate. We set a Bonferroni multiple comparison threshold of 0.05/(number of SNPs × number of phenotypes) = 8.266 × 10⁻⁹ for eMERGE and 4.987 × 10⁻⁹ for UKB.
Xpress-PheWAS.
Similar to the lipid GWAS, we used S-PrediXcan to perform expression-based PheWAS (or Xpress-PheWAS) on summary statistics from lipid-guided PheWAS across all considered ICD codes from eMERGE and UKB in each of the 49 available tissues in PredictDB for GTEx v8. Similar to Phase I, we first harmonized our results with GTEx v8, imputed missing GWAS summary statistics in sub-batches using present GTEx summary statistics, and finally merged the imputed results together prior to running S-PrediXcan on all available tissues. Note that the genes used in these analyses included those obtained from lipid TWAS (novel and previously reported) as well as any neighboring genes. We set a Bonferroni multiple comparison threshold of 0.05/(number of tissues × number of genes × number of phenotypes) = 5.445 × 10⁻¹⁰ for eMERGE and 7.262 × 10⁻¹⁰ for UKB. Similar to lipid TWAS, we again retained all Bonferroni-significant associations.
LD-contaminated gene removal.
We used the same protocol as in Phase I for these analyses with the exception that the response variable corresponding to lipid-guided PheWAS in coloc was treated as case-control (disease) instead of quantitative (lipid).
Phase III—Mendelian randomization.
We conducted two sets of analyses. For both sets of analyses, we used lipids (HDL-C, LDL-C, and TG) as exposure variables and ICD codes as the outcome. We excluded TC from our analyses as it is simply a function of HDL-C and LDL-C. In set 1, we used lipid-associated SNPs with P < 5 × 10⁻⁸ from UKB as instruments and all ICD codes from eMERGE. In set 2, we used lipid-associated SNPs with P < 5 × 10⁻⁸ from GERA as instruments and all ICD codes from UKB. We LD-clumped lipid-significant SNPs (r2 <0.01) for each of the three lipids. We harmonized the SNPs between exposure and outcome in each set using the MR-base package. We applied MR-PRESSO65 beta exposure test to screen diseases that yielded P < 0.05 and (if necessary) eliminated SNPs that failed the MR-PRESSO65 outlier test. Subsequently, we conducted univariable two-sample MR (Egger, inverse variance weighted, and median) separately on each of the three lipid traits using the built-in LD correlation matrix obtained from 1000 Genomes European population. We compiled MR results that were significant at the FDR-significance threshold (0.001) using one of the three methods. We further filtered down the resulting traits to those that also have Egger pleiotropy (intercept) P > 0.05 to have evidence of minimal heterogeneity. All analyses were conducted using the MendelianRandomization66 and MR-base67 (v4.0.3) R packages.
Data visualization.
A modified version of the Hudson R package68 (https://github.com/anastasia-lucas/hudson) was used for comparing association results from eMERGE and UKB (Fig. 3). A modified version of Synthesis-view (http://visualization.ritchielab.org/synthesis_views/plot) was used to make Extended Data Figures 4 and 5. The Venn diagrams (Supplementary Figs. 1 and 2, and Extended Data Figs. 6, 7, and 9) were created by UpSetR (v1.4.0) in R69. Pleiotropy between lipids and disease categories was visualized using the circlize package v0.4.12.1004 in R70 (Fig. 4 and Extended Data Fig. 8). LocusZoom was used to generate regional LD plots71 (Supplementary Figs. 3–23). The SNP-wise MR plots (Extended Data Fig. 10) was made using the two-sample MR package in the MR-base platform (v4.0.3) in R67. The over representation analysis (Supplementary Fig. 25) was conducted on webgestalt (http://www.webgestalt.org/).
Data Availability
This project corresponds to UK Biobank application ID 32133 and eMERGE Network Phase III (dbGaP study accession number phs001584.v1.p1). Lipid GWAS summary statistics for GLGC 20133 are publicly available for download (http://csg.sph.umich.edu/willer/public/lipids2013/). Lipid GWAS summary statistics for GERA5 are available via dbGaP (accession number phs000674.v2.p2). Expression prediction models with LD reference data using MASHR are available on Zenodo (https://zenodo.org/record/3518299/files/mashr_eqtl.tar?download=1). GTEx Analysis Release v8 (dbGaP Accession phs000424.v8.p2) is available for download via the GTEx Portal (https://gtexportal.org/home/datasets). Summary statistics for lipid GWAS, lipid TWAS, lipid guided PheWAS and Xpress PheWAS generated in this study are available on Figshare (https://figshare.com/s/d62961bbc6c45c8dc2b0).
Code Availability
Code for identifying LD-contaminated genes and detecting secondary independent associations at a locus is shared on GitHub (https://github.com/RitchieLab/Gene-level-statistical-colocalization).
Extended Data
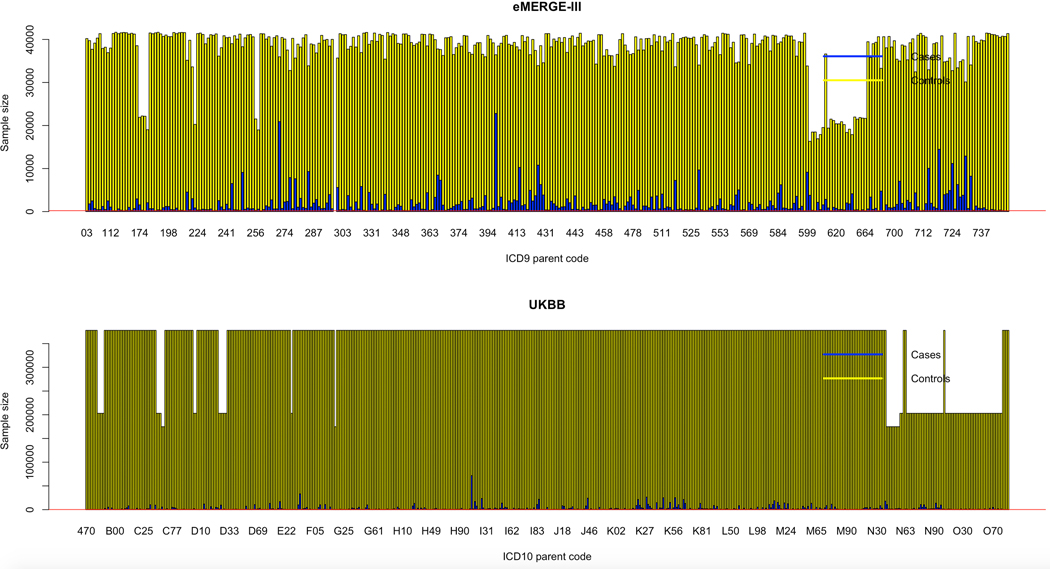
Extended Data Fig. 1. Case-control distribution for ICD codes.
Distribution of cases (blue) and controls (yellow) for the collapsed 3-digit ICD codes in eMERGE (top) and UKB (bottom). eMERGE has predominantly ICD-9 codes whereas UKB has predominantly ICD-10 codes.
Extended Data Fig. 2. Lipid GWAS in eMERGE.
Manhattan plots from GWAS (two-sided linear regression) conducted on the four plasma lipid traits (HDL-C, LDL-C, TC, TG) for the eMERGE cohort. In each plot we have chromosomes 1 to 22 on the x-axis and −log(P) value on the y-axis.
Extended Data Fig. 3. Lipid GWAS in UKB.
Manhattan plots from GWAS (two-sided linear regression) conducted on the four plasma lipid traits (HDL-C, LDL-C, TC, TG) for the UKB cohort. In each plot we have chromosomes 1 to 22 on the x-axis and −log(P) value on the y-axis.
Extended Data Fig. 4. Lipid TWAS P-values for novel lipid genes.
Synthesis-view plot indicating −log10 P-values for Bonferroni-significant “novel” genes (two-sided gene-based tests: P < 5.57 × 10⁻⁷) from lipid TWAS. These genes passed coloc P[H3] < 0.5 filter in at least one cohort. The direction of triangle corresponds to the direction of gene-effect from TWAS (left facing-negative and right facing-positive). Colors indicate the five selected tissues from GTEx v8 (adipose subcutaneous, adipose visceral omentum, liver, small intestine terminal ileum, whole blood).
Extended Data Fig. 5. Colocalization probabilities of shared causal variant between lipids and gene expression for novel lipid genes.
Synthesis-view plot indicating coloc P[H4] for Bonferroni-significant “novel” genes (two-sided gene-based tests: P < 5.57 × 10⁻⁷) obtained from lipid TWAS. These genes passed coloc P[H3] < 0.5 filter in at least one cohort. The direction of triangle corresponds to the direction of gene-effect from TWAS (left facing-negative and right facing-positive). Colors indicate the five selected tissues from GTEx v8 (adipose subcutaneous, adipose visceral omentum, liver, small intestine terminal ileum, whole blood). We present coloc results for all regions corresponding to a gene.
Extended Data Fig. 6. Overlap of detected ICD codes between cohorts.
UpSet plot indicating overlap of diseases (ICD codes) with Bonferroni-significant genes between PheWAS and Xpress-PheWAS conducted on eMERGE and UKB, respectively.
Extended Data Fig. 7. Overlap of significant SNPs between lipid GWAS and lipid-guided PheWAS across cohorts.
UpSet plot indicating overlap of GWAS-significant SNPs (Bonferroni threshold) between each of the four plasma lipids (HDL-C, LDL-C, TC, TG) aggregated across the four considered cohorts (eMERGE, GERA, GLGC, UKB) and lipid-guided PheWAS conducted in eMERGE and UKB, respectively.
Extended Data Fig. 8. Lipid-disease pleiotropy from lipid-guided PheWAS in either eMERGE or UKB.
Circos plot indicates Bonferroni-significant SNPs in either cohort (eMERGE or UKB) from lipid-guided PheWAS (two-sided logistic regression). Outer track, the number of SNPs detected in either cohort; inner track, significant ICD codes per disease category. Links, SNPs connecting lipids (in salmon) to diseases (in blue); link thickness, # SNPs; link color, chromosome. Due to large number of SNP associations involved, this plot does not show associations (links) in the HLA region (chromosome 6).
Extended Data Fig. 9. Overlap of significant genes between lipid TWAS and Xpress-PheWAS across cohorts.
UpSet plot indicating overlap of detected Bonferroni-significant genes between lipid TWAS and Xpress-PheWAS conducted on eMERGE and UKB, respectively. Lipid TWAS genes have been split into two categories: (1) novel; (2) previously reported.
Extended Data Fig. 10. Effect sizes and confidence intervals from two-sample univariable Mendelian randomization analyses.
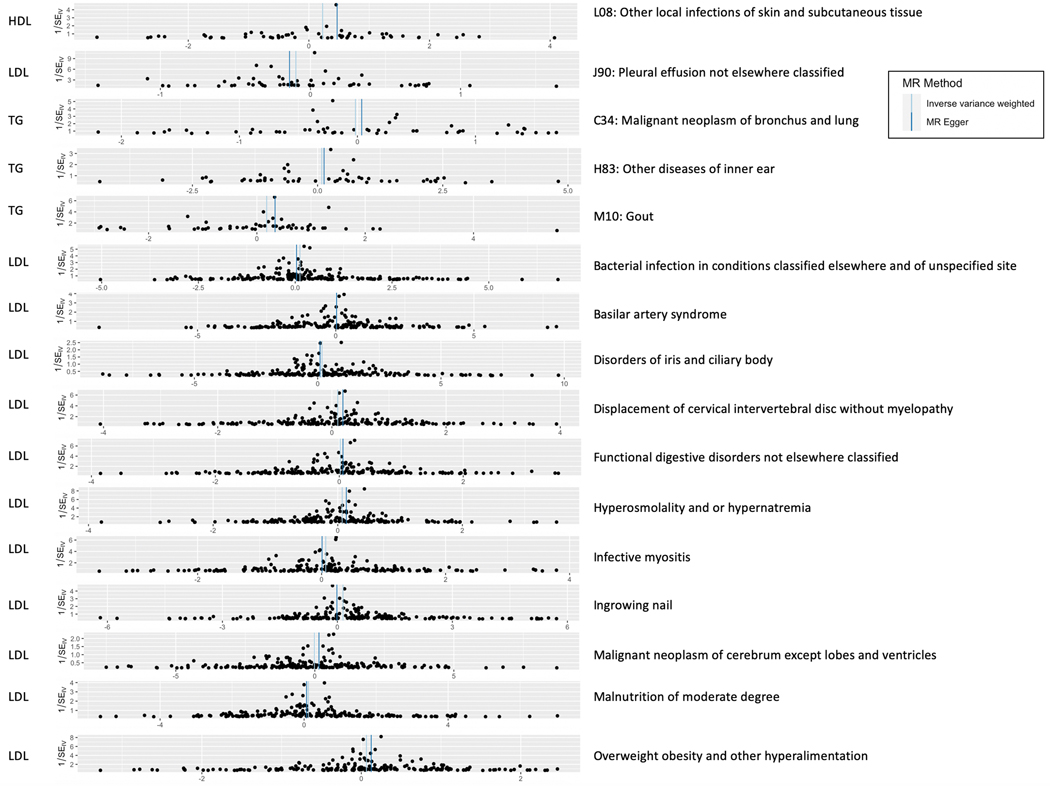
Mendelian randomization funnel plots depicting MR effect size (using two-sided IVW and Egger approaches) across ICD codes detected as FDR significant (excluding proof-of-concept diseases such as E78 Disorders of lipoprotein metabolism and other lipidemias and I10 Essential primary hypertension; see Figure 7 for a full list of FDR-significant diseases). Top 5 plots: exposure dataset (lipid), GERA; outcome dataset, UKB. Remaining plots: exposure dataset (lipid), UKB; outcome dataset, eMERGE.
Supplementary Material
Acknowledgements
eMERGE Network (Phase III). This phase of the eMERGE Network was initiated and funded by the NHGRI through the following grants: U01HG8657 (Group Health Cooperative/University of Washington); U01HG8685 (Brigham and Women’s Hospital); U01HG8672 (Vanderbilt University Medical Center); U01HG8666 (Cincinnati Children’s Hospital Medical Center); U01HG6379 (Mayo Clinic); U01HG8679 (Geisinger Clinic); U01HG8680 (Columbia University Health Sciences); U01HG8684 (Children’s Hospital of Philadelphia); U01HG8673 (Northwestern University); U01HG8701 (Vanderbilt University Medical Center serving as the Coordinating Center); U01HG8676 (Partners Healthcare/Broad Institute); and U01HG8664 (Baylor College of Medicine). UK Biobank. All data for this cohort pertained to project 32133 – “Integration of multi-organ imaging phenotypes, clinical phenotypes, and genomic data”. In addition, Y.V., R.K., T.H., N.R., M.W.M., E.T., and M.D.R. acknowledge NIH GM115318 – Pharmacogenomics of Statin Therapy (POST); Y.V. and M.D.R. also acknowledge NIH AI077505 – Pharmacogenomics of HIV Therapy; J.E.M. acknowledges NHGRI T32HG009495-01; C.M.S. acknowledges R35GM131770 – Pharmacogenetics to improve Drug Therapy; and B.F.V. acknowledges NIH DK101478, NIH HG010067, and Linda Pechenik Montague Investigator Award for their time on this project.
Footnotes
Competing Interests Statement
M.D.R is on the scientific advisory board for Goldfinch Bio and Cipherome. D.J.R serves on Scientific Advisory Boards for Alnylam, Novartis, Pfizer, and Verve and is a founder of Staten Biotechnology. No competing interests are declared for any other co-authors.
References
- 1.Castelli WP Cholesterol and lipids in the risk of coronary artery disease—the Framingham Heart Study. Can. J. Cardiol. 4 Suppl A, 5A–10A (1988). [PubMed] [Google Scholar]
- 2.Kannel WB, Dawber TR, Kagan A, Revotskie N. & Stokes J. Factors of risk in the development of coronary heart disease—six year follow-up experience. The Framingham Study. Ann. Intern. Med. 55, 33–50 (1961). [DOI] [PubMed] [Google Scholar]
- 3.Willer CJ et al. Discovery and refinement of loci associated with lipid levels. Nat. Genet. 45, 1274–1283 (2013). [DOI] [PMC free article] [PubMed] [Google Scholar]
- 4.Teslovich TM et al. Biological, clinical and population relevance of 95 loci for blood lipids. Nature 466, 707–713 (2010). [DOI] [PMC free article] [PubMed] [Google Scholar]
- 5.Hoffmann TJ et al. A large electronic-health-record-based genome-wide study of serum lipids. Nat. Genet. 50, 401–413 (2018). [DOI] [PMC free article] [PubMed] [Google Scholar]
- 6.Klarin D. et al. Genetics of blood lipids among ~300,000 multi-ethnic participants of the Million Veteran Program. Nat. Genet. 50, 1514–1523 (2018). [DOI] [PMC free article] [PubMed] [Google Scholar]
- 7.Barbeira AN et al. Exploring the phenotypic consequences of tissue specific gene expression variation inferred from GWAS summary statistics. Nat. Commun. 9, 1825 (2018). [DOI] [PMC free article] [PubMed] [Google Scholar]
- 8.Gusev A. et al. Integrative approaches for large-scale transcriptome-wide association studies. Nat. Genet. 48, 245–252 (2016). [DOI] [PMC free article] [PubMed] [Google Scholar]
- 9.Consortium GTEx. The Genotype-Tissue Expression (GTEx) project. Nat. Genet. 45, 580–585 (2013). [DOI] [PMC free article] [PubMed] [Google Scholar]
- 10.Gottesman O. et al. The Electronic Medical Records and Genomics (eMERGE) Network: past, present, and future. Genet. Med. 15, 761–771 (2013). [DOI] [PMC free article] [PubMed] [Google Scholar]
- 11.Bycroft C. et al. The UK Biobank resource with deep phenotyping and genomic data. Nature 562, 203–209 (2018). [DOI] [PMC free article] [PubMed] [Google Scholar]
- 12.González-Gay MA & González-Juanatey C. Inflammation and lipid profile in rheumatoid arthritis: bridging an apparent paradox. Ann. Rheum. Dis. 73, 1281–1283 (2014). [DOI] [PubMed] [Google Scholar]
- 13.Pietrzak A, Michalak-Stoma A, Chodorowska G. & Szepietowski JC Lipid disturbances in psoriasis: an update. Mediators Inflamm. 2010, 535612 (2010). [DOI] [PMC free article] [PubMed] [Google Scholar]
- 14.Ference BA, Graham I, Tokgozoglu L. & Catapano AL Impact of lipids on cardiovascular health. J. Am. Coll. Cardiol. 72, 1141–1156 (2018). [DOI] [PubMed] [Google Scholar]
- 15.Reale M. & Sanchez-Ramon S. Lipids at the cross-road of autoimmunity in multiple sclerosis. Curr. Med. Chem. 24, 176–192 (2017). [DOI] [PubMed] [Google Scholar]
- 16.Di Paolo G. & Kim T-W Linking lipids to Alzheimer’s disease: cholesterol and beyond. Nat. Rev. Neurosci. 12, 284–296 (2011). [DOI] [PMC free article] [PubMed] [Google Scholar]
- 17.Chesmore K, Bartlett J. & Williams SM The ubiquity of pleiotropy in human disease. Hum. Genet. 137, 39–44 (2018). [DOI] [PubMed] [Google Scholar]
- 18.Watanabe K. et al. A global overview of pleiotropy and genetic architecture in complex traits. Nat. Genet. 51, 1339–1348 (2019). [DOI] [PubMed] [Google Scholar]
- 19.Sivakumaran S. et al. Abundant pleiotropy in human complex diseases and traits. Am. J. Hum. Genet. 89, 607–618 (2011). [DOI] [PMC free article] [PubMed] [Google Scholar]
- 20.Bulik-Sullivan B. et al. An atlas of genetic correlations across human diseases and traits. Nat. Genet. 47, 1236–1241 (2015). [DOI] [PMC free article] [PubMed] [Google Scholar]
- 21.Webb TR et al. Systematic evaluation of pleiotropy identifies 6 further loci associated with coronary artery disease. J. Am. Coll. Cardiol. 69, 823–836 (2017). [DOI] [PMC free article] [PubMed] [Google Scholar]
- 22.Andreassen OA et al. Abundant genetic overlap between blood lipids and immune-mediated diseases indicates shared molecular genetic mechanisms. PLoS One 10, e0123057 (2015). [DOI] [PMC free article] [PubMed] [Google Scholar]
- 23.Kim YK et al. Evaluation of pleiotropic effects among common genetic loci identified for cardio-metabolic traits in a Korean population. Cardiovasc. Diabetol. 15, 1–11 (2016). [DOI] [PMC free article] [PubMed] [Google Scholar]
- 24.Ligthart C. et al. Bivariate genome-wide association study identifies novel pleiotropic loci for lipids and inflammation. BMC Genomics 17, 443 (2016). [DOI] [PMC free article] [PubMed] [Google Scholar]
- 25.Nikpay M, Turner AW & McPherson R. Partitioning the pleiotropy between coronary artery disease and body mass index reveals the importance of low frequency variants and central nervous system-specific functional elements. Circ. Genomic Precis. Med. 11, e002050 (2018). [DOI] [PubMed] [Google Scholar]
- 26.Zhang X. et al. Detecting potential pleiotropy across cardiovascular and neurological diseases using univariate, bivariate, and multivariate methods on 43,870 individuals from the eMERGE network. Pac. Symp. Biocomput. 24, 272–283 (2019). [PMC free article] [PubMed] [Google Scholar]
- 27.Davey Smith G. & Ebrahim S. ‘Mendelian randomization’: can genetic epidemiology contribute to understanding environmental determinants of disease? Int. J. Epidemiol. 32, 1–22 (2003). [DOI] [PubMed] [Google Scholar]
- 28.Urbut SM, Wang G, Carbonetto P. & Stephens M. Flexible statistical methods for estimating and testing effects in genomic studies with multiple conditions. Nat. Genet. 51, 187–195 (2019). [DOI] [PMC free article] [PubMed] [Google Scholar]
- 29.Giambartolomei C. et al. Bayesian test for colocalisation between pairs of genetic association studies using summary statistics. PLoS Genet. 10, e1004383 (2013). [DOI] [PMC free article] [PubMed] [Google Scholar]
- 30.Yang J. et al. Conditional and joint multiple-SNP analysis of GWAS summary statistics identifies additional variants influencing complex traits. Nat. Genet. 44, 369–375 (2012). [DOI] [PMC free article] [PubMed] [Google Scholar]
- 31.Consortium GTEx. The GTEx Consortium atlas of genetic regulatory effects across human tissues. Science 369, 1318–1330 (2020). [DOI] [PMC free article] [PubMed] [Google Scholar]
- 32.Gamazon ER et al. A gene-based association method for mapping traits using reference transcriptome data. Nat. Genet. 47, 1091–1098 (2015). [DOI] [PMC free article] [PubMed] [Google Scholar]
- 33.Butler R. The ICD-10 General Equivalence Mappings. Bridging the translation gap from ICD-9. J. AHIMA 78, 84–85 (2007). [PubMed] [Google Scholar]
- 34.Xu L. et al. An association study between genetic polymorphisms related to lipoprotein-associated phospholipase A(2) and coronary heart disease. Exp. Ther. Med. 5, 742–750 (2013). [DOI] [PMC free article] [PubMed] [Google Scholar]
- 35.Wolpin BM et al. Prospective study of ABO blood type and the risk of pulmonary embolism in two large cohort studies. Thromb. Haemost. 104, 962–971 (2010). [DOI] [PMC free article] [PubMed] [Google Scholar]
- 36.Hajizadeh R, Kavandi H, Nadiri M. & Ghaffari S. The association of ABO blood group with incidence and outcome of acute pulmonary embolism. Turk Kardiyol. Dern. Arsivi-Archives Turkish Soc. Cardiol. 44, 397–403 (2016). [DOI] [PubMed] [Google Scholar]
- 37.Zhang J, Zhao Z, Guo X, Guo B. & Wu B. Powerful statistical method to detect disease-associated genes using publicly available genome-wide association studies summary data. Genet. Epidemiol. 43, 941–951 (2019). [DOI] [PubMed] [Google Scholar]
- 38.Lumish HS, O’Reilly MP & Reilly MP Sex differences in genomic drivers of adipose distribution and related cardiometabolic disorders: opportunities for precision medicine. Arterioscler. Thromb. Vasc. Biol. 40, 45–60 (2020). [DOI] [PubMed] [Google Scholar]
- 39.Reshef YA et al. Detecting genome-wide directional effects of transcription factor binding on polygenic disease risk. Nat. Genet. 50, 1483–1493 (2018). [DOI] [PMC free article] [PubMed] [Google Scholar]
- 40.Cantuti-Castelvetri L. et al. Defective cholesterol clearance limits remyelination in the aged central nervous system. Science 359, 684–688 (2018). [DOI] [PubMed] [Google Scholar]
- 41.Fard MK et al. BCAS1 expression defines a population of early myelinating oligodendrocytes in multiple sclerosis lesions. Sci. Transl. Med. 9, eaam7816 (2017). [DOI] [PMC free article] [PubMed] [Google Scholar]
- 42.Kung JTY, Colognori D. & Lee JT Long noncoding RNAs: Past, present, and future. Genetics 193, 651–669 (2013). [DOI] [PMC free article] [PubMed] [Google Scholar]
- 43.Ginn L, Shi L, La Montagna M. & Garofalo M. LncRNAs in non-small-cell lung cancer. Non-coding RNA 6, 25 (2020). [DOI] [PMC free article] [PubMed] [Google Scholar]
- 44.Zhong R. et al. LINC01149 variant modulates MICA expression that facilitates hepatitis B virus spontaneous recovery but increases hepatocellular carcinoma risk. Oncogene 39, 1944–1956 (2020). [DOI] [PubMed] [Google Scholar]
- 45.Feng X. & Yang S. Long non-coding RNA LINC00243 promotes proliferation and glycolysis in non-small cell lung cancer cells by positively regulating PDK4 through sponging miR-507. Mol. Cell. Biochem. 463, 127–136 (2020). [DOI] [PubMed] [Google Scholar]
- 46.Yu X, Chen H, Huang S. & Zeng P. Evaluation of the causal effects of blood lipid levels on gout with summary level GWAS data: two-sample Mendelian randomization and mediation analysis. J. Hum. Genet. 66, 465–473 (2021). [DOI] [PubMed] [Google Scholar]
- 47.Marien E. et al. Non-small cell lung cancer is characterized by dramatic changes in phospholipid profiles. Int. J. Cancer 137, 1539–1548 (2015). [DOI] [PMC free article] [PubMed] [Google Scholar]
- 48.Eggers LF et al. Lipidomes of lung cancer and tumour-free lung tissues reveal distinct molecular signatures for cancer differentiation, age, inflammation, and pulmonary emphysema. Sci. Rep 7, 11087 (2017). [DOI] [PMC free article] [PubMed] [Google Scholar]
- 49.Tiwary S. et al. Metastatic brain tumors disrupt the blood-brain barrier and alter lipid metabolism by inhibiting expression of the endothelial cell fatty acid transporter Mfsd2a. Sci. Rep. 8, 8267 (2018). [DOI] [PMC free article] [PubMed] [Google Scholar]
- 50.Sun H, Zhang X, Shi W. & Fang B. Association of soft tissue infection in the extremity with glucose and lipid metabolism and inflammatory factors. Exp. Ther. Med. 17, 2535–2540 (2019). [DOI] [PMC free article] [PubMed] [Google Scholar]
- 51.Gao S, Cui X, Wang X, Burg MB & Dmitrieva NI Cross-sectional positive association of serum lipids and blood pressure with serum sodium within the normal reference range of 135–145 mmol/L. Arterioscler. Thromb. Vasc. Biol. 37, 598–606 (2017). [DOI] [PMC free article] [PubMed] [Google Scholar]
- 52.Goldstein I. et al. p53, a novel regulator of lipid metabolism pathways. J. Hepatol. 56, 656–662 (2012). [DOI] [PubMed] [Google Scholar]
- 53.Mäkinen N. et al. Exome sequencing of uterine leiomyosarcomas identifies frequent mutations in TP53, ATRX, and MED12. PLoS Genet. 12, e1005850 (2016). [DOI] [PMC free article] [PubMed] [Google Scholar]
- 54.Parrales A. & Iwakuma T. p53 as a regulator of lipid metabolism in cancer. Int. J. Mol. Sci. 17, 2074 (2016). [DOI] [PMC free article] [PubMed] [Google Scholar]
- 55.Veturi Y. & Ritchie MD How powerful are summary-based methods for identifying expression-trait associations under different genetic architectures? Pac. Symp. Biocomput. 23, 228–239 (2018). [PMC free article] [PubMed] [Google Scholar]
- 56.Olafsdottir T. et al. Genome-wide association identifies seven loci for pelvic organ prolapse in Iceland and the UK Biobank. Commun. Biol. 3, 129 (2020). [DOI] [PMC free article] [PubMed] [Google Scholar]
- 57.Wainberg M. et al. Opportunities and challenges for transcriptome-wide association studies. Nat. Genet. 51, 592–599 (2019). [DOI] [PMC free article] [PubMed] [Google Scholar]
- 58.Verma SS et al. Imputation and quality control steps for combining multiple genome-wide datasets. Front. Genet. 5, 370 (2014). [DOI] [PMC free article] [PubMed] [Google Scholar]
- 59.Purcell S. et al. PLINK: a tool set for whole-genome association and population-based linkage analyses. Am. J. Hum. Genet. 81, 559–575 (2007). [DOI] [PMC free article] [PubMed] [Google Scholar]
- 60.Bulik-Sullivan BK et al. LD Score regression distinguishes confounding from polygenicity in genome-wide association studies. Nat. Genet. 47, 291–295 (2015). [DOI] [PMC free article] [PubMed] [Google Scholar]
- 61.Yengo L. et al. Meta-analysis of genome-wide association studies for height and body mass index in ~700000 individuals of European ancestry. Hum. Mol. Genet. 27, 3641–3649 (2018). [DOI] [PMC free article] [PubMed] [Google Scholar]
- 62.Berisa T. & Pickrell JK Approximately independent linkage disequilibrium blocks in human populations. Bioinformatics 32, btv546 (2015). [DOI] [PMC free article] [PubMed] [Google Scholar]
- 63.Macarthur J. et al. The new NHGRI-EBI Catalog of published genome-wide association studies (GWAS Catalog). Nucleic Acids Res. 45, D896–D901 (2017). [DOI] [PMC free article] [PubMed] [Google Scholar]
- 64.Eicher JD et al. GRASP v2.0: an update on the Genome-Wide Repository of Associations between SNPs and phenotypes. Nucleic Acids Res. 43, 799–804 (2014). [DOI] [PMC free article] [PubMed] [Google Scholar]
- 65.Verbanck M, Chen C-Y, Neale B. & Do R. Detection of widespread horizontal pleiotropy in causal relationships inferred from Mendelian randomization between complex traits and diseases. Nat. Genet. 50, 693–698 (2018). [DOI] [PMC free article] [PubMed] [Google Scholar]
- 66.Yavorska OO & Burgess S. MendelianRandomization: an R package for performing Mendelian randomization analyses using summarized data. Int. J. Epidemiol. 46, 1734–1739 (2017). [DOI] [PMC free article] [PubMed] [Google Scholar]
- 67.Hemani G. et al. The MR-Base platform supports systematic causal inference across the human phenome. Elife 7, e34408 (2018). [DOI] [PMC free article] [PubMed] [Google Scholar]
- 68.anastasia-lucas/hudson: A Hudson Plot Package version 0.1.0 from GitHub. Available at: https://rdrr.io/github/anastasia-lucas/hudson/. (Accessed: 5th March 2020)
- 69.Conway JR, Lex A. & Gehlenborg N. UpSetR: an R package for the visualization of intersecting sets and their properties. Bioinformatics 33, 2938–2940 (2017). [DOI] [PMC free article] [PubMed] [Google Scholar]
- 70.Zuguang Gu. circlize R package. CRAN (2019). [Google Scholar]
- 71.Pruim RJ et al. LocusZoom: regional visualization of genome-wide association scan results. Bioinformatics 26, 2336–2337 (2010). [DOI] [PMC free article] [PubMed] [Google Scholar]
Associated Data
This section collects any data citations, data availability statements, or supplementary materials included in this article.
Supplementary Materials
Data Availability Statement
This project corresponds to UK Biobank application ID 32133 and eMERGE Network Phase III (dbGaP study accession number phs001584.v1.p1). Lipid GWAS summary statistics for GLGC 20133 are publicly available for download (http://csg.sph.umich.edu/willer/public/lipids2013/). Lipid GWAS summary statistics for GERA5 are available via dbGaP (accession number phs000674.v2.p2). Expression prediction models with LD reference data using MASHR are available on Zenodo (https://zenodo.org/record/3518299/files/mashr_eqtl.tar?download=1). GTEx Analysis Release v8 (dbGaP Accession phs000424.v8.p2) is available for download via the GTEx Portal (https://gtexportal.org/home/datasets). Summary statistics for lipid GWAS, lipid TWAS, lipid guided PheWAS and Xpress PheWAS generated in this study are available on Figshare (https://figshare.com/s/d62961bbc6c45c8dc2b0).


